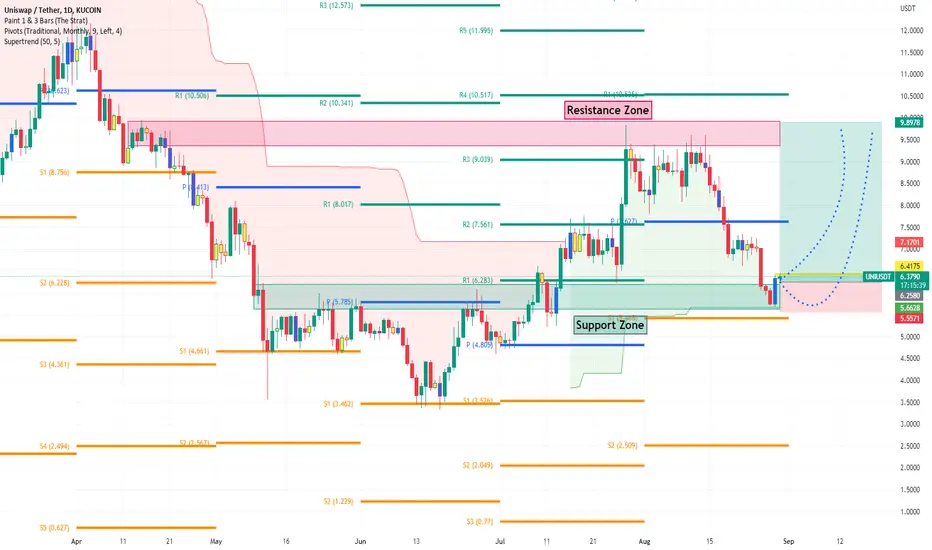
UNIUSDTUNIUSDT(09.03.2022 UPDATED)
Wait until price touches the trend lines then look for signal bar and key bar /Breakout and pullback to recognize direction of price movement.
Money Management must be obeyed.
Open position without setting the proper stop loss (1% or 2% of total balance ) soon or late will cause to lose all your money ( call margin )
Majority of trades is done via computer trading (forex / cryptocurrency)
priority in analyzing charts:
1- Price Action
2- Market structure
3- Chart patterns
4- Candlestick patterns
5-Divergence
6-Indicators
UNIUST trade ideas

UNI Uniswap Price PredictionGrayscale expressed concerns over the potential impact on the Ethereum Merge, especially on tokens that run natively on Ethereum:
The Merge may lead to a fork that might have unexpected and unfavorable outcomes and a scenario where stablecoins and tokens locked in smart contracts might not be redeemable.
Token and stablecoin holders might panic and start liquidating their holdings.
In this context, price target for UNI Uniswap is $3.55.
Looking forward to read your opinion about it.

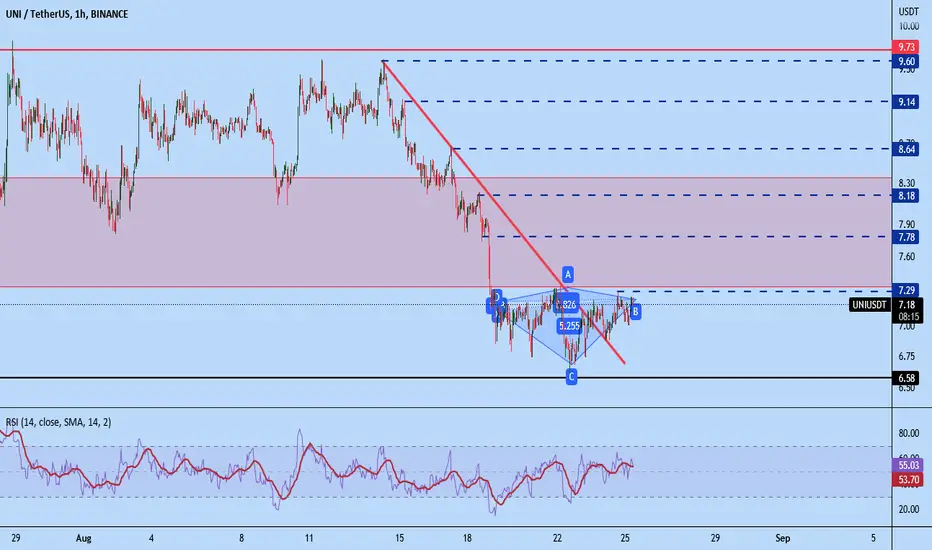
AB=CDFormation of the AB=CD pattern in the daily time frame and ready to climb up to the specified range

UNIThe price is forming an upward channel. Daily 100 MA - strong resistance at the upper border of the pattern. In case of breaking through the resistance, the price may rise to the level of the daily 50-100 EMAs


UNI🥣 nice support to buy 💹 ready for move up Hello guys i hope u are all doing well
MATIC/USDT looks Bullish , price very close to support 💹
If u agree with me press like button

Uniswap: overview for August 30Uniswap is in the downtrend on the Daily timeframe. The market is in the correction wave now. A pullback selling opportunity will appear after the bearish candle on the Daily timeframe is closed.
The main target for the bearish movement is the support level formed on August 27 – 29. Its borders are $5.68 – $5.74.
Short positions will remain relevant until the market is below the nearest resistance level on the Daily timeframe, the highs of August 20 – 22.
When breaking through the resistance, the trend will reverse and we should look for buying opportunities . In this case the target will be around the resistance level with the borders of $9.25 – $9.62.

UNI/USDT looking to breakout as wellGood morning guys,
Looking at UNI/USDT and pattern is similar to other!! We have a "Falling Wedge" pattern which is looking to breakout! So far we have had 2 corrections where last one ended up with pullback. We are waiting for confirmational breakout which would be a long 4hr candle!
What are your thought about this coin?
If you like ideas provided by our team you can show us your support by liking and commenting.
Yours Sincerely,
Swallow Team 🔱
Disclamer:
We are not financial advisors. The content that we share on this website are for educational purposes and are our own personal opinions.

UNI (falling wedge)UNI / USDT
Classic falling wedge breakout
As long as price is holding above resistance line
Priority is bullish

#Uni long ideaHello dear Traders,
Here is my idea for #UNI
Daily outside bar (blue candle) has been formed and we will wait for a close above the yellow trigger line in the 4h chart to enter the trade.
Profit target 9.9$ and Risk Reward ratio 5.2
Please feel free to ask any question in comments. I will try to answer all! Thank you.
UNIUSDT | FALLING WEDGEUNIUSDT has been trading with in a falling wedge . Currently price is trading near the upper boundary of wedge. We are watching out price action near the upper boundary.
An upside break from the wedge will call for more bulls.
Trade your levels accordingly.

UNIUSDTUNIUSDT(08.28.2022 UPDATED)
Wait until price touches the trend lines then look for signal bar and key bar /Breakout and pullback to recognize direction of price movement.
Money Management must be obeyed.
Open position without setting the proper stop loss (1% or 2% of total balance ) soon or late will cause to lose all your money ( call margin )
Majority of trades is done via computer trading (forex / cryptocurrency)
priority in analyzing charts:
1- Price Action
2- Market structure
3- Chart patterns
4- Candlestick patterns
5-Divergence
6-Indicators

UNIIt looks like the price has formed a bearish head and shoulders pattern. The downtrend may continue to the level of $5-4.5

Uniswap ScalpWe have a lot of bullish divergence along with a Wave 5 bottom here. The RSI and Momentum looks good on multiple time frames. I see this as a short term trade based on the current market conditions. In my opinion, the risk to reward is too good to pass up right now. We have a lot of resistance around the scalp target so I see that as a good place to take profits.
This chart based off of The Elliot Wave Theory, Fibonacci, EMA’s, MacD , RSI , Momentum, and resistance/support zones combined with patterns.

uni/usdt 2hr rsi oversold in multiple time frames, hit support, looking to long for a swing trade, tight stop loss, and take profit at last resistance, if bitcoin recovers so will this, they move very closely together.

UNIThe price is approaching a strong support level. Its penetration will be a strong bearish signal. Possible options for price movement are indicated

📊 UNI accumulate power before PUMP. 2 entry points!Hi friends! UNI is the most profitable altcoin of the last 1-2 months. I think this trend will continue and we will see new highs soon. This crypto platform keeps growing and a lot of buyers will support and push the price higher, when the pump happen.
🚩 Now the price of UNI is inside the $6.75-7.30 support area.
📊 Here the preconditions to open a long:
🔥 false breakout of the local lows which create after this local dump. The price need to go lower the support area to activate the stops of long traders.
🔥 growth of the volume confrirms us that during this price movements a lot of traders buy UNI to go long. Especially, this precondition show us the whales pressence which want to buy more UNI so they trap long traders in such way.
🔥 bullish BTC help ot UNI but all alts to reach their new highs. As i said before, UNI is te most profitable among other altcoins so pay you attention to this coin.
🚩 DOM and Footprint scalping tools help me identify the whales buy orders and open the trade with them during this false breakout. In this case i can set short stop loss and get the best risk to reward ratio.
📊 The targets:
1. $10 - the closest key level, even number and big resistance. If the price break this level up, it will be great possibility to add to your position or open another good long.
🚩 But if i will see the price weakness and such things as false breakout of this level, i`ll realize my profit and try to find the entry to short trade. Also DOM and Footprint show the huge whales sell orders.
2. $13 - the key level
💻Friends, press the "boost"🚀 button, write comments and share with your friends - it will be the best THANK YOU.
P.S. Personally, I open an entry if the price shows it according to my strategy.
Always do your analysis before making a trade.

UNI/USDTUNI/USDT
The downtrend line has broken upwards.
It is not far-fetched to expect the price to rise to at least $8.
On the other hand, it has also formed a diamond pattern.
So it can grow.
#UNI #UNIUSDT #BTC #BTCUSD #LUNA #LUNC #UST
UNI Forecast 📊 (H4)Whats Up Retail Whales 🐋
Before we start to discuss, id be so glad if you share your opinion on this post's comment section and hit the like button if you gained value!
#UNI/USDT
- EQL were manipulated before price broke structure
- Price left a strong imbalance that is now being filled
- Multiple Liquidity lows were taken as inducements
- Expecting price to hold our 4Hr Whale Block for a LTF Entry
- HTF bias, we could see the EQH tops purged
- If demand fails and holds below we will shift bearish again.
Alerts set on 4Hr Whale Block
Remember we are trading human emotions and probabilities
Hope you enjoy the content we create, You can support us with your likes and cheers 🙏🙏
❗️Attention: this isn't financial advice we are just trying to help people with their vision.
HooRaa

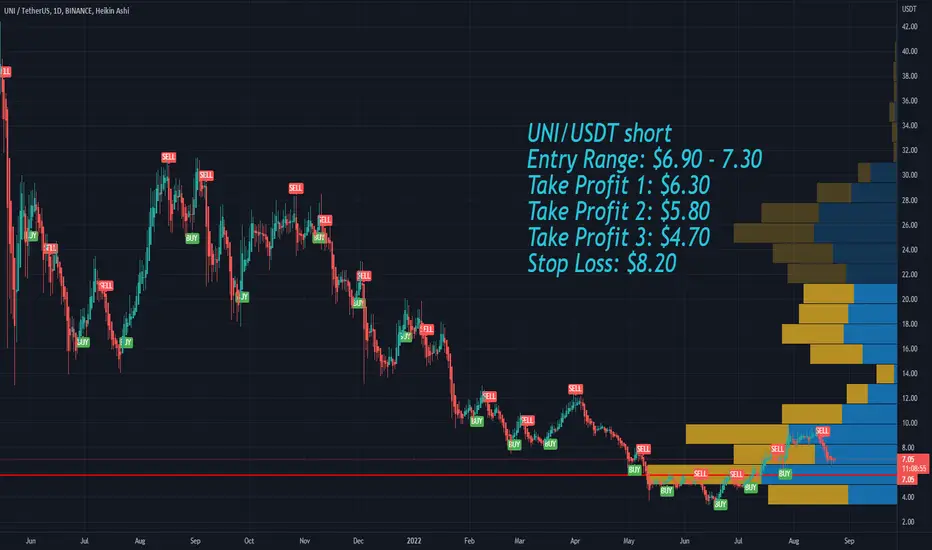
Uniswap UNI short Entry Range, Take Profit and Stop LossUNI/USDT short
Entry Range: $6.90 - 7.30
Take Profit 1: $6.30
Take Profit 2: $5.80
Take Profit 3: $4.70
Stop Loss: $8.20
UNIUSDTHello Crypto Lovers,
Mars Signals team wishes you high profits.
This is a 4-hour-time frame analysis for UNIUSDT
Based on our previous analysis on August 13, we predicted a falling trend and now one of our targets is hit. Presently, we have R1 line as a resistance line that shows the price was not able to rise at some points. S1 is our support line and the well support of price at some points is clear. And S2 used to be a resistance area. So you see that we have the price fluctuating below R1 and we expect it will rise to S1 and by reaching there, if we have some confirmation candles, our short position is activated and a decline is waiting for the price up to S2. It may happen that the price is able to fix itself above R1 and have more rise.
Warning: This is just a suggestion and we do not guarantee profits. We advise you to analyze the chart before opening any positions.
Wish you luck

buywe stop and seee it to choch
because it is good base and it is the tt target that is broken down if we see triger we can buy it

UNIUSDTUNIUSDT(08.19.2022 UPDATED)
Wait until price touches the trend lines then look for signal bar and key bar /Breakout and pullback to recognize direction of price movement.
Money Management must be obeyed.
Open position without setting the proper stop loss (1% or 2% of total balance ) soon or late will cause to lose all your money ( call margin )
Majority of trades is done via computer trading (forex / cryptocurrency)
priority in analyzing charts:
1- Price Action
2- Market structure
3- Chart patterns
4- Candlestick patterns
5-Divergence
6-Indicators
