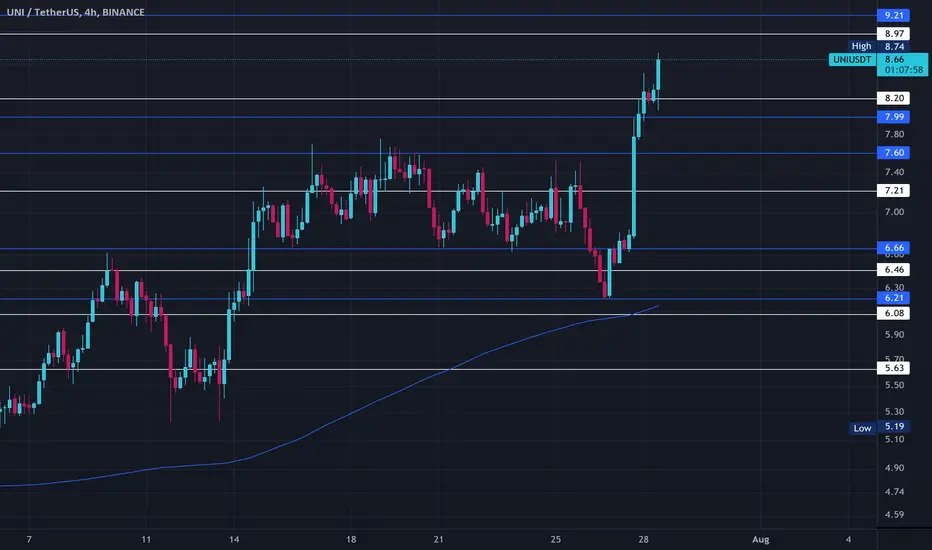
UPDATE: UNI UP 83% after bullish signal - Ready for more 🚀UNI pumped 83% after the bullish Supertrend Ninja - Clean signal (green vertical line on the background).
UNI broke out of the bullish Zone of the Ichimoku Cloud , which is bullish . The RSI is in the bullish zone at 69. If we take a look at the Average Directional Index ( ADX DI) its bullish . The +DI (Green Line) is above the -DI (Red Line). Although the green line is pointing downwards. The Trend Strength is still strong. Since the ADX (Orange Line) is above its 9 Period EMA (Black Line).
Currently UNI is also above its Bollinger Bands Upper Band, Band Basis 20 Period SMA . A retrace within the Bollinger Band and the ADX pointing downwards, means a retrace is more likely. Note: UNI also hit the resistance (grey block).
Waiting patiently on a bullish Supertrend Ninja signal served me well.
Thank you for reading.
Namasté 🙏
Disclaimer: Ideas are for entertainment purposes only. Not financial advice. Your own due diligence is highly advised before entering trades. Past performance is no guarantee of future returns.
What Indicators Do I Use:
In the chart I am using the "Supertrend Ninja - Clean", which is a trend-following indicator (Green and red vertical lines on the background). When the background of the candlestick closes green (vertical line). It indicates a possible bullish (up)trend. And red for downtrends.
UNIUST trade ideas

Week 07 | UNIUSDT | Short Position | H1 | 29-07-2022UNIUSDT has made AB=CD bearish harmonic pattern after the retracement from 0.618 fib level. There is strong resitance as well. Bearish inside bar shows that bullish trend has been finished but for confirmation we will wait for the higher low to break. So taking a short position at this level.

UNI long profit. forecast !UNI was pushed up a lot, the ascending channel was broken, I think we will test it in the near future and fly further!
In order not to miss a buy signal, subscribe and stay tuned for new ideas. Every day I post 10 profitable ideas a day.

UNIThe price is trying to break through the 200 EMA for the first time since November 2021. If successful, the price will rise to $12. The bearish scenario will lower the price to the lower border of the channel or to 100 EMA

UNIUSDTiam watching this one for 2 days it broke all resistance the next target for me is 9 but if in daily timeframe break the sma 200 we can see much more uptrend .
UNIUSD ❕ decreased volatilityThe volatility at the price peak began to decrease.
UNI entered overbought zone (4H TF)
TD Sequential formed a reversal signal downwards (4H and 30m TFs)
Price formed a bearish divergence with RSI and trading volumes on the 1H Timeframe.
BB indicator is overbought (30m TFs)
I expect that the asset will start a correction only after fixing under the support level.


UNIUSDT | TESTING RESISTANCEUNIUSDT has been in bullish trend after breaking out falling resistance. The price has retraced to 0.5 fib level. While the same zone is also a horizontal resistance area. The bullish momentum may halt here. The bears may took control from here.
While bullish momentum will be now only above break and sustain above resistance zone.
Trade your levels accordingly.

UNIUSDT 3D A unicorn appears on the Uniswap chartToday, let's take a look at the UNIUSDT trading pair on the 3-day time frame.
In general, the classic scheme, as for most altcoins - the price has been in a falling channel for more than a year.
But on the UNIUSD chart we see some cunningly hidden power of buyers, it seems to us that something interesting is being prepared around Uniswap.
Maybe some strong fundamental news is on the way?) Share, please, in the comments, because we don't follow such.
In general, the following route looks realistic for the coming month:
- correction in the area of 6 dollars (retest level that did not let up for a long time)
- fixing UNI price in the upper part of the global descending channel.
- rapid growth in the region of $12-13, and this is modest x2)
_______________________________
Since 2016 , we have been analyzing and trading the cryptocurrency market.
We transform our knowledge, trading moods and experience into ideas. Each "like under the idea" boosts the level of our happiness by 0.05%. If we help you to be calmer and richer — help us to be happier :)

UNIThe price may continue its impulse growth to the upper border of the rising wedge, after which the correction will begin

UNIUSDTPERPAfter the failure of the support zone in this currency, a pullback and price drop is expected, and it seems to be an attractive position for a sell position.

UNIThe price fell to the lower border of the wedge and 100 EMA. In case of a breakdown of the lower border, the price will fall by 200 EMA/MA. Possible scenarios of price movement are indicated

UNI (bullish flag)UNI / USDT
This coin is one of most impressive coins during bear market and running over 50% in spot after we bought it
Currently it printed a bullflag which is a bullish continuation pattern : a break above this pattern may produce another bullish toward 9$-12$
The only concern these days is BTC , because altcoins wont do much when the king is in decline thanks to the bad international economic environment in background..etc
However we will monitor the price action at resistance if bullflag broken ,, the chance for next bullish wave is high

UNI Could Be Bearish Movement (Read Description) - Crypto 18❶ Warning
Operations in the Blockchain or FX market represent a high risk. Cryptoz18 is a content creator who posts his ideas for viewers however he never provides an investment recommendation. I recommend to the reader a good risk management and knowledge regarding the environment. Thank you very much.
❷ Tutorials
➤ Here you can find a brief explanation of how the operations work in case you are interested in following them.
➤ Here you can find an explanation of how to track our ideas:
✔️ Our operations are taken with StopLoss and Take Profit of 15 minutes. However, we are looking to try and catch a 4H trend. So, once we touch the TPM according to your own analysis you should consider whether to close the trade or move StopLoss to entry.
❸ Summary
First, I have to open my trades on Binance, if not then I don't have time. Sadly it took me a long time and a lot of the movement just happened, if it doesn't go back to that entry consider changing the setup settings.
❹ Operational Information
• Entry price: 7.194
• StopLoss: 7.521 (Loss 4.63%)
• TakeProfit Minimum: 6.633 (Win 7.77%)
• Recommended margin: 5% of the Futures account
• Recommended leverage: 1x.
• Temporality: 15Min - 4H

UNIUSDTPERPDue to the creation of lower floors and ceilings in the recent steps of movement, with the price coming below the current candle, we can imagine the continuation of the fall for this currency.

UPDATE: UNI UP 43% after bullish daily signal.UNI pumped 43% after the bullish Supertrend Ninja - Clean signal (green vertical line on the background).
UNI broke out of the bullish Zone of the Ichimoku Cloud , which is bullish. The RSI is in the bullish zone at 63. If we take a look at the Average Directional Index ( ADX DI) its bullish. The +DI (Green Line) is above the -DI (Red Line). While the Trend Strength is becoming stronger. Since the ADX (Orange Line) is above its 9 Period EMA (Black Line). Currently UNI is also above its Bollinger Bands Middle, Band Basis 20 Period SMA. Which is a bullish sign as well.
Waiting patiently on a bullish Supertrend Ninja signal, before entering a long paid off.
Thank you for reading.
Namasté 🙏
Disclaimer: Ideas are for entertainment purposes only. Not financial advice. Your own due diligence is highly advised before entering trades. Past performance is no guarantee of future returns.
What Indicators Do I Use:
In the chart I am using the "Supertrend Ninja - Clean", which is a trend-following indicator (Green and red vertical lines on the background). When the background of the candlestick closes green (vertical line). It indicates a possible bullish (up)trend. And red for downtrends.

UNIUSDT BULLTRAP OR UPWARD CONTINUATION ?
Hello Traders,
Please feel free to like my idea or even comment :)
- UNI broke above the local resistance at 6.10$ which completed a bullish inverse head and shoulders pattern. The bears tried to push the price back below the breakout level and they succeed pushing the price below again
suggesting that we were into a bull trap. Price fell towards EMA20 of 5.39$ yet price action bounced back with strength ( aggressive buying ) respecting as well our trendline support. Buyers should take the price above 6.10$ in order to
pick the momentum and reach the nearest resistance level on 6.80$
- If price got weakened and fall below EMA20 and EMA50 it suggests that buyers couldnt bring up the momentum and they are losing control, failing to make a new higher low also by breaking the trendline support, price could fall again
towards support level of 4.00$ - 4.50$
Good Luck Traders

UNIThe price approaches the upper border of the wedge. In case of strong bullish momentum, the wedge can be broken to the level of 200 MAs. Bearish scenario will turn the price down and lower to 50 EMA

UNIUSDT is inside an ascending channel 🦐UNIUSDT on the 4h chart is trading inside an ascending channel.
The price is now testing the 4h support and might provide a deeper bearish move.
How can i approach this scenario?
I will wait for a clear break of the support and in that case, i will search for a nice short order according to the Plancton's strategy rules.
–––––
Keep in mind.
🟣 Purple structure -> Monthly structure.
🔴 Red structure -> Weekly structure.
🔵 Blue structure -> Daily structure.
🟡 Yellow structure -> 4h structure.
–––––
Follow the Shrimp 🦐

uniusdt short TAuniusdt potential short formation
Uniswap is a cryptocurrency exchange which uses a decentralized network protocol. Uniswap is also the name of the company that initially built the Uniswap protocol. The protocol facilitates automated transactions between cryptocurrency tokens on the Ethereum blockchain through the use of sma

UNIUSDT Chart AnalysisWell how to start !! Everything is in green from the past few days so as UNI, it's in nice uptrend heading towards the resistance which is at around 6% above from here ( Resistance at $8.146).
Currently it's in middle of the river, so what to do now? IMO as $BTC is testing it's breakout zone, I see no reason to be bearish for short term atleast it doesn't mean that I'm suggesting you to go long here, you can trade UNI if you want but make sure you ready to take big risk cause may be the local support zone at $7.3 may hold but don't trade based on the expectations. Let the market to tell us what we need to do.
So what's next? My suggestion is to let it come to one of our zones, may be retracement towards $7.31 price zone, I'll update if I observe high interest there, with respect that you can plan your trade.
What if it headed towards straight away towards resistance well then we can observe again and based on the appearing interest at that time let's decide whether we have to be on long side or short side. See guys no need to rush planning is everything.
Disclaimer : Anything provided here are only my opinions and ideas. I am not giving any financial advices, trade at your risk.

uniusdtuniusdt may see a redistribution schematic and we might get a chance to short it at premium discount
NFA DYOR

UNIUSDTINTRADAY ANALYSIS
Timeframe 15M
Wait until price touches the trend lines then look for signal bar and key bar to recognize direction of price movement.
Money Management should be obeyed.
