UNI has a very good investment opportunity Hi Everyone;
today we have one of the best risk to reward Investment opportunity
it is more than 500 times the risk and the chart is look very promising.
I expect breaking the previous bear market key point will clear the way to the final target
UNIUST trade ideas

Uniswap (UNI) Targets $20 in Bullish Breakout—What's Next?Uniswap (UNI) is showing strong bullish momentum, trading at $18.49, and has broken through key resistance levels. The price has surpassed the 0.236 Fibonacci retracement level at $14.65, and it is approaching the 0.5 Fibonacci level at $20.37. If the momentum continues, UNI could target $22.92 (0.618 Fibonacci) and potentially $26.55 (0.786 Fibonacci) in the medium term.
However, immediate resistance at $20.37 could lead to consolidation or a short-term pullback. Key support levels to watch include $14.65, $9.49, and $7.71 in case of a correction.
Outlook:
Short-term: Bullish, with a target at $20.37.
Medium-term: Potential rally toward $22.92 and $26.55.
Long-term: Bullish, with risks of correction near major resistance zones.
UNI remains well-positioned for further gains if it holds above $14.65 and breaks through $20.37.

Uniswap Pre-2025 Bull-Market Accumulation Zone & StrategyUniswap is now trading back into its long-term accumulation channel, the "accumulation zone"; a great opportunity...
Hello my beloved traders, how are you feeling in this wonderful day?
➖ If you look at the other side, like "over the fence," you will notice that the entire stock market is overbought. The indexes are trading at resistance or at All-Time Highs, and all the stocks are massively overbought; ready to crash.
➖ If you look at this side, like this chart here, UNIUSDT, you will notice that all the altcoins are trading low, near support or at All-Time Lows. The altcoins are now trading within their "accumulation zone." A very interesting dynamic.
The stock market is set to produce an epic crash. Billions upon billions upon billions of dollars are going to take flight looking for a safe-haven. As the stock market crashes, crypto is going to grow.
Think of it this way: The stock market has been moving north while the crypto market has been moving south. We are about to experience a 180 degrees turn; the stock market will go south (down) while the crypto market goes north (up).
If you are reading this, you are one of the wise ones, one of the lucky ones, one of the fortunate ones, one of the chosen few; you are blessed, that's for sure.
The strategy remains the same: Sell those trading high up (stocks), buy those trading low/near support (crypto). That's the theme of the day.
Thank God we have the cryptocurrency market. It will save us from the financial meltdown that is underway.
Thank you for reading.
Namaste.

Here I buy Uniswap at $17Here I buy Uniswap at $17
And Uniswap major supply shock is happening before your eyes
Oooh written in the stars
A million miles away
A message to the maaaaaain
Ooooh
Seasons come and go
But I will never change
And I'm on my waaay

UNIUSDT IDEAHi , this is my idea about UNIUSDT
Lately all coins are pushing after a bullish flag this looks the same.
Pretty sure it will hit the resistance shortly.
Not a financial advice.

Uniswap long to $18Just recently opened a uniswap long trade.
Target is $18+
First tp : $17.1 around the previous weekly wick high to the left.
70% partial
Next is $18 where I have another limit order to take off 15% of position. Afterwards I'll re-assess and determine whether o close fully or hold.
I have my stop below the 1hr structure low on this trade. It should be sufficient as long as we don't get another deep correction before 17.1. I think $17.1 is quite probable. Its currently 11:10 am in the morning.
If it moves anything like bitcoin then I anticipate within the next 2hrs it should start pushing back up for next leg.
Adjusted stop from 15.4 to 15.3

Easy 3x from here for UniswapWhen it comes to DEFI, what is the go-to website for you?
For me it's Uniswap, with clarity of regulation down the road as Trump takes office, UNI is destined to succeed in my opinion.
The chart looks amazing as well, clear break of asymmetrical triangle, seems like a low risk high reward trade for me.
###NOT FINANCIAL ADVICE###

uni - triangle breakdownafter the breakdown and consolidation above the triangle, you can expect the targets marked on the chart

SasanSeifi| Moving Towards New Targets!Hey there, ✌ As seen in the KUCOIN:UNIUSDT chart, the price has shown a partial rise from the $6 area.
After breaking structure around the $8.50 level, it climbed to $10.
Currently, after a minor pullback, the price has reacted positively from the FVG zone near $8 and is trading around $9.50. The general outlook leans bullish, and it's expected that the price could see significant growth from the $9 range to targets of $12–$14 in the mid-term.
The important support is between $8 and $7.50.
💢 Please remember that this is just my personal viewpoint and should not be taken as investment advice. I’d love to hear your thoughts and share opinions!
Happy trading!✌😎
Sure, if you have any more questions or need further clarification, feel free to ask. I'm here to help!✌

UNIUSDT: BUY AND HOLD FOR 2300% GAIN IN THIS BULL RUNUniswap (UNI), the token powering the popular decentralised exchange protocol, is generating some bullish signals. Let's dive into the technical analysis:
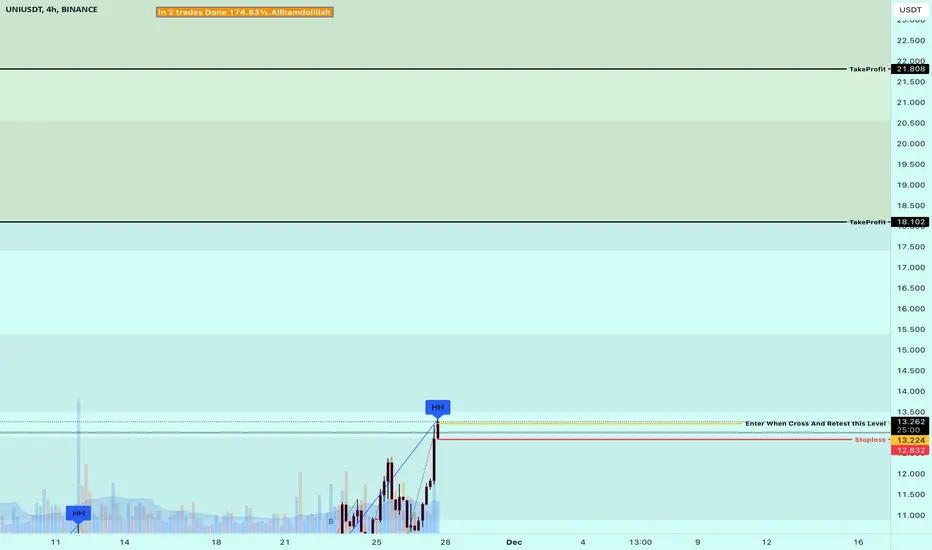
Breakout and Retest:
UNI recently broke out of a long-term ascending triangle pattern, indicating a potential bullish trend.
Currently, UNI is in a retesting phase, which is a healthy sign for the breakout's validity.
Price Target:
The analysis suggests a significant upside potential of around 2300% for UNI post-retest.
Supporting Factors:
Price Above 100 SMA: This is a strong bullish technical indicator, suggesting an uptrend as the current price is trading above the 100-day Simple Moving Average (SMA)
Strong fundamentals for Uniswap as a leading DEX protocol.
Weekly timeframe chart shows a promising rally.
Trading Strategy:
Entry: Consider entry at the current market price (CMP) to around $6.7 with additional accumulation during potential dips within the established channel.
Stop Loss: A weekly close below the channel would indicate a trend reversal, acting as a stop-loss point.
Profit Targets:
Target 1: $23.159
Target 2: $33.879
Target 3: $84.623
Target 4: $168.636
Happy Trading!!
#NFA #DYOR

UNIUSDT Elliott Waves (Local Setup)Hello friends.
Please support my work by clicking the LIKE button👍(If you liked).
Everything on the chart.
Entry zone: market and lower
Target zone: 14 - 15$
after first target reached move ur stop to breakeven
Stop: (depending of ur risk).
ALWAYS follow ur RM
risk is justified
It's not financial advice.
DYOR!

UNISWAP COULD GET A 120% PUMPUniswap is showing very strong momentum in the higher timeframes and if the price could stay above $18 it may send the price to $30 a monthly level and the fibonacci 0.618% from the may high 2021 to the jun lows 2022.

#UNI/USDT#UNI
The price is moving in an ascending channel on the 1-day frame and is sticking to it very well and is about to break higher
We have a bounce from the lower limit of the channel at 6.37
We have an ascending trend on the RSI indicator that is about to break, which supports the rise
We have a trend to stabilize above the 100 moving average
Entry price 7.16
First target 8.90
Second target 10.00
Third target 11.62

Strong Momentum with Bullish PotentialBINANCE:UNIUSDT.P is demonstrating strong positive momentum, with a significant 71% price increase over the past month. Its current price of $13 USDT is approaching its yearly high of $16.3 USDT, indicating robust market performance. Technical indicators support the bullish outlook, as the token has surpassed key support levels at $10 USDT. This creates potential for further gains toward the $15-$20 USDT range if the positive momentum persists.
Fundamental factors, such as Uniswap’s announcement of the Unichain Layer-2 network, bolster this trend, improving transaction efficiency and increasing user confidence in the token's growth prospects.

NEXT ENTRY FOR UNISWAPWe catched UNISWAP from a good place before, -"🟣 UNIUSDT.P | Long-Term Trade
UNIUSDT.P: Long-Term Trade "-
I hope to catch it from a good place again. It's a nice area here, I'll look for buying trades from here.
I don't overcomplicate things and add a ton of dirty crap to my charts, but you can check out the success of my analysis below.
I approach trading with confidence backed by experience and past success in identifying high-probability setups.
While I don’t claim to be the best, my track record speaks for itself, and I strive to let my analysis and results do the talking. Watch these levels closely—markets can confirm what charts already whisper. Let’s see how this plays out together.
My Previous Hits
🐶 DOGEUSDT.P | 4 Reward for 1 Risk (or more if you’re bold).
DOGEUSDT.P: Next Move
🎨 RENDERUSDT.P | HTF Sniper Precision
RENDERUSDT.P: Opportunity of the Month
💎 ETHUSDT.P | Buyer Zone So Accurate You’ll Double Check
ETHUSDT.P: Where to Retrace
🟢 BNBUSDT.P | Buyer Zone Mastery (CZ vibes).
BNBUSDT.P: Potential Surge
📊 Bitcoin Dominance | Called it Like a Pro
BTC Dominance: Reaction Zone
🌊 WAVESUSDT.P | The Blue Box: A Demand Zone with Potential
WAVESUSDT.P: Demand Zone Potential
🟣 UNIUSDT.P | Long-Term Trade
UNIUSDT.P: Long-Term Trade
Now sit back, relax, and watch the market do its thing. Or don’t, FOMO is real. 😉

UNI | UNISWAP Are we in DeFi Summer?
The price of Uniswap is $6.4 today with a 24hour trading volume of 158 million dollar. This represents a 5% price increase in the last 24 hours and a 28% price increase in the past 30 days
but what is UNI and what is UNI SWAP?
UNI is the governance token for Uniswap. UNI was introduced on 16th September 2020 through a retrospective airdrop to users who have interacted with the protocol either by swapping tokens or by providing liquidity.the UNI token allows token holders to participate in the governance of the protocol. Key decisions such as usage of the treasury or future upgrades can be decided through a governance vote.
Uniswap is a decentralized exchange that makes it easy for users to swap an ERC20 token for another ERC20 token without the need of a centralized intermediary. With a DEX, traders do not have to deposit their tokens on an exchange and be exposed to the security risks of a centralized exchange.
UNI's relative strength index of 63 shows bullish momentum is gathering steam but not yet overheated. The moving averages are aligned for more gains as well, with UNI trading above its 10day, 50day and 200day simple moving averages. Overall, the technical posture looks strong
next targets are 6.5, 6.7 and "6.9" $
whats your top defi token?

Uniswap UNI Is One Of The Undervalued Assets - 9x Pump Ahead!Hello, Skyrexians!
Today we will analyze BINANCE:UNIUSDT , one of the strongest assets of this cycle. On the one hand, it's trending coin and price have only touched 0.5 Fibonacci level of the previous bull market. On the other hand, it has not set the lower low on the recent altcoins decrease. All these facts tell us that Uniswap is undervalued cryptocurrency with the high potential gain!
Let's take a look at the weekly time frame. The previous bull run was impulsive and can be considered as the global wave 1. Then price has printed wave 2 in the shape of zigzag ABC. It has been finished in the typical target area at 0.5 Fibonacci retracement.
From this level UNI started new bull run. Wave 1 inside the global wave 3 was impulsive. After that price pulled pack and Bullish/Bearish Reversal Bar Indicator flashed the green dot, the strong long signal. As always, alerts from this indicator are automatically replicated on my accounts. You can find the information in our article on TradingView .
Now we expect the price growth to wave 3 targets at 1.61 or 2.61 Fibonacci levels at $75 and $125, the maximum target is almost 9x from the current price level.
Best regards,
Skyrexio Team
___________________________________________________________
Please, boost this article and subscribe our page if you like analysis!

#UNI: Unlocking Decentralized Exchange GrowthDescription:
This trading idea focuses on UNI, the governance token of Uniswap, one of the most prominent decentralized exchanges (DEXs) in the cryptocurrency market. UNI empowers holders with voting rights for protocol upgrades and fee structures while benefiting from the growth of Uniswap’s ecosystem. With its role in facilitating peer-to-peer token swaps and its position as a market leader in decentralized finance (DeFi), UNI continues to be a cornerstone in the evolution of blockchain-based financial services. The increasing adoption of DeFi protocols and Uniswap’s consistent innovation position UNI as a promising long-term asset.
Despite its potential, it is important to note that cryptocurrency investments, including UNI, are highly volatile and subject to external factors such as regulatory developments and market sentiment shifts. A cautious and well-researched approach is essential for managing risks in this space.
Disclaimer:
This trading idea is for educational purposes only and does not constitute financial advice. Trading cryptocurrencies like UNI involves substantial risk, including the potential for complete loss of capital. Always perform thorough research, evaluate your financial situation, and consult with a financial advisor before making investment decisions. Past performance is not indicative of future results.
Uniswap (UNI) technical analysisUNI loves making harmonic patterns and triangle moves. After each triangle or harmonic pattern ended, price has started an uptrend wave. It is possible that UNI would make another two or three triangles or harmonic patterns before breaking the long-term down trend line and poses for a major uptrend move. These are all valid if the horizontal support area holds in the future as well.

Uniswap Coin (UNI): Possible Touch To 200EMAUniswap coin has had healthy upward momentum since the end of September (after successfully breaking out from branch of EMAs).
While we see this bullish trend here, we also see that 200EMA has been respected all of the time, and when market price moved too far away from EMAs, it tended to come back for a quick re-test.
Right now we have shifted a little far away from EMAs, so this is what we are looking for: a downward movement to re-test the lines!
Swallow Team

UNIUSDT.P | Long Term TradeI will only leave the entries I caught here at $4 and hold them until $40, which means a 1000% chance of gain against a 60% chance of loss. Good luck to everyone.
My Previous Ideas
DOGEUSDT.P | 4 Reward for 1 Risk much more if you hold it.
RENDERUSDT.P | HTF Accuracy
ETHUSDT.P | Accurate Buyer Zone Identification | High Risk Reward if you hold it.
BNBUSDT.P | Accurate Buyer Zone Identification | High Risk Reward if you hold it.
Bitcoin Dominance | Great Characteristic Detection and Accurate Analysis

UNISWAP bullish pattern#uniswap has the same pattern as pancake swap but it made 2 waves sooner so now there is a triangle as wave 2 and now we are in the middle of the wave 3 and also its so reactive to its long term vwap after breaking the supply on the top of vwap its a good time to rise !

Uniswap announces its L2 network — UnichainUniswap, the largest decentralized exchange that has led this segment for 6 years, is launching its own network, Unichain!
🌐 What does Unichain offer? Unichain will operate on the second layer over Ethereum, increasing transaction speed and minimizing losses from MEV attacks. This will allow users to conduct instant transactions, improving trading efficiency and user experience.
🔝 Trading idea with a potential 1:5 🔝
📊 Entry strategy:
Buy zone: 7.5-7.5
📈 Take-Profit targets:
TP1: 10
TP2: 13
TP3: 16
🛑 Stop-Loss: 6.1
Stay up-to-date with new developments, watch the market, and make informed decisions!
