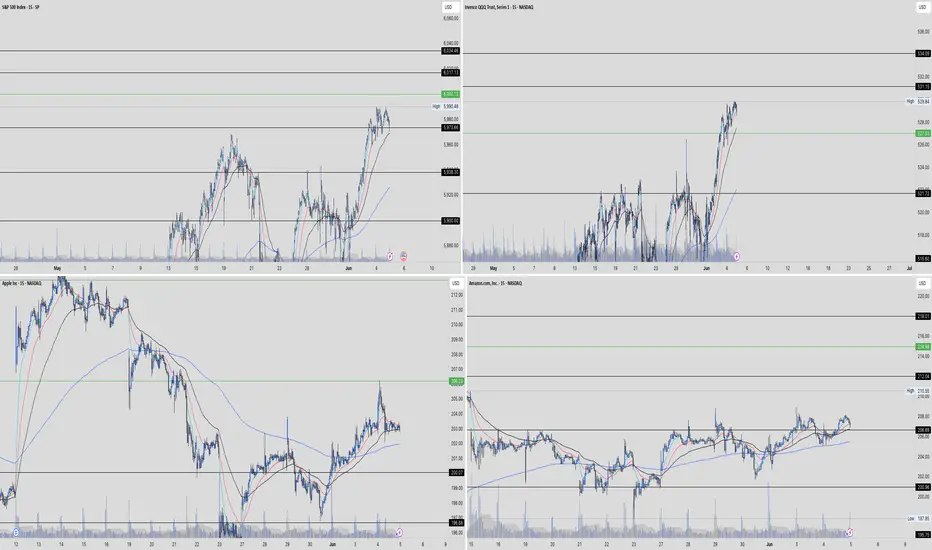
Andycharts, publishing key levels. We have key levels across 15 different charts which I am looking at tomoorow for contination,
US500.F trade ideas
SPX500 — Structural Weakness Emerging on the 15-Min ChartWe may be approaching a critical inflection point.
Price action is showing signs of exhaustion after multiple failed attempts to break higher. The market structure is compressing beneath resistance, setting the stage for a potential breakdown.
🧭 Key Level to Watch:
Support at 5,790.33 aligns with previous liquidity sweeps and demand zones. A move toward this level could reflect rotation from short-term bullish euphoria into a broader correction cycle.
⚠️ Institutional traders, are you watching the same tape?
This isn’t just about price—it’s about positioning.
Market signals:
Distribution pattern forming
Liquidity void below current level
Compression likely to result in expansion (downside bias)
In markets like these, timing is everything.
Capital flows speak louder than sentiment.
#SP500 #MarketStructure #InstitutionalTrading #TechnicalAnalysis #SmartMoney #LiquidityZones #MacroStrategy #WaverVanir #RiskManagement

All-Time Highs (3% Up) or US/China Trade Gap (4-5% Down)?It's summer time (1st week of June)
Brutally slow price action thus far, Non-Farm Payroll hits this Friday
Next week will be more US Inflation Date (CPI, PPI)
S&P and Nasdaq are only 3% (or slightly less) away from all-time highs
Melt-up momentum says it's the path of least resistance
US/China Trade Agreement Gap (that silly little Monday announcement) is 4-5% lower
Whatever we hit, there will be disappointed traders and investors - the ultimate pain trade :)
I'm not bearish, I'm ridiculously cautious as a bull and wanting to see a pullback. I can tell
because it's actually annoying watching the market grind so slow to the upside shrugging
off every bad news bite and sense of reality
The big beautiful tax bill is losing support (see Elon Musk's latest comments)
The Trump Administration has pivoted so hard the other way the market is virtually
ignoring tariff news now
Let price be your guide. I'm connecting the April 7 lows forward and if the bears cross it and price sweeps some lows, there might be some pullback potential in the cards
Plenty to watch - be patient - opportunities await. Not forcing anything for now and I'm
doing the "boring" stuff for income trading.
Thanks for watching!!!

The close - no bells ring at a topMy feeling right now is one of deja vu. Like the bottom before the president delayed tariffs, there was no volume and my assumption was we would go a bit lower. Here we have no volume and my assumption has been we will go a bit higher. Could we top here? It's possible. The bear divergences are pointing to a move down at least temporarily.

S&P500: Gearing up for a push to 6,100S&P500 is bullish on its 1D technical outlook (RSI = 64.611, MACD = 85.830, ADX = 19.630) as it has been trading inside a Channel Up for over a month. Right now it is halfway through the new bullish wave. We expect it to rise by at least +4.40%, same as the previous one. Stay bullish as long as the 4H MA50 holds, TP = 6,100.
## If you like our free content follow our profile to get more daily ideas. ##
## Comments and likes are greatly appreciated. ##

SP500 would you capture or just let it slip?His palms are sweaty
Knees weak, arms spaghetti
His nervous
But on the surface
He looks calm and ready

Acorn's Smart Money S&P SignalJune 3, 2025 - After another successful S&P signal in May, we have another Bullish signal for the first part of June. If correct, the bullish S&P indicator suggests the S&P will close above 5861.43 on June 19.

S&P 500 is Under Pressure from Weak ADP Data, Strong ResistanceThe S&P 500 is showing signs of contraction just below the key 6000 level. The ADP employment report, which revealed the slowest pace of hiring since March 2023, has raised some concern among investors. Whether this weak labor data will significantly impact the broader stock market remains to be seen.
Tariff effects appear to be gradually surfacing, first in jobless claims, then in the ISM manufacturing data, and now in the ADP report. Inflation data will likely be affected last, probably in a few months, due to the fact that both households and businesses frontloaded purchases ahead of the tariffs. As a result, the market could first confront recession fears, followed later by concerns about stagflation.
From a technical standpoint, a short-term RSI divergence is emerging, and the 6000 level is acting as strong resistance. If the S&P 500 fails to break above this resistance, a selloff could be triggered, with the 200-hour moving average as the initial target. Should the index fall below the 200-hour level, bearish momentum could increase, potentially deepening the correction.
To invalidate this negative scenario, the index would need a clear breakout above 6000, confirmed by multiple daily closes above that level.

Balance could break todaySPX may go higher but it could be a false break according to the RSI. Gold looks like it will go higher. USOIL is retreating from resistance so far. BTC still looks like it will drop.

US500 Bullish Outlook US500 Bullish Outlook
US500 is well-positioned for another upward wave.
The price is forming a bullish triangle pattern, suggesting further gains if it breaks above the pattern or surpasses 5990.
Key upside targets are 6100 and 6240.
Investors are closely watching any new trade deal. If Trump rejects any deal or issues threats, the US500 could temporarily fall to 5930 before resuming its rise.
So far, the overall trend remains bullish, with no signs of reversal as long as key levels hold.
You may find more details in the chart!
Thank you and Good Luck!
❤️PS: Please support with a like or comment if you find this analysis useful for your trading day❤️

S&P 500 is going in a ranging mode5704 is a historical key level, now we are slightly above it; for serious buyers we have to wait until the news; we will watch a retracement in this zone then we can take our position long

SPX Key Levels to Watch Jun 4 In today’s analysis of the S&P 500 (SPX), we’ll break down the crucial levels to watch as we head into June 4th. After perfectly testing the 5929 level yesterday, the market bounced back, setting the stage for potential moves. We’ll discuss the new support range between 5954 and 5967 and what it means for traders. If this range holds, we might see a rally towards 6165, but if it falters, a drop to 5850 could be on the horizon. These levels are highly actionable, so stay sharp and ready to react!

Something Brewing on SPXCup and handle brewing on the SPX daily. All time highs are near. See you there before the pullback

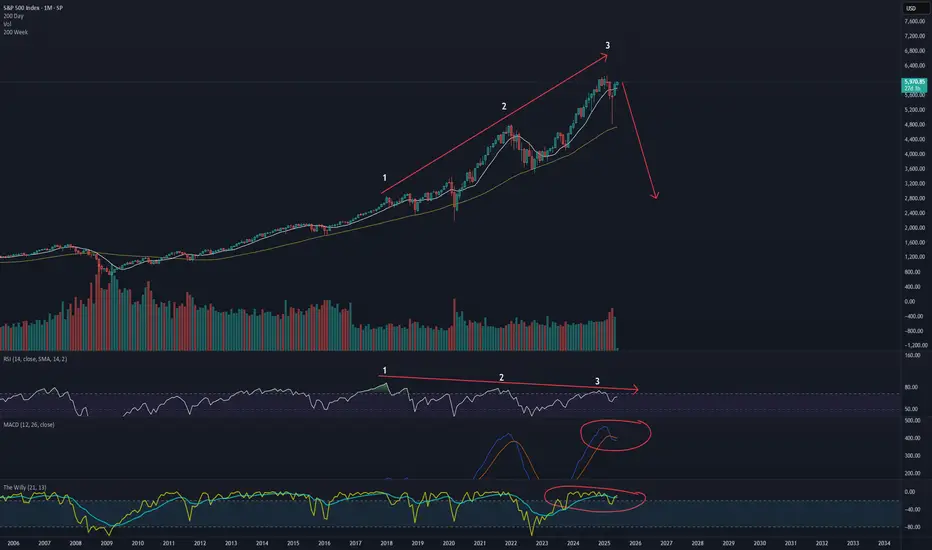
3 drives of bearish monthly divergence = bear market incoming"A bull market is like sex, it feels best just before it ends"
would like to draw attention to the bubble stocks and crypto right now, providing a definitive definition of mania.
The argument for a lost decade is in order.
The first decline in the spx will be aprox 55% to 2800, likely to recover its highs similar to how the market traded in the 1970's
Balance areas abound - SPX GOLD USOIL BTCBias still up on the markets with the target likely being the upper daily BB. Gold target reached and now taking a breather. USOIL may break up sooner than later. BTC looks like more downside is likely.

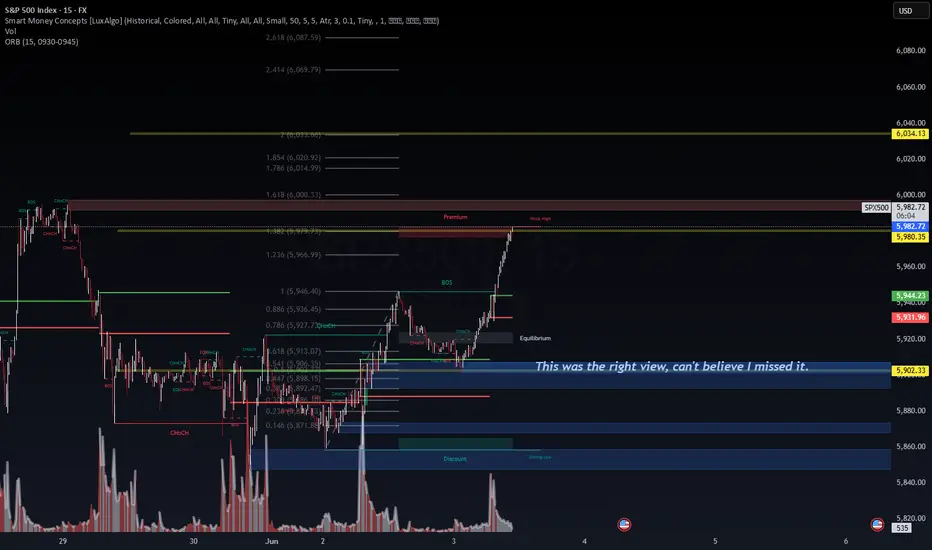
Updated Technical Analysis – SPX500 (15M)Published: June 3, 2025 @ 10:22 PST
🔍 Observations:
🔺 Price Context:
Currently trading at 5,982, right inside the premium + weak high zone
1.382 Fib extension = 5,979.73 has just been tagged
Next Fib levels:
1.618 = 6,000.33
2.0 = 6,034.13 (also long-term resistance target)
🧠 SMC & Liquidity:
BOS confirmed around 5,927
Multiple ChoCHs now invalidated = strength in the up move
Weak high at 5,980 likely acted as a liquidity magnet → now filled
📉 Risk Alert:
Low volume on the final leg up = signs of exhaustion
Price is now above key liquidity zones — perfect for a fake-out or reversal
🔁 Updated Probabilities (Intraday Outlook)
Direction Probability Reason
Bearish Reversal (today) 65% Liquidity sweep + premium zone rejection + volume divergence
Bullish Continuation (toward 6,034) 35% Momentum intact, if breakout holds and is supported by volume spike
🧠 Analyst Note:
"This was the right view, can’t believe I missed it."
— This quote fits perfectly here. The 5,902 zone (equilibrium) acted exactly as intended: a launchpad. Missing the move isn’t the problem — it’s not learning from it that is.
SPX500SPX500: Bullish Momentum Builds – 6500 in Sight?
📍 Current Price: 5977.00
📈 Bias: Strongly Bullish
🎯 Target: 6500+
📉 Invalidation Level: 5850 (Short-term support)
📊 Technical Outlook:
The SPX500 continues to show strong bullish momentum as it trades at all-time highs near 5977.00. With persistent buying pressure and supportive macro tailwinds, the index looks poised for further upside.
Key observations:
✅ Price Action: Clean breakout and consolidation above recent highs. No signs of exhaustion yet.
📈 Trend: Clearly up across all major timeframes (Daily, 4H, 1H).
🧠 Psychological Level: 6000 is within reach, and a break above could open the path toward 6500 as the next major round number and Fibonacci extension level.
💡 Market Sentiment: Risk-on tone prevails; tech and mega caps continue to lead.
🔍 Support & Resistance Levels:
Resistance: 6000 → 6150 → 6500
Support: 5900 → 5850 → 5735
⚠️ Risk Management:
While the setup remains bullish, traders should watch for:
Surprise macro headlines (Fed speeches, inflation data, geopolitical risks)
Pullbacks toward support for potential re-entries
📝 Conclusion:
SPX500 remains in a powerful uptrend. As long as price holds above key short-term support at 5850, bulls retain full control. A breakout above 6000 could trigger a fresh wave of institutional buying, driving price toward 6500 in the coming weeks.
📢 Let me know your thoughts — are we heading for 6500 next?
👍 Like & follow for more real-time market insights!

SPX500 Macro + Technical + Probabilistic AnalysisPublished: June 3, 2025
🔍 Chart Breakdown (Daily | LuxAlgo + EW + SMC)
Structure Summary:
🔶 Wave Count: Completing Wave (5), with price nearing exhaustion
🔴 Weak High Zone: ~6,100–6,200 = liquidity magnet
🟥 Premium Zone: Between current price and 6,426
🟦 Equilibrium Zone: ~4,950–5,150
🟩 Discount Zone: ~4,150 = long re-entry or cycle bottom if correction occurs
📅 Key Timing Line: June 17, 2025 = potential reversal date (time-based confluence)
Volume Analysis:
🔊 Volume spikes at Wave 2 and Wave 4 suggest reactive participation
📉 Lower volume into recent highs suggests distribution, not accumulation
🔁 Multi-Timeframe Outlook
Timeframe Direction Probability Rationale
Intraday (15M) Bearish 60% Weak high rejection, premium zone swept, liquidity-based reversal
Swing (2–3 weeks) Bullish → Bearish 70% to 6,420 → then reversal Wave 5 completion into supply zone, followed by corrective ABC
Macro (Q3–Q4 2025) Bearish 80% Likely mean reversion toward equilibrium (5,000) or discount (4,200)
📊 Key Price Zones to Watch
Level Label Strategy
6,426 🎯 Wave 5 Target Look for exhaustion, divergence, or liquidity sweep
6,150–6,200 🟥 Weak High / Premium Possible fake-out zone or reversal trigger
5,900 🔵 Short-term support Likely retest zone on first rejection
5,150–4,950 ⚖️ Equilibrium Mid-cycle mean reversion target
4,150 🟩 Discount/Strong Low Long reload zone if correction deepens
⚠️ Risk Considerations
Macro Data Watchlist: June 12 CPI + June 17 FOMC = macro catalysts for Wave 5 peak
Invalidation: If price holds above 6,450 after June 17, EW count must be adjusted
Alternative Count: Parabolic Wave 5 extensions can overshoot — be cautious shorting early

S&P 500 4 Hr. chart Impulsing towards 61251). Huge Volume! 2). Banks are Buying! 3). Breaking trendline on wave 3!

Bulls and Bears zone for 06-03-2025SPX has been trading in a range since mid May. Perhaps a pullback might be in the cards.
Level to watch: 5946 --- 5948
News to Watch:
US Factory Orders 10:00am
US JOLTS 10:00am

S&P500 Giant Inverse Head and Shoulders waiting for its breakoutThe S&P500 index (SPX) appears to be forming the Right Shoulder of a long-term Inverse Head and Shoulders (IH&S), the pattern that made the April 07 bottom of the Tariff War correction.
Currently supported by both its 1D MA50 (blue trend-line) and 1D MA200 (orange trend-line), once the overhead Resistance/ neckline breaks, we expect a +24.55% rise to the 2.0 Fibonacci extension, the equivalent of the rise it made from the April bottom up until now.
The target given is 7400.
-------------------------------------------------------------------------------
** Please LIKE 👍, FOLLOW ✅, SHARE 🙌 and COMMENT ✍ if you enjoy this idea! Also share your ideas and charts in the comments section below! This is best way to keep it relevant, support us, keep the content here free and allow the idea to reach as many people as possible. **
-------------------------------------------------------------------------------
Disclosure: I am part of Trade Nation's Influencer program and receive a monthly fee for using their TradingView charts in my analysis.
💸💸💸💸💸💸
👇 👇 👇 👇 👇 👇

SPX500 Rejection Confirmed – Bearish Setup UnfoldingThe S&P 500 has just rejected a strong supply zone around the 5,915–6,006 region, a level that previously acted as resistance in March. Price is showing early signs of weakness as sellers defend this area aggressively.
📌 Key Technical Levels:
🔵 Supply Zone (Resistance): 5,915–6,006
🔵 Next Support #1: 5,436 – Expect reaction or bounce here
🟠 Demand Zone (Major Support): 4,908 – Confluence with volume profile and previous swing lows
🔴 Price Action Insights:
Strong bearish reaction at the upper supply zone ✔️
Double rejection around 6,000 with a drop in bullish momentum 📉
Candlestick structure forming lower highs — early reversal signals
Red arrows indicate potential path if sellers maintain control
🧠 What I'm Watching:
🔽 If we break below 5,436 with volume, the next bearish target is 4,908
🔁 If bulls reclaim and close above 6,006, the bearish thesis is invalidated
🗓️ Keep in mind upcoming U.S. news events (NFP, CPI, FOMC) – shown on the chart – could fuel volatility and impact momentum.
---
💬 What’s your take? Are you shorting the SPX500 or waiting for confirmation?
📈 Drop your thoughts in the comments! Let’s trade smart.
#SPX500 #S&P500 #SupplyAndDemand #PriceAction #SmartMoney #TechnicalAnalysis #BearishSetup #TradingView #SP500Analysis #StockMarket

That's for My American FriendsGuys there's a LQ in there downside if you don't want to miss so you can enter but make sure your SL is large, but i suggest you wait for LQ taken, i know it's take time but Patiance Pays.. See You
