That's for My American FriendsGuys there's a LQ in there downside if you don't want to miss so you can enter but make sure your SL is large, but i suggest you wait for LQ taken, i know it's take time but Patiance Pays.. See You
US500.F trade ideas

SPX500 H1 | Potential bullish bounceSPX500 is falling towards a pullback support and could potentially bounce off this level to climb higher.
Buy entry is at 5,907.26 which is a pullback support that aligns with the 38.2% Fibonacci retracement.
Stop loss is at 5,838.00 which is a level that lies underneath a multi-swing-low support and the 61.8% Fibonacci retracement.
Take profit is at 5,995.10 which is a swing-high resistance that aligns with the 61.8% Fibonacci retracement.
High Risk Investment Warning
Trading Forex/CFDs on margin carries a high level of risk and may not be suitable for all investors. Leverage can work against you.
Stratos Markets Limited (tradu.com ):
CFDs are complex instruments and come with a high risk of losing money rapidly due to leverage. 63% of retail investor accounts lose money when trading CFDs with this provider. You should consider whether you understand how CFDs work and whether you can afford to take the high risk of losing your money.
Stratos Europe Ltd (tradu.com ):
CFDs are complex instruments and come with a high risk of losing money rapidly due to leverage. 63% of retail investor accounts lose money when trading CFDs with this provider. You should consider whether you understand how CFDs work and whether you can afford to take the high risk of losing your money.
Stratos Global LLC (tradu.com ):
Losses can exceed deposits.
Please be advised that the information presented on TradingView is provided to Tradu (‘Company’, ‘we’) by a third-party provider (‘TFA Global Pte Ltd’). Please be reminded that you are solely responsible for the trading decisions on your account. There is a very high degree of risk involved in trading. Any information and/or content is intended entirely for research, educational and informational purposes only and does not constitute investment or consultation advice or investment strategy. The information is not tailored to the investment needs of any specific person and therefore does not involve a consideration of any of the investment objectives, financial situation or needs of any viewer that may receive it. Kindly also note that past performance is not a reliable indicator of future results. Actual results may differ materially from those anticipated in forward-looking or past performance statements. We assume no liability as to the accuracy or completeness of any of the information and/or content provided herein and the Company cannot be held responsible for any omission, mistake nor for any loss or damage including without limitation to any loss of profit which may arise from reliance on any information supplied by TFA Global Pte Ltd.
The speaker(s) is neither an employee, agent nor representative of Tradu and is therefore acting independently. The opinions given are their own, constitute general market commentary, and do not constitute the opinion or advice of Tradu or any form of personal or investment advice. Tradu neither endorses nor guarantees offerings of third-party speakers, nor is Tradu responsible for the content, veracity or opinions of third-party speakers, presenters or participants.

S&P turns flat after bouncing off lows
The S&P 500, which ended Friday's session flat, has turned flat in today's session as well, after bouncing back from its earlier lows on reports that the US and Chinese leaders will meet to discuss trade after the two sides accused each other of violating their recent trade deal.
June could be a more challenging month for stocks if trade uncertainty persists, following what had been a strong May for global equities—marking their best monthly performance since November 2023. Much of that rally was driven by optimism that the worst of the US tariff threats had passed, encouraging investors to return to risk assets. However, any sense of calm was quickly disrupted after in the last few days, when Trump announced plans to double tariffs on steel and aluminum from 25% to 50%. This move has reignited concerns about a potential resurgence of trade tensions, adding to the already growing list of market risks. On top of that, investors are also bracing for political gridlock in Washington, as lawmakers prepare to negotiate a sweeping tax and spending bill amid escalating concerns about US government debt. With the debt ceiling deadline approaching, June could bring renewed market volatility, casting a cloud over the near-term S&P 500 outlook.
From a technical point of view, the trend is bullish but the doji candles in the last few trading sessions suggest that the momentum is waning and that a bit of a pullback could be on the cards.
Resistance at 5,900 was being tested at the time of writing. A daily close above this level would be a bullish outcome, in which case a run towards last week's high near 6,000 could be on the cards.
However, if resistance at 5,900 holds, then a potential drop to the next support area around 5787 would be the more likely outcome first. Further support is seen between 5,670 to 5,695.
By Fawad Razaqzada, market analyst with FOREX.com

S&P INTRADAY corrective pullback - pivotal zoneMacro & FX Outlook
Morgan Stanley forecasts a 9% decline in the US dollar by mid-2026, driven by a slowing US economy and expected Fed rate cuts.
Trading implication: Long positions in EUR, GBP, and other G10 currencies may benefit as USD weakens. Watch for renewed momentum in carry trades and emerging market FX.
Geopolitics
Ukraine-Russia conflict escalates with Ukrainian drone strikes hitting deep into Russia (including Siberia) and Moscow launching one of its most sustained aerial attacks.
Peace talks are expected in Turkey today.
Trading implication: Elevated geopolitical risk could support safe havens (gold, CHF, USD short-term) and oil prices, depending on energy infrastructure vulnerability.
UK Defense Spending
The UK will allocate £15 billion to expand its nuclear warhead program, new attack submarines, and build munitions factories.
Trading implication: Likely to support defense sector stocks and raise questions around fiscal policy ahead of elections; may contribute to upward pressure on gilts if deficits widen.
Poland Political Shift
Nationalist Karol Nawrocki wins presidential election, a setback for Poland’s pro-EU coalition government.
Trading implication: Potential increase in EU policy friction. May weigh on Polish assets and zloty (PLN) in the short term.
US Debt Ceiling & Diplomacy
Treasury Secretary Scott Bessent assured markets the US will not default but gave no timeline on cash exhaustion.
Also noted a Trump–Xi call is imminent, aiming to ease US-China tensions.
Trading implication: Uncertainty over Treasury liquidity may raise short-term bill yields. Any improvement in US-China relations could lift global risk sentiment and Chinese equities.
Key Support and Resistance Levels
Resistance Level 1: 6010
Resistance Level 2: 6070
Resistance Level 3: 6160
Support Level 1: 5780
Support Level 2: 5740
Support Level 3: 5700
This communication is for informational purposes only and should not be viewed as any form of recommendation as to a particular course of action or as investment advice. It is not intended as an offer or solicitation for the purchase or sale of any financial instrument or as an official confirmation of any transaction. Opinions, estimates and assumptions expressed herein are made as of the date of this communication and are subject to change without notice. This communication has been prepared based upon information, including market prices, data and other information, believed to be reliable; however, Trade Nation does not warrant its completeness or accuracy. All market prices and market data contained in or attached to this communication are indicative and subject to change without notice.

S&P 500"The S&P 500 is showing a bullish trend on the monthly chart, which means as we enter a new month (June), we're looking for a healthy pullback to position for long entries. Fingers crossed!"
Are we trading the market or trading our own opinion?It was said that 99% of the traders out there failed to make profits.
I pondered hard over this statement and realised that whatever tools I am using, it is equally available to the millions of traders out there. The same for the financial information which I read on CNBC, SCMP, etc. Nothing that I have is one level above others.
Then, when I look at the charts, for a long time, I have also convinced myself of buying at support and selling at resistance and gaps get filled up. From this chart, we can see that 3x the support failed with the last one breaking past the support line before staging a rebound.
Just because it has worked in the past, it does not mean it will again. 19 Feb to 7 Apr 2025, this must be the shortest bear market in history. Could we witness more of such rise and fall in the coming future?
Most would hesitate to go LONG now for one of these reasons :
1) it is reaching the resistance level soon and likely profit taking so price may retrace. Let's wait.
2) Donald Trump and team is getting sued on the tariff matters , volatility is expected in the market so price may move sideways for a while
3) The US market is overvalued per many analysts out there, PE over 28 or 30 and the fall is going to be great like 40-50% downfall. Wait some more or taking partial profits
4) My friends are making good money from cryptocurrency and the profits are huge, I should ditch SPX and followed him
The list could goes on.........
I am still LONG on the SPX and is now awaiting for opportunities to accumulate. What is stopping me is the gap and resistance which I am afraid of. In my mind, I am thinking it is better to get it cheaper , right ?
Guess I am looking for a catalyst or better reasons to convince me to go LONG.............
Like to hear some others views

Falling towards pullback support?S&P500 is falling towards the support level which is a pullback support that aligns with the 38.2% Fibonacci retracement and could bounce from this level to our take profit.
Entry: 5,780.17
Why we like it:
There is a pullback support level that lines up with the 38.2% Fibonacci retracement.
Stop loss: 5,689.40
Why we like it:
There is a pullback support level that is slightly below the 50% Fibonacci retracement.
Take profit: 5,973.58
Why we like it:
There is a pullback resistance level.
Enjoying your TradingView experience? Review us!
Please be advised that the information presented on TradingView is provided to Vantage (‘Vantage Global Limited’, ‘we’) by a third-party provider (‘Everest Fortune Group’). Please be reminded that you are solely responsible for the trading decisions on your account. There is a very high degree of risk involved in trading. Any information and/or content is intended entirely for research, educational and informational purposes only and does not constitute investment or consultation advice or investment strategy. The information is not tailored to the investment needs of any specific person and therefore does not involve a consideration of any of the investment objectives, financial situation or needs of any viewer that may receive it. Kindly also note that past performance is not a reliable indicator of future results. Actual results may differ materially from those anticipated in forward-looking or past performance statements. We assume no liability as to the accuracy or completeness of any of the information and/or content provided herein and the Company cannot be held responsible for any omission, mistake nor for any loss or damage including without limitation to any loss of profit which may arise from reliance on any information supplied by Everest Fortune Group.

SPXSPX Cup and handle on the chart. Would like to see this pan out would put SPX back to test the ATHs and possible breakout into 6300 area.

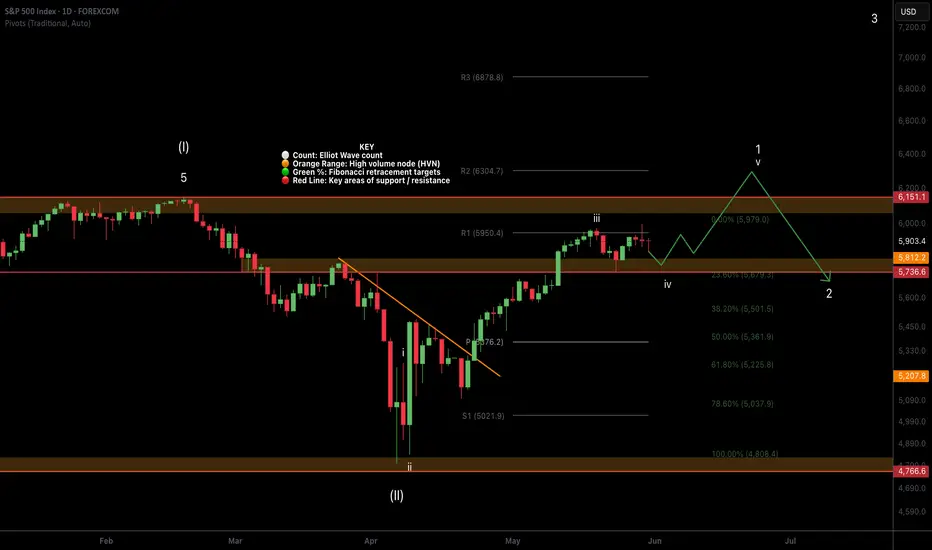
SPX500 (Daily) Elliot wave 4 underwaySPX appears to be printing a wave 4, potentially a triangle giving the proximity to the all the time high. Triangles are a motif wave ending pattern with a thrust up afterwards, typically a poke above the previous all time high before retracing trapping retail with FOMO.
Wave 2 is expected to retrace to the bottom of the triangle / wave 4 currently the high volume node support and .236 Fibonacci retracement at $5680
Safe trading
S&P 6700 or 5100 What's Coming Next?Daily 200 EMA Close
Weekly 100 EMA Retested and pullback in W pattern
Inverted head and shoulder breach on 6000 Upsides till 6700
36 trillion Ticking Debt by USA Downside till 5100
Wait till FED data, job employment and payroll data

SPX: tariffs weekly tweet updateThe US Administration trade tariffs continue to bring confusion among market participants, but despite this, the S&P 500 managed to end May with a gain of 6,2%. The tariff-weekly-news included the announcement of the US President on social media that China “violated” current tariffs agreement. Although there were no further explanations, Bloomberg published information from an uncited source, that the US is planning to bring tariffs to China tech sector. At the same time, there was no official confirmation from the US Administration. The European Union is considering countermeasures on the US, after the announcement of the US Administration on an increase of tariffs on steel from 25% to 50%. All these ping-pong tariffs measures from the last period are causing some investors to slowly lose temper, with comments like “If you are an investor, you want to bet on good earnings, not good tweets about tariffs”, as Jay Hatfild from Infrastructure Capital Management told to CNBC. This brings some confidence that the markets will not make stronger moves on tweets, but only to actual moves of the US Administration in the coming period. Trading during May might provide some confidence also for the future period.
In line with investors, the University of Michigan Consumer Sentiment showed some relaxation with the final May data. The indicator ended the month at the level of 52,2 a bit better from estimated 51. The most important are inflation expectations which also eased a bit from previous release, in which sense five year inflation expectations are currently at 4,2%, and below market estimate of 4,6%.
The market confusion will most certainly continue also during June, but it seems at the lower volatility levels. More attention will be turned to macro data, and company earnings. The first trading week in June is bringing US jobs data, including the Non-farm payrolls, which might bring back some volatility on US equity markets.

SPX500 (S&P 500 Index) – Smart Money + Fibonacci Liquidity Sweep📅 Chart Timestamp: May 31, 2025 – 4H Timeframe
📈 Current Price: 5,902.26
📊 Volume (Recent Candle): 64.95K
🧠 Technical Breakdown
🔺 Premium Zone Rejection
Price has sharply rejected the 5,995–6,050 area — a key premium supply zone aligned with the Fibonacci 1.0–1.236 extension.
This rejection occurred after a weak internal high was formed, showing signs of exhaustion and liquidity grab behavior.
📉 Market Structure
Multiple Break of Structure (BOS) and Change of Character (CHoCH) confirm a short-term bearish market structure.
Price has begun forming lower highs and is now in a distribution phase.
📏 Key Fibonacci & Smart Money Levels
0.786 Fib Retracement (5,804) → Recently tested; acted as a short-term support but broken.
Equilibrium Zone (5,443.75) → Critical price magnet. Price is projected to gravitate toward this zone as part of a liquidity sweep and reaccumulation.
Discount Zone (below 5,300) → Stronger support if equilibrium fails. Could serve as a long-term buying opportunity.
🌀 Expected Price Path (Yellow Projection)
Short-term downside continuation into 5,560–5,440.
Likely to form a double-bottom or mitigation structure at equilibrium.
Reversal potential targeting 6,200–6,300 (1.236–1.382 extension) before next macro correction.
📈 Probability Framework
Scenario Description Probability Rationale
📉 Pullback to Equilibrium Price revisits 5,443.75 75% Confluence of Smart Money FVGs + Fib levels + BOS indicates liquidity resting below
🔁 Reaccumulation at EQ Reversal from 5,440–5,500 65% Price often reacts to equilibrium in a bullish uptrend continuation
📈 Rally to 6,200+ Price takes out weak highs and extends 50% Depends on macro sentiment improving + liquidity expansion
🧨 Break below EQ into Discount Price collapses toward 5,300 30% Only if macro deterioration accelerates (Fed surprise, global contagion)
🧠 Macro Risk & Fundamental Context (as of May 31, 2025)
🏦 Federal Reserve
Market is pricing in no rate cut in June, but increased odds (65–70%) of a cut in July.
Sticky inflation + slowing job growth creates an uncertain macro narrative.
💵 Liquidity & Risk Sentiment
Bond market volatility (MOVE Index) remains elevated → signaling stress in interest rate pricing.
VIX is stable near 12–14 range → complacency risk if volatility spikes.
Global liquidity has tightened in EMs due to dollar strength, though US equities remain buoyed by AI & tech.
📉 Earnings + Breadth
Earnings season was mixed; top-heavy performance (few stocks driving index).
Weak market breadth suggests a correction is healthy or overdue.
⚠️ Risk Factors to Monitor
Surprise Fed policy pivot (hawkish).
Geopolitical escalations (Middle East, Taiwan).
Sudden rise in VIX or credit spreads.
Bearish divergence between index and market breadth indicators.

SPX500USD still going upHi traders,
How accurate do you want an outlook to be? Last week I said price rejected from the Daily BPR so we could see this pair go up again to the higher Daily FVG. And that's exactly what happened.
And after price swept the liquidity to the left, it made a correction into the 4H FVG.
So next week we could see the continuation of the upmove.
Let's see what the market does and react.
Trade idea: Wait for a bullish change in orderflow and a small correction down on a lower timeframe to trade longs.
If you want to learn more about trading FVG's & liquidity sweeps with Wave analysis, then please make sure to follow me.
This shared post is only my point of view on what could be the next move in this pair based on my technical analysis.
Don't be emotional, just trade your plan!
Eduwave

S&P 500 Index -- Weekly Volatility Potential Good Afternoon!
This week, I want to talk about the CBOE:SPX and its weekly potential for how I read historical volatility to weight it then to implied volatility -- this creates my custom trading ranges.
Implied ranges for this week are calculated at 4 DTE using my strength of IV method. You can find out more how I do this over at my highlights page on 'X' - Find me @askHVtobidIV
We are entering a short week, with IV currently in the 89th percentile for the year ( 18.31% ) and resonating between bi-weekly ( 19.36% ) and monthly ( 15.13% ) historical values. Quarterly volatility trends ( 31.79% ) have risen more than 10% this year alone due to macro concerns and increased news from tariff uncertainties. This is creating a volatile environment that, in turn, only increases our trading ranges. Something I personally like.
Near-term trends are above the currently high IV environment, suggesting further expansion. This provides premium value on what is happening to what is projected to happen and a “strength of IV” of >100% indicating rising volatility, slowly towards quarterly means, while resonating around monthly trends.
If price action drives downwards, our gap from May 16th could fill around $5,692.56 with confluence of HV21 trends at $5,710.91.
Conversely, I can see HV10 ranges with rising pricing action and good macro news with EU tariffs breaking $5,971.33—Expanding to the price of $5,995.95 with continuing expansion and regression towards means.
Come back next weekend as I will review the chart to see how we developed!
For those interested in volatility analysis and the application of weighted HV ranges to IV, I encourage you to BOOST and share this post, leave a comment, or follow me to join me on this journey.

S&P 500 Daily Chart Analysis For Week of May 30, 2025Technical Analysis and Outlook:
The S&P 500 Index has undergone considerable price fluctuations during the trading sessions of this week, successfully reaching a critical target at the Mean Support level of 5800. Presently, the index is exhibiting an upward trend with a focus on the retest of the Inner Index Dip at 5955 and Key Resistance at 5965. Furthermore, additional significant levels have been identified, including the Next#1 Outer Index Rally at 6073, Key Resistance at 6150, and the Next#2 Outer Index Rally at 6235. Conversely, there is a potential for the index prices to downfall aiming to retest Mean Support 5800 and to complete the Outer Index Dip, noted at 5730.

June is expected to be bllodbathHistorical trends suggest that June tends to be a weaker month for U.S. equities, with the S&P 500 averaging a modest gain of just 0.1% over the past 20 years, according to CFRA Research. Seasonal factors, including lower trading volumes and investor caution ahead of mid-year earnings, often contribute to subdued performance.
Despite May’s gains, analysts warn of a potential pullback in June. Market sentiment remains fragile amid lingering Fed rate uncertainty and geopolitical risks. The CBOE Volatility Index (VIX) has ticked higher, signaling growing caution (MarketWatch).
The potential return of Trump-era trade policies—including aggressive tariffs—has injected uncertainty into markets. Investors fear renewed trade wars could disrupt supply chains and inflate costs, weighing on corporate profits
In conclusion, while May delivered a bullish surprise, investors should brace for increased volatility in June. Historical trends, coupled with overbought conditions, suggest a correction may be on the horizon.
Expect a major pullback to test previous lows of ~5000

SPX500 – Fibonacci Breakdown Hints Deeper Correction AheadThis 1H SPX500 setup highlights a potential bearish continuation pattern following a clear rejection from the 0.618–0.786 Fibonacci retracement zone. Here's a breakdown of the trade thesis:
🔍 Analysis Summary:
Fibonacci Cluster Rejection: Price failed to reclaim 5,921.31 (key resistance) and sharply rejected from the 0.618–0.786 retracement zone.
Bearish Market Structure: Lower highs formed near the .618 Fib, followed by a strong impulsive sell-off.
Liquidity Zone Below: The price is targeting the previous demand block near 5,796.99, a major structural liquidity zone.
Measured Targets (Fibonacci Extensions):
TP1: 1.236 @ 5,844.09
TP2: 1.618 @ 5,796.99
TP3: 2.0 @ 5,749.35
📌 Trade Setup:
Short Entry Zone: 5,915 – 5,921 (retest of resistance)
Stop Loss: Above swing high at 5,932
Take Profits:
TP1: 5,844 (partial close)
TP2: 5,796.99 (main target)
TP3: 5,749 (optional extension)
🧠 Macro Consideration:
With Fed rate uncertainty and bond market fragility, equities may be vulnerable to deeper retracement as institutions de-risk.
Volatility remains elevated heading into month-end—be flexible and risk-aware.
📊 Evidence Supporting the Hypothesis
Resistance at 0.618 Fibonacci Level:
The SPX has approached the 0.618 Fibonacci retracement level, a critical resistance point. A failure to break above this level could indicate a potential reversal or continuation of the downtrend.
Historical Significance of 0.618 Level:
Breaking below the 0.618 Fibonacci support level often signals a continuation of the downtrend, as it is a significant retracement level in technical analysis.
Stalling at Key Fibonacci Target:
The S&P 500's recent rally has stalled near a critical Fibonacci retracement level, raising questions about whether the market is entering a new uptrend or merely experiencing a bear-market bounce.
📉 Implications for Traders
Bearish Continuation: The inability of the SPX to surpass the 0.618–0.786 retracement zone suggests that the recent rally might be a temporary correction within a broader downtrend.
Potential Targets: If the bearish trend resumes, traders might look for support levels at the 1.236, 1.618, and 2.0 Fibonacci extension levels, aligning with the previously mentioned targets of 5,844.09, 5,796.99, and 5,749.35, respectively.
Risk Management: Given the current market volatility and the significance of these Fibonacci levels, traders should employ strict risk management strategies, including setting stop-loss orders above recent swing highs and monitoring for confirmation signals before entering positions.
In summary, the SPX's struggle to break through the 0.618–0.786 Fibonacci retracement levels, combined with historical patterns and recent technical analyses, supports the hypothesis of a potential bearish continuation. Traders should remain cautious and consider these technical indicators when making trading decisions.
📊 Wavervanir International LLC | Discretionary + Quant Hybrid Risk Management

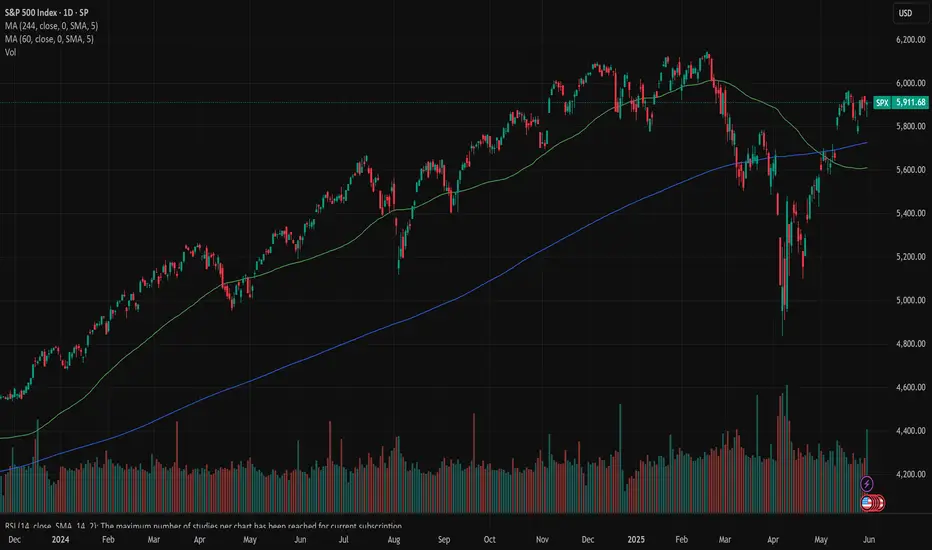
SPX week & month review 5/30/25Intrigued by today as we closed the month and week. The charts appear bullish until something changes that. Key points I noticed...
*Monthly morning star pattern
*RSI above 50 on month and week chart
*MACD over zero line and signal up on month and week chart
*Key levels holding up (21 ema, FVGs)
We are still in volatile times and narratives are being thrown all over the place. Do you see what I see? Enjoy your weekend.

S&P500 finishing re-accumulation and sets eyes on 6230.The S&P500 / SPX has turned sideways after an impressive recovery from April's lows.
The 1day MA50 provides the same kind of support as it did after the October 2023 rebound.
The RSI pattern on both sequences is also similar and it suggests that the price is at the point where it breaks upwards to the Rising Resistance.
Target 6230.
Follow us, like the idea and leave a comment below!!

Bull trap into the close?Daily Bias is still up, but if we end the day near 5940, it may be a C wave with a further move down into next week. I also look at Gold, USOIL, and BTC

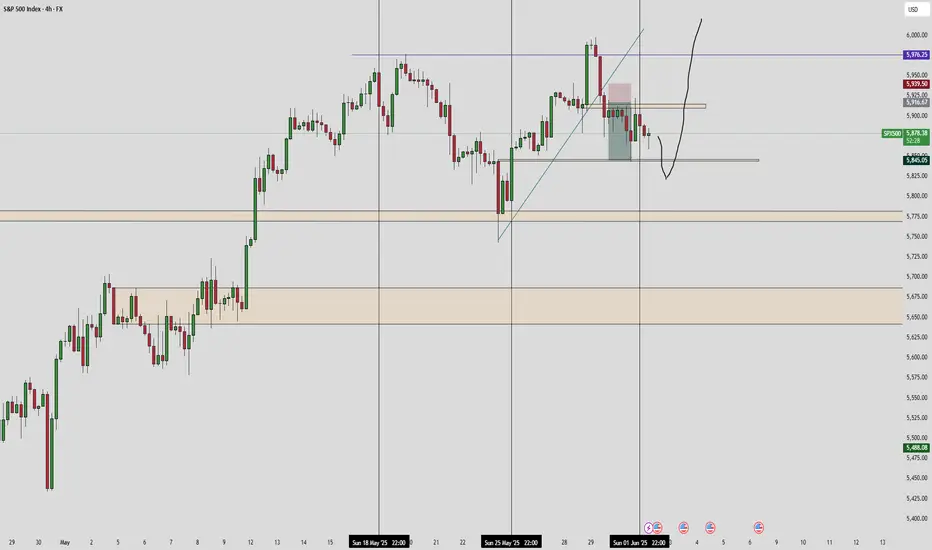
S&P 500 4 HR. WAVE C IS LIKELY OVER ON CORRECTION!1). Price is very likely heading towards the fair Market value @ 5870. 2). Risk Assets are weak today on US$ strength! 3). BANKS ARE SELLING! 4). Volume is dropping. 5). Trendline intersecting with target fib. level. 5). ONCE COMPLETED PRICE WILL PROGRESS NORTH ON WAVE 5 VERY LIKELY

SPY update for todayHello everyone,
Not much new to update today, the main highlight is that the market has broken down from the trendline. This is definitely something to take note of. However, today’s move came with relatively low volume, which suggests that while price dropped significantly, there wasn’t a lot of strength behind the move.
This reminds us of a key principle in trading: the market can do whatever it wants. It may look bullish today and turn bearish tomorrow. So always react to what the market is showing you, not just what you expect it to do. Easier said than done, I know, but it's essential.
Looking ahead, this potential pullback could present better entry opportunities, assuming the market doesn’t flip into a full bearish meltdown. For now, we need to give the market some room to breathe, observe how it reacts at key levels, and stay patient for the right setup.
Remember: we're still in a broadly bullish environment. So let’s wait for strong reactions at the right price points before jumping in.
