Position Sizing 101: How Not to Blow Up Your Account OvernightWelcome to the trading equivalent of wearing a seatbelt. Not really exciting but entirely recommended for its lifesaving properties. When the market crashes into your stop-loss at 3:47 a.m., you’ll wish you’d taken this lesson seriously.
Let’s talk position sizing — the least flashy but most essential tool in your trading kit. This is your friendly reminder that no matter how perfect your chart setup looks, if you’re risking 50% of your capital on a single trade, you’re not trading. You’re gambling. And also — if you lose 50% of your account, you have to gain 100% to get even.
✋ “Sir, This Isn’t a Casino”
Let’s start with a story.
New trader. Fresh demo account turned real. He sees a clean breakout. He YOLOs half his account into Tesla ( TSLA ). "This is it," he thinks, "the trade that changes everything."
News flash: it did change everything — his $10,000 account turned into $2,147 in 48 hours.
The lesson? Position sizing isn’t just about managing capital. It’s about managing ego. Because the market doesn’t care how convinced you are.
🌊 Risk of Ruin: The More You Know
There’s a lovely concept in trading called “risk of ruin.” Sounds dramatic — and it is. It refers to the likelihood of your account going to zero if you keep trading the way you do.
If you risk 10% of your account on every trade, you only need to be wrong a few times in a row to go from “pro trader” to “Hey, ChatGPT, is trading a scam?”
Risking 1–2% per trade, however? Now we’re talking sustainability. Now you can be wrong ten times in a row and still live to click another chart.
🎯 The Math That Saves You
Let’s illustrate the equation:
Position size = Account size × % risk / (Entry – Stop Loss)
Example: $10,000 account, risking 1%, with a 50-point stop loss on a futures trade.
$10,000 × 0.01 = $100
$100 / 50 = 2 contracts
That’s it. No Fibonacci razzle-dazzle or astrology needed. Just basic arithmetic and a willingness to not be a hero.
🤔 The Myth of Conviction
Every trader has a moment where they say: “I know this is going to work.”
Spoiler alert: You don’t. And the moment you convince yourself otherwise, you start increasing position size based on emotion, not logic. That’s where accounts go to die.
Even the greats keep it tight. Paul Tudor Jones, the legend himself, once said: “Don't focus on making money; focus on protecting what you have.” Translation: size down, cowboy.
🔔 Position Size ≠ Trade Size
A common mistake: confusing position size with trade size.
Trade size is how big your order is. Position size is how much of your total capital is being risked. You could be trading 10 lots — but if your stop loss is tight, your position size might still be conservative.
So yes, trade big. But only if your risk is small. You’ll do better at this once you figure out how asymmetric risk reward works.
🌦️ Losses Happen. Don’t Let Them Compound
Let’s say you lose 5% on a trade. No big deal, right? Until you try to “make it back” by doubling down on the next one. And then again. And suddenly, you’re caught in a death spiral of revenge trading .
This is not theoretical. It’s Tuesday morning for many traders.
Proper position sizing cushions the blow. It turns what would be a catastrophe into a lesson — maybe even a mildly annoying Tuesday.
🌳 It’s Not Just About Risk — It’s About Freedom
Smart sizing gives you flexibility (and a good night’s sleep).
Want to hold through some noise? You can. Want to scale in? You’re allowed. Want to sleep at night without hugging your laptop? Welcome to emotional freedom.
Jesse Livermore, arguably the most successful trader of all time, said it best: “If you can’t sleep at night because of your stock market position, then you have gone too far. If this is the case, then sell your position down to the sleeping level.”
⛳ What the Pros Actually Do
Here’s a dirty little secret: pros rarely go all-in without handling the risk part first (that is, calibrating the position size).
If they’re not allocating small portions of capital across uncorrelated trades, they’ll go big on a trade that has an insanely-well controlled risk level. That way, if the trade turns against them, they’ll only lose what they can afford to lose and stay in the game.
Another great one, Stanley Druckenmiller, who operated one of the best-returning hedge funds (now a family office) said: “I believe the best way to manage risk is to be bullish when you have a compelling risk/reward.”
🏖️ The Summer of FOMO
Let’s address the seasonal vibes.
Summer’s here. Volume’s thin. Liquidity’s weird. Breakouts don’t follow through. Every false move looks like the real deal until it isn’t. And every poolside Instagram story from your trader friend makes you want to hit that buy button harder.
This is where position sizing saves you from yourself. Small trades, wide stops, chill mindset. Or big trades, tight stops, a bit of excitement in your day.
No matter what you choose, make sure to get your dose of daily news every morning, keep your eye on the economic calendar , and stay sharp on any upcoming earnings reports (GameStop NYSE:GME is right around the corner, delivering Tuesday).
☝️ Final Thoughts: The Indicator You Control
In a world of lagging indicators, misleading news headlines, and “experts” selling you dreams, position sizing is one of the few things you have total control over.
And that makes it powerful.
So next time you feel the rush — the urge to go big — take a breath. Remember the math. Remember the odds. And remember: the fastest way to blow up isn’t a bad trade — it’s a good trade sized wrong.
Off to you: How are you handling your trading positions? Are you the type to go all-in and then think about the downside? Or you’re the one to think about the risk first and then the reward? Let us know in the comments!
US500 trade ideas

S&P 500 Index.4H CHART PATTERN.the S&P 500 Index (4H timeframe), it appears you're using a combination of Ichimoku Cloud, trend channels, and support/resistance zones to project downside targets. Here's the breakdown of your marked targets:
📉 Bearish Targets:
1. Target 1: Around 5,500
2. Target 2: Around 5,200
3. Target 3: Around 4,950–4,900
---
🔍 Technical Observations:
Price has broken below the upward trend channel.
It's entering the Ichimoku Cloud, signaling potential consolidation or bearish pressure.
The large blue downward arrow indicates a bearish expectation, possibly tied to macro/fundamental concerns or technical reversal patterns.
The grey resistance block near 5,960–6,000 suggests failed breakout/retest.
---
📌 Summary:
If current bearish momentum continues:
✅ Immediate Target: 5,500 (first major support)
⚠ Medium Target: 5,200
🔻 Final Target Zone: 4,900–4,950 (strong previous support and fib zone)
Let me know if you want stop-loss ideas, confluence indicators, or entry strategy breakdowns!

S&P500: Targeting 7,000 by the end of the year.S&P500 is bullish on its 1D technical outlook (RSI = 64.729, MACD = 100.990, ADX = 19.772) as it is extending the bullish wave started on the April 7th bottom. The long term formation is a Bullish Megaphone and the previous bullish wave peaked after a +48.33% rise. With the 1W RSI pattern almost identical as then, we remain bullish on SPX, TP = 7,000.
## If you like our free content follow our profile to get more daily ideas. ##
## Comments and likes are greatly appreciated. ##

sp 500 trend down S&P 500 remains in a broader downtrend, driven by persistent economic uncertainties and inflationary pressures. Despite a recent correction, with the SPY rising approximately 2.5% from $551.23 on April 25 to $565.00 on May 9, this uptick may be temporary, as market sentiment and macroeconomic indicators suggest ongoing volatility and potential further declines
5821 target beaeish flowBeen awhile since I posted to spy channel.
Ive observed a negative flow, with a bearish apex on the 2hr futures chart. My target is 5820. Fail attempt to breakout above 600 on spy, this appears ro be a liquidity grab by smart moneym I will break chart down further into layers

S&P 500 Short Update: Ending DiagonalEnding diagonals completed. Stop above 6040. Take profit at 5744 first.

[06/09] [GEX] Weekly SPX OutlookLast week’s outlook played out quite well — as anticipated, SPX hit the 6000 level, closing exactly there on Friday. This was the realistic target we highlighted in last week's idea.
🔭 SPX: The Bigger Outlook
It's difficult to say whether the rising SPX trend will continue. We're still in the "90-day agreement period" set by the administration, and so far, the market has shown resilience, avoiding deeper pullbacks like the one we saw in April.
With VIX hovering around 17–18, we’ve reached a zone where further SPX upside would require volatility. For the index to continue rising meaningfully, it needs to reverse the current bearish macro environment, and that can only happen with strong buying momentum — not a slow grind.
The parallel downward channel drawn a few weeks ago is still technically valid. Even a short 100-point squeeze would fit within this structure before a larger move down unfolds.
GEX levels give us useful clues heading into Friday. We're currently in a net positive GEX zone across all expirations, giving bulls a structural advantage, just like last week.
As of Monday’s premarket, SPX spot is at 6009.The Gamma Flip zone is between 5975–5990, with a High Volume Level (HVL) at 5985.
🔍 Let’s zoom in with our GEX levels — this gives us a deeper view than our GEX Profile indicator for TradingView alone.
🐂 🟢 If SPX moves higher, the following are logical profit-taking zones:
6050 (Delta ≈ 33)
6075 (Delta ≈ 25)
6100 (Delta ≈ 17)
🎯 Targeting above 6100 currently feels irrational — for instance, the next major gamma squeeze zone is at 6150, but that corresponds to a delta 6 level (≈94% chance the price closes below it), so I won’t aim that high yet.
🐻🔴 In a bearish scenario:
5975 and 5950 are the first nearby support zones (Deltas 30 and 38).
If momentum picks up, 5900 becomes reachable quickly, even if it's technically a 17-delta distance — because that’s deep in the negative GEX zone.
📅 Don’t forget: On Wednesday premarket, we’ll get Core Inflation Rate data — a key macro risk that could shake things up, regardless of TSLA drama fading.
📌 SPX Weekly Trading Plan Conclusion
Whatever your bias, keep cheap downside hedges in place. We've been rising for a long time, and even if SPX breaks out of the descending channel temporarily, resistance and the gamma landscape may pull price back swiftly.

-(update)- Opportunity for buying NASDAQ After careful observation and relying on support and resistance, I see an upward movement from the support represented in front of you.

DOOR TO HELL IS ABOUT TO OPEN AND NO ONE IS READY.Well where do I being, firstly the world has become nonsensical and the average joe thinks they are an expert in the financial field. Little do they know the trap has been set and now it's about to be played and the fools that have been investing for the past decade are about to loose everything they worked hard for.
FOOLS DON'T REALISE THAT THE STOCK MARKET IS ABOVE A 100 YEAR TRENDLINE AND THE PAST TIMES IT HAS HIT THIS TRENDLINES 1929, 2000, 2009, 2021, THE MARKET CRASHED AND PUT THESE IDIOTS IN THEIR GRAVES. YOU CANT FKING DISRESPECT A 100 YEAR TRENDLINE AND THINK IT WILL GO PARALABOLIC, "TO THE FKING MOON THEY SAY". Yes I am a bear, the biggest bear in the forest but I am also trying to make people understand what is about to come no one is ready.
SPX Will crash from 6069 to 420, it will drop 30% with a rebound on the 1.618 fib to 550 and then the mother of all crashes will come into play a 80-90% correction to 160, the 2009 tops. No one is ready for this play.
SPEAD THOSE CHEEKS WIDE BULLS, WHAT IS ABOUT TO HAPPEN THEIR IS NO RETURN. no homo.

Is SPX at a crucial point here.... inflection point?Until yesterday, it seemed that bulls were fully in control chugging along to make new ATH or go closer to previous ATH. Seemed like SPX was breaking from ascending triangle. Looked bulllish going into this Opex close, certainly propped by good data and good tariff comments.
Now with the recent war news, and the dip we had yesterday, seems like new pattern emerging (rising wedge) which is bearish. Also keep in mind the JPM hedge that expires end of month. The open interest shows that JPM hedge is still alive (they havent closed) and based on my calculations currently JPM has a loss of around $622M.
To stem losses market at minimum needs to be below 5900 by end of month (at 5900 JPM loses $59M but its chump change for them) and for them to be neutral or make money then SPX needs to be 5300 and below by end of month.
Currently around 5975, would mean a drop of 500-600 points in next 2 weeks... certainly can happen....
Appreciate your comments!

S&P500 No signs of stopping here. Can hit 6900 before years end.The S&P500 index (SPX) has turned the 1W MA50 (blue trend-line) into Support, successfully testing it and holding and is now going for the All Time High Resistance test. Based on its 1W RSI structure and candle action, it resembles the previous times since 2023 that after a quick consolidation, it broke upwards again aggressively.
As you can see, both of those Bullish Legs that started on the 2023 Higher Lows trend-line, hit at least their 1.618 Fibonacci extension before a new 3-week red pull-back. In the case of 2024, even the 2.0 Fib ext got hit a little later.
As a result, we expect to see at least 6900 (Fib 1.618) before the end of 2025, with the good case scenario (Fib 2.0) going as high as 7500.
-------------------------------------------------------------------------------
** Please LIKE 👍, FOLLOW ✅, SHARE 🙌 and COMMENT ✍ if you enjoy this idea! Also share your ideas and charts in the comments section below! This is best way to keep it relevant, support us, keep the content here free and allow the idea to reach as many people as possible. **
-------------------------------------------------------------------------------
Disclosure: I am part of Trade Nation's Influencer program and receive a monthly fee for using their TradingView charts in my analysis.
💸💸💸💸💸💸
👇 👇 👇 👇 👇 👇

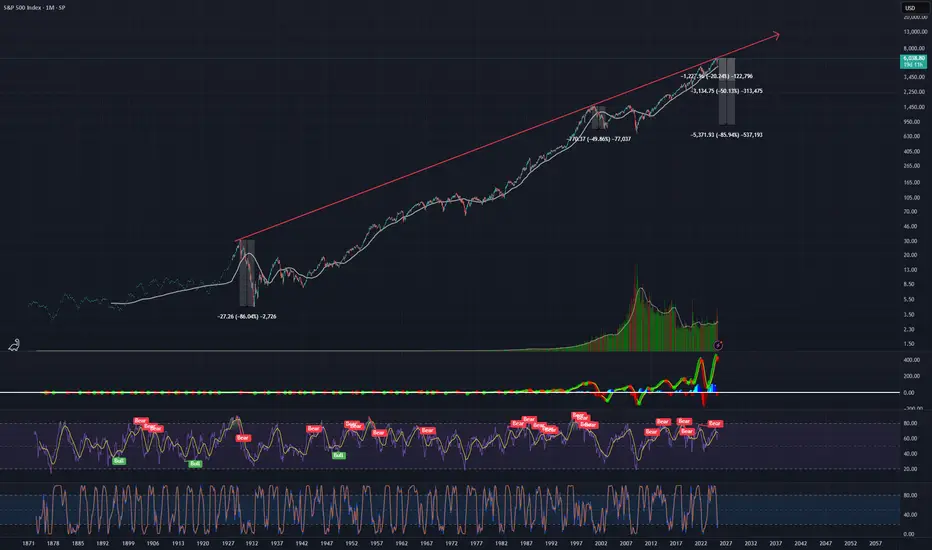
SPX Danger ZoneLog chart of SPX with a trendline connecting 1929 top to 2000 dot com top and up to 2024-25 top.
We already touched this trendline multiple times at the end of 2024 and the beggining of 2025, after which we saw a 20ish percent pullback.
If history rhymes, then we can expect a top at 6250-6350 area in the next few months and we might even stay around there for some time trapping retail investors and other foverever bulls. However, the crash ranging beteween 50 percent (2000 dot com bubble burst) and 86 percent (1929 Wall Street crash) might unravel over the next few years.
With the amount of leverage in the market this house of cards can tumble down even quicker.
Take care.
You're all doomedEveryone has gone full bull again. The selloff is not over. The selloff is about to resume. The shorts are MIA. Down til Christmas. Starts this week.

S&P500 is Nearing an Important Support of 5,960!!!Hey Traders, in today's trading session we are monitoring US500 for a buying opportunity around 5,960 zone, US500 is trading in an uptrend and currently is in a correction phase in which it is approaching the trend at 5,960 support and resistance area.
Trade safe, Joe.

update at 12pmMarket has reentered the wedge, not a great sign, but we'll have to see how the day loses. Nat Gas came down hard. Gold is holding support, BTC getting a bounce but I think it goes lower. OIL had a nice bounce but may fall here.

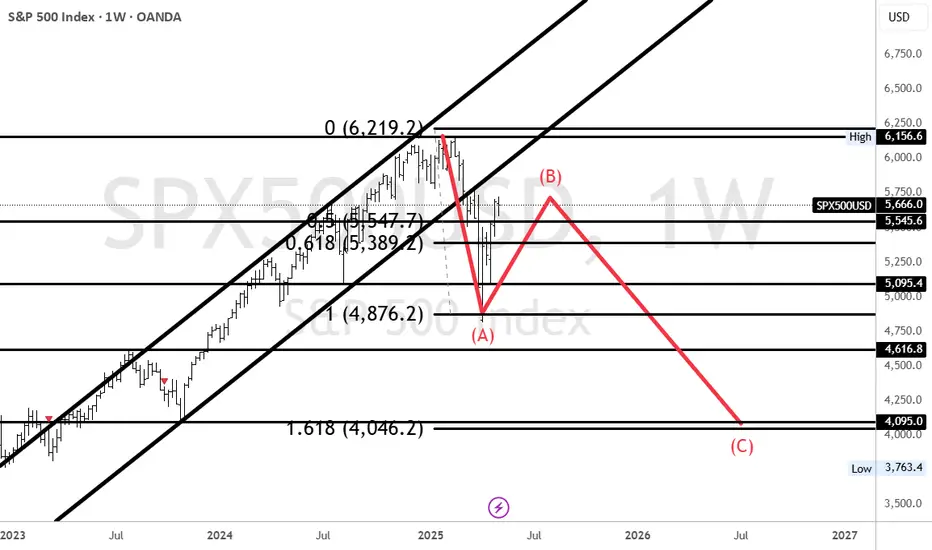
A Potentially Dangerous Pattern Takes ShapeWhile the futures market has yet to break into new all-time high territory, the previously discussed bearish micro setup has now been invalidated. In its place, we’re witnessing a complex, overlapping advance—creeping steadily toward the prior highs in the S&P 500 (ES).
At the micro level, I currently see no compelling bearish setup. However, this grinding upward move—lacking strong conviction from either buyers or sellers—is not necessarily bullish. In fact, it’s a hallmark of a potentially dangerous pattern: a primary degree ending diagonal.
If my interpretation is correct, both the “orange” and “purple” wave counts point to the same ominous conclusion. They suggest that what we're seeing could culminate in a sharp, possibly violent reversal—one that would ultimately retrace back to where this entire primary wave began. For reference, that’s just above 4,000, marked by the conclusion of Primary Wave 4 in October 2022.
This is the moment for caution—not after the damage is done.
Yes, we may push into new all-time highs. But within this fragile and overlapping structure, that outcome is far from guaranteed. Even if we get there, the looming question remains:
At what cost?

Volume Droughts and False Breakouts: Your Summer Trading TrapsThe market’s heating up — but is your breakout about to dry up? Here’s a word about the importance of summer trading success (helped by volume — the main character).
☀️ Welcome to the Liquidity Desert
Summer’s getting ready to slap the market with a whole flurry of different setups. Picture this — the beaches are full, your trading desk is half-abandoned, and the only thing more elusive than a decent breakout is your intention to actually read that big fat technical analysis book you bought last year.
And yet, here you are — eyes glued to the chart — watching a clean breakout above resistance that’s just begging for you to hit “buy.” Everything looks perfect. Price rips through the level like it’s made of butter. But there’s just one tiny problem: no volume. None. Nada. Niente.
Congratulations. You’ve just bought the world’s most attractive false breakout.
🏝️ Summer Markets: Where Good Setups Go to Die
Let’s set the scene.
It’s June. The big dogs on Wall Street are golfing in the Hamptons and sipping mezcal espresso martinis, interns are running the order flow, and every chart you love is doing just enough to get your hopes up before crushing them like a half-melted snow cone.
This isn’t your usual high-volatility playground. Summer markets — especially between June and August — are notorious for thin liquidity . That means fewer participants, smaller volume, and a much higher likelihood of being tricked by price action that looks strong… until it’s not.
And it’s not just stocks. Forex, crypto, commodities — even the bond boys — all face the same issue: when fewer people are trading, price becomes more fragile. And fragile price = bad decisions.
🚨 Why False Breakouts Love Quiet Markets
False breakouts happen when price appears to break above resistance (or below support), only to reverse sharply — often trapping late traders and triggering stop hunts.
But in summer? It’s a whole different beast. Here’s why:
No liquidity cushion : In normal markets, you need strong volume to fuel a breakout. Without that, the breakout doesn’t necessarily have the gas to keep going.
Market makers get bored : Thin markets mean it’s easier for a few big orders to push prices where they want. Welcome to manipulation season (there, we said what we said!).
Algos go wild : With fewer humans around, algorithms dominate. And they love playing games around key levels.
🧊 The Mirage Setup: A Cautionary Tale
Let’s say you’re watching GameStop NYSE:GME stock. Resistance at $30. Price hovers there for days, teasing a breakout. Then — boom — a sudden 6% pop above.
You buy. Everyone buys. The trading community goes nuts. “This is it bois!”
But there’s a problem. Look at the volume: a trickle. Not even half the average daily volume. Ten minutes later, NYSE:GME is back below $30, your stop loss is hit, and you’re left explaining to your cat why you’re emotionally invested in a ticker.
Moral of the story? Don’t trust breakouts when no one’s trading.
📉 Volume: Your Summer Lie Detector
Volume is more than just a histogram under your chart. It’s your truth serum. Your smoke alarm. Your buddy who tells you to think twice before jumping in that trade.
Here’s how to read it right when everyone else is checking out:
Confirm the move : If price breaks out, but volume doesn’t spike at least 20–30% above the average — be suspicious.
Look for acceleration : Healthy moves gather steam. You want to see volume growing into the breakout, not fizzling.
Watch for volume cliffs : A sudden volume drop right after a breakout often signals that the move is running on fumes.
Add Volume Profile Indicators : Just to be safe, you can always add Volume Profile Indicators to your chart — they analyze both price and volume and can highlight what your keen eye might miss.
Remember what happened last summer? And how we all learned the downside of something called "carry trade"? Those who were short the Japanese yen remember .
🧠 Context Over Candles: Be a Liquidity Detective
Let’s say you see a double top pattern — your favorite. Clean lines. Tight price action. Perfect setup.
But now zoom out.
It’s July 3. Pre-holiday half-day. No volume. And the S&P 500 SP:SPX has moved 0.04% all day. Still want in?
Technical analysis doesn’t work in a vacuum. Chart patterns lose their predictive power when the environment they live in is compromised. And thin liquidity is a compromised environment.
🐍 Snakes in the Sand: How Market Makers Bait Traps
Market makers (and large players) are like desert snakes — quiet, patient, and very good at making you move when you shouldn’t.
Here’s how they bait traders in illiquid markets:
Run stops above resistance to trigger breakout buyers.
Dump shares immediately after breakout to trap retail.
Ride the reversal as trapped longs scramble to exit.
They’re so powerful some say they run the game — and can stop it anytime it’s not going their way (remember the GameStop freeze? ) It’s a psychological game — and in the summer, it’s easier to do shenanigans because most players aren’t watching.
Don’t be the one jumping at shadows. Be the trader who expects the trap.
🛠️ How to Survive (and Thrive) in the Summer Slump
Not all is lost. You can still trade — smartly.
Here’s your Summer Survival Toolkit :
Wait for volume confirmation on every breakout.
Lower your position size . Less liquidity = more slippage risk.
Set wider stops , or better yet, sit out the chop.
Focus on trending names with relative strength and solid weight (think: tech titans, oil plays, or financials).
Use alerts instead of staring at charts . Don’t mistake boredom for opportunity.
And most importantly: Know when not to trade . Discipline is a position too.
🔚 Final Word: This Isn’t the Off-Season. It’s the Setup Season.
Summer might feel slow, but it’s not dead.
Smart traders know that the best trades of Q3 and Q4 often begin in July — as early trendlines form, consolidation patterns develop, and institutional footprints quietly appear in the tape.
So use this time wisely. Don’t force trades. Watch volume like a hawk. And never forget: the best breakouts don’t need hype — they bring their own thunder.
Stay cool, stay patient, and trade smart. The mirage may be tempting, but the oasis always belongs to the ones who go far enough and don’t give up.
Off to you : How are you navigating trading during the summer months? Staying poolside with one eye on the charts or actively seeking out opportunities while folks catch a break? Share your insights in the comments!

Elliott Wave Perspective: S&P 500 (SPX) Set to Finish Wave 3Since reaching its low on April 7, 2025, the S&P 500 (SPX) has embarked on an impulsive rally. From that bottom, the index progressed through distinct waves, as defined by Elliott Wave theory. Wave 1 concluded at 5246.57, followed by a corrective pullback in wave 2, which found support at 4910.42. Currently, wave 3 is underway, unfolding as a strong impulse with subdivisions in a lesser degree.
From the wave 2 low, the rally continued with wave ((i)) peaking at 5481.34. A brief retracement in wave ((ii)) then followed which ended at 5101.63. The index then surged higher in wave ((iii)), reaching 5968.61. A subsequent pullback in wave ((iv)) found support at 5767.41, setting the stage for further gains. The index should push to a few more highs to complete wave ((v)) of 3. This will mark the culmination of this upward phase.
Looking ahead, once wave 3 concludes, a corrective wave 4 should follow, retracing part of the rally from the April 7, 2025 low. This correction could unfold in a 3, 7, or 11-swing pattern before the index resumes its upward trajectory. In the near term, as long as the pivot low at 5765.74 holds, the S&P 500 is poised to achieve additional highs to finalize wave ((v)) of 3. However, if this critical support at 5765.74 is breached, it would signal the end of wave 3, prompting a larger wave 4 pullback, potentially in a 3, 7, or 11-swing structure.

S&P 500 Maintains Uptrend — But for How Long?S&P 500 Maintains Uptrend — But for How Long?
As the chart of the S&P 500 (US SPX 500 mini on FXOpen) shows, price movements in June continue to form an upward trend (highlighted in blue).
The bullish momentum is being supported by:
→ News of a potential trade agreement between the United States and China;
→ The latest inflation report. Data released yesterday showed that the Consumer Price Index (CPI) slowed from 0.2% to 0.1% month-on-month.
President Donald Trump described the inflation figures as “excellent” and said that the Federal Reserve should cut interest rates by a full percentage point. In his view, this would stimulate the economy — and serve as another bullish driver.
However, as illustrated by the red arrow, the index pulled back yesterday from its highest level in three and a half months, falling towards the lower boundary of the channel. This decline was triggered by concerning developments in the Middle East. According to media reports, the US is preparing a partial evacuation of its embassy in Iraq, following statements by a senior Iranian official that Tehran may strike US bases in the region if nuclear talks with Washington fail.
Technical Analysis of the S&P 500 Chart
Currently, the price remains near the lower boundary of the ascending channel, reinforced by the psychologically significant 6,000-point level.
However, note that line Q — which divides the lower half of the channel into two quarters — has flipped from support to resistance (as indicated by black arrows). This suggests increasing bearish pressure, and there is a possibility that sellers may soon attempt to push the price below the channel support.
Be prepared for potential spikes in volatility on the E-Mini S&P 500 (US SPX 500 mini on FXOpen) chart as markets await the release of the Producer Price Index (PPI) at 15:30 GMT+3 today.
This article represents the opinion of the Companies operating under the FXOpen brand only. It is not to be construed as an offer, solicitation, or recommendation with respect to products and services provided by the Companies operating under the FXOpen brand, nor is it to be considered financial advice.

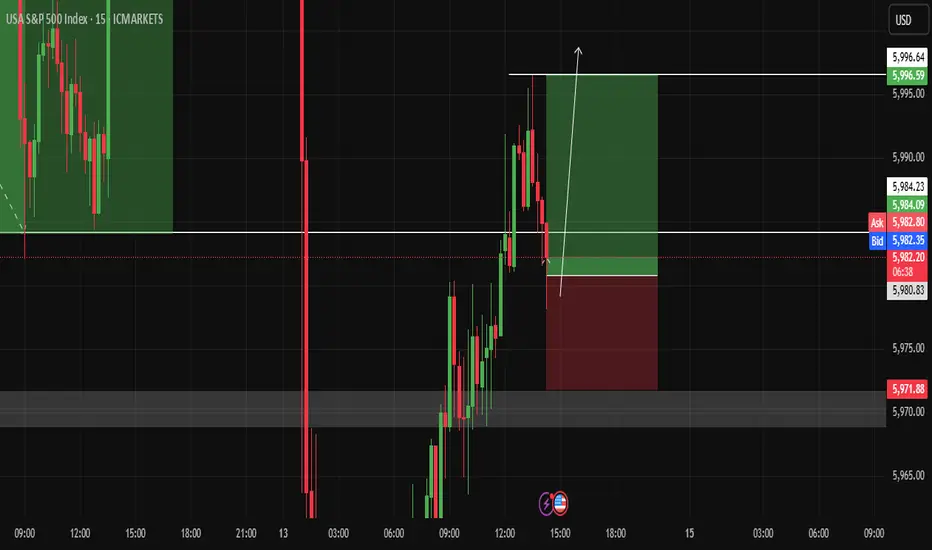
S&P500 Update: Break of Lower TrendlineIn this video, I updated the wave count for S&P500 and discussed 2 different ways of counting it but ended with a bias on a stronger wave 3 down as opposed to a wave 5 of 1 down.
The stop loss is above 6016, with 2 take profit targets:
1) 5940
2) 5923
Good luck!

Bulls game over now 4611 incoming Weekly TF down move incoming..Fasten your seatbelt please..Big move incoming.. Good luck and safe Short from 6040 Tp 4611

Opportunity to buy NASDAQBy combining support and resistance, I see NASDAQ rising to 5996 before reaching to 5971
US500 Could Rise Further After U.S - China Trade FrameworkUS500 could rise further after U.S.-China Trade Framework - Bloomberg
After two days of marathon negotiations in London, the U.S. and China agreed to a “framework” for resuming a trade truce that had unraveled in recent weeks. Top economic officials from both countries are expected to present it to President Trump and Xi Jinping, China’s leader, for final approval.
This news could boost the stock market today, and the US500 could rise further after the two leaders confirm this agreement.
US500 is well-positioned for another upward wave.
The price broke out of a bullish triangle pattern, suggesting further gains.
Key upside targets are 6100 and 6240.
You may find more details in the chart!
Thank you and Good Luck!
❤️PS: Please support with a like or comment if you find this analysis useful for your trading day❤️
