US500 trade ideas
S&P500 INTRADAY resistance at 5510A wave of earnings reports is due today, with Microsoft and Meta in focus. The tech sector remains under pressure, highlighted by a 15% drop in Super Micro Computer after disappointing results.
In Europe, banks are seeing strong revenue growth, benefiting from recent market volatility linked to Trump’s trade policies. However, Mercedes and Stellantis have joined the list of companies withdrawing guidance due to uncertainty.
Donald Trump has again criticized Fed Chair Jerome Powell and defended his tariff strategy during an event marking his 100th day in office. Investors are now awaiting key US data, including inflation and GDP figures.
Meanwhile, China’s factory activity has contracted to its lowest level since December 2023, signaling the early impact of US tariffs and increasing pressure for government stimulus.
US consumer companies are also sounding cautious, pointing to a weaker economic outlook ahead.
Key Support and Resistance Levels
Resistance Level 1: 5670
Resistance Level 2: 5740
Resistance Level 3: 5820
Support Level 1: 5380
Support Level 2: 5310
Support Level 3: 5236
This communication is for informational purposes only and should not be viewed as any form of recommendation as to a particular course of action or as investment advice. It is not intended as an offer or solicitation for the purchase or sale of any financial instrument or as an official confirmation of any transaction. Opinions, estimates and assumptions expressed herein are made as of the date of this communication and are subject to change without notice. This communication has been prepared based upon information, including market prices, data and other information, believed to be reliable; however, Trade Nation does not warrant its completeness or accuracy. All market prices and market data contained in or attached to this communication are indicative and subject to change without notice.
Will April Close with a Bang?You ever get that feeling the market’s just waiting for a reason to move?
That’s where we are.
It’s been a quiet start to the week – barely a pulse.
And Tuesday? One signal. Just one.
But it was a bullish pulse bar, and it paid.
Price is still coiling, compressing tighter, and Bollinger Bands are pinching harder than a crab on Red Bull.
We’re seeing the classic signs of range contraction – which usually means a range expansion is coming.
So what’s the move?
Stay bullish.
Stay patient.
And be ready to pounce the moment price breaks free.
Today’s calendar gives us a few nudges – ADP, GDP, ECI, PCE – nothing major, but enough to cause a wobble or spark.
The bias is bullish.
The system’s ready.
And if we break out of this pinch, I’m looking at 6106 on the swing.
Even a dip to 5400 wouldn’t change the structure – just another spot to reload the bulls.
Let’s finish April strong.
Let’s grab another one by the horns.
---
SPX Market View
Let’s call it like it is – the market’s been locked in a deep freeze.
Monday and Tuesday barely moved.
Why?
No real news. Month-end positioning. And a crowd of big players too busy doing their internal accounting gymnastics to push buttons.
But while it looked like nothing happened, Tuesday’s single bullish pulse bar delivered the goods.
One bar. One setup. One result: Profit.
Now as we roll into Wednesday, things get spicy – not because the economic data is explosive… but because compression like this doesn’t last.
The Bollinger Band width is pinched tighter than a tax refund cheque.
And we know what that means:
Tight range = pressure building.
Breakout = opportunity waiting.
So today’s plan?
Stay bullish until proven otherwise.
Use the pulse bar system to play range edges or trigger entries.
Look for breakout confirmation to ride it toward 6106.
Remain calm if we dip toward 5400 – structure still holds.
Economic data today (ADP Jobs, GDP, Employment Costs, and Core PCE) might trigger volatility, but it’s not about reacting to the numbers…
It’s about watching how price responds.
We’re not forecasting.
We’re not feeling.
We’re waiting for the setup – then pulling the trigger.
Price is whispering right now.
Soon, it’ll yell.
Be ready.
---
Expert Insights:
Mistake #1: Assuming news equals movement.
Just because data drops doesn’t mean price pops.
Fix: Always wait for price confirmation. Pulse bars > economic guesses.
Mistake #2: Ditching the bias at the first wobble.
A dip isn’t a collapse.
Fix: Know your structure. Dips to 5400 are still within a bullish regime.
Mistake #3: Forgetting the role of compression.
Tight ranges often precede big shifts.
Fix: Don’t ignore the squeeze. Bollinger Band pinch = breakout fuel.
---
Rumour Has It…
In a desperate bid to solve market stagnation, Wall Street has reportedly hired a motivational speaker named Terry the Turnaround Candle.
His credentials?
He once convinced a doji to become a dragonfly.
Sources say he opens every session with, “Are you going to let that Bollinger Band define you?!”
Meanwhile, the Fed is beta-testing new AI price models based on squirrel hoarding patterns in Central Park.
Traders remain cautiously optimistic.
Squirrels remain heavily long acorns.
This section is entirely made-up satire. Probably.
---
Fun Fact
Did You Know?
The term “month-end rebalancing” sounds official… but it’s really just fund managers shuffling things around so their spreadsheets look prettier.
They often trim winners, pad laggards, and balance sector weights.
But in low-volume markets like this week, even tiny shifts can cause weird little waves that trigger setups.
So when price “randomly” spikes or dips late in the session on month’s end?
It’s often not news – it’s bookkeeping chaos in disguise.
Which is why we trust setups, not headlines.
Grab Some Points To Upside In SPX/USD $$$Hey fellow traders and followers!
How go's the profits so far? Market movin & groovin to the beat of the Orange drum.
I'm here to help if you are having any troubles or confusion with SPX. Let's have a quick look.
We have a V pattern in the 1hr chart so let's trade this baby!
Breakline is 5530.3 so we wait to see a break above before getting long. Pattern support is around 5510, a break below that price area would likely cancel out the bullishness of this pattern so keep eyes on that. Daily low support sits around 5484.9. A break below that support spells a short down for 29 points. A break above the breakline is a long good for around 29 points. RSI is 55.77 (Bulla). Easy money if the V gets flyin $$$.
Don't listen to any news or rumors, listen to your charts. Wait! Did you hear that? Your 1hr chart is whispering something about easy money if you pay close attention to the numbers and the rules laid out within.
Hey! best of luck in all your trades people ! Wishing all of you prosperous trades. $$$
S&P500 INTRADAY resistance at 5510Earnings season heats up with major companies like Visa, Coca-Cola, Starbucks, UPS, and Pfizer reporting results. In Europe, HSBC announced a $3 billion share buyback, while BP shares dropped due to weaker cash flow.
In Canada, the Liberal Party is set to win a fourth term, but likely without a majority, which could lead to a coalition-style government.
Meanwhile, the Trump administration plans to ease auto tariffs on foreign parts used in U.S.-made vehicles, boosting Ford and GM shares in premarket trading.
Market Impact:
Watch for shifts in trade-sensitive sectors, supply chain plays (especially in tech), and defense stocks as geopolitical risk evolves.
Key Support and Resistance Levels
Resistance Level 1: 5670
Resistance Level 2: 5740
Resistance Level 3: 5820
Support Level 1: 5380
Support Level 2: 5310
Support Level 3: 5236
This communication is for informational purposes only and should not be viewed as any form of recommendation as to a particular course of action or as investment advice. It is not intended as an offer or solicitation for the purchase or sale of any financial instrument or as an official confirmation of any transaction. Opinions, estimates and assumptions expressed herein are made as of the date of this communication and are subject to change without notice. This communication has been prepared based upon information, including market prices, data and other information, believed to be reliable; however, Trade Nation does not warrant its completeness or accuracy. All market prices and market data contained in or attached to this communication are indicative and subject to change without notice.
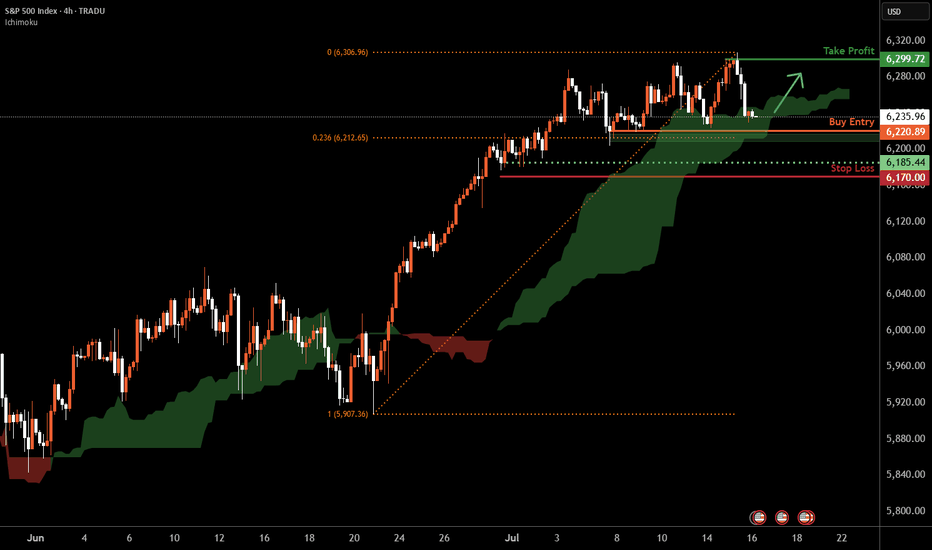
SPX500 H4 | Potential bullish bounceSPX500 could fall towards an overlap support and potentially bounce off this level to climb higher.
Buy entry is at 5,546.94 which is an overlap support.
Stop loss is at 5,440.00 which is a level that lies underneath an overlap support.
Take profit is at 5,789.71 which is a swing-high resistance.
High Risk Investment Warning
Trading Forex/CFDs on margin carries a high level of risk and may not be suitable for all investors. Leverage can work against you.
Stratos Markets Limited (tradu.com):
CFDs are complex instruments and come with a high risk of losing money rapidly due to leverage. 63% of retail investor accounts lose money when trading CFDs with this provider. You should consider whether you understand how CFDs work and whether you can afford to take the high risk of losing your money.
Stratos Europe Ltd (tradu.com):
CFDs are complex instruments and come with a high risk of losing money rapidly due to leverage. 63% of retail investor accounts lose money when trading CFDs with this provider. You should consider whether you understand how CFDs work and whether you can afford to take the high risk of losing your money.
Stratos Global LLC (tradu.com):
Losses can exceed deposits.
Please be advised that the information presented on TradingView is provided to Tradu (‘Company’, ‘we’) by a third-party provider (‘TFA Global Pte Ltd’). Please be reminded that you are solely responsible for the trading decisions on your account. There is a very high degree of risk involved in trading. Any information and/or content is intended entirely for research, educational and informational purposes only and does not constitute investment or consultation advice or investment strategy. The information is not tailored to the investment needs of any specific person and therefore does not involve a consideration of any of the investment objectives, financial situation or needs of any viewer that may receive it. Kindly also note that past performance is not a reliable indicator of future results. Actual results may differ materially from those anticipated in forward-looking or past performance statements. We assume no liability as to the accuracy or completeness of any of the information and/or content provided herein and the Company cannot be held responsible for any omission, mistake nor for any loss or damage including without limitation to any loss of profit which may arise from reliance on any information supplied by TFA Global Pte Ltd.
The speaker(s) is neither an employee, agent nor representative of Tradu and is therefore acting independently. The opinions given are their own, constitute general market commentary, and do not constitute the opinion or advice of Tradu or any form of personal or investment advice. Tradu neither endorses nor guarantees offerings of third-party speakers, nor is Tradu responsible for the content, veracity or opinions of third-party speakers, presenters or participants.
Trading the Impulse Rally Retracement — Price and Time Symmetry Fundamental —
Trend is observed from an impulse run’s lowest/highest point and projected outwards in symmetrical fibonacci retracement via price/time from the first reversal candle to the end of the rally, creating crosshairs. These ‘crosshairs’ visually represent the trending ‘price distribution projection’ in price/time symmetry.
Using this concept, I draw a ‘projection trend line’ from the bottom or top of the impulse run thru the projected 78.6% price/time retracement value, to identify the price distribution structure in a linear form.
Now to introduce my STOP LOSS TRIANGLE.
This is a concept of decaying price and time as an underlying move towards our theoretical projection, where if the underlying enters our built faded cross-section, the SL is triggered to avoid sideways consolidation and decaying contract premiums.
This ‘right’ triangle that is ‘sclene’ by nature is created by taking the furthest projection in price/time symmetry (78.6%) and drawing a vertically placed straight line to the highest/lowest point in the rally previously identified. Here, I create a ‘right triangle’ by turning 90 degrees towards my final point, which is made by the nearest projection in price/time symmetry (38.2%). In its entirety, this forms the stop loss triangle
SPX 500 turns lower ahead of busy weekAhead of a busy week, the S&P 500 has found resistance at a key area of resistance near 5550. The Index had rallied in the previous three sessions, but with trade and economic uncertainty still at the forefront, investors are not rushing to chase this rally - and rightly so. May be they will still buy the dip as we head deeper into the week, though, given Trump's change of tone and optimism surrounding trade deals. For me the key support area to watch is around 5,300, but other areas of support including 5840 and 5400.
Beyond trade negotiations and trade concerns, a flood of traditional economic data is set to be released this week. Key highlights include PMI surveys from China and the US, first-quarter US GDP, the Bank of Japan’s policy meeting on Thursday, and the critical US nonfarm payrolls report on Friday. On top of all that, it’s the biggest week of earnings season, featuring results from Microsoft and Meta after Wednesday’s close, and from Apple and Amazon—four members of the so-called “Magnificent Seven”—reporting on Thursday.
By Fawad Razaqzada, market analyst with FOREX.com
April 28, 2025 - Broken Supply Chains, and the DC CircusHello everyone, it’s April 28, 2025. The week ahead promises to be spectacular (or a complete disaster) depending on which way the wind blows out of Washington. So far, the futures are down about 0.6% this morning, as everyone’s trying to cut risk ahead of a week crammed with Big Tech earnings ( NASDAQ:AAPL , NASDAQ:MSFT , NASDAQ:AMZN , NASDAQ:META ), a mountain of macro data (PCE, GDP, ISM, jobs), and of course, the never-ending Trump tariff soap opera.
On the US politics front, Trump stayed uncharacteristically quiet over the weekend, no new bombshells. But whispers about “talks” with China surfaced, without any real confirmation. Meanwhile, several countries are supposedly rushing to negotiate tariff deals with the US. Expect headlines (and chaos) throughout the week.
Supply chains are starting to crack. Container traffic from China to the US has plunged 60%, and if deals aren’t made by mid-May, we could be staring down empty shelves and layoffs in transport and retail sectors. Think “Black Friday” without anything to buy.
Meanwhile, the drama at the Fed continues. Kevin Warsh, still salty about not replacing Powell, attacked the Fed’s “media circus” style, blaming it for post-Covid inflation. Warsh wants the Fed to go old-school: shut up, protect the dollar, and stop playing superhero. No forecasts, no endless press conferences. Just cigars and silence.
On the macro side, this week’s economic data could turn into a horror show: weak jobs numbers, soft GDP, slowing PCE, all raising the probability of recession. If that happens, expect markets to start begging the Fed to cut rates sooner rather than later.
Assets snapshot:
• BLACKBULL:WTI : $63.36
• OANDA:XAUUSD : $3,307
• INDEX:BTCUSD : $94,000
In short: expect maximum volatility, endless surprises from DC, and a market that could spin on a dime. Stay sharp, stay skeptical, and brace for anything.
S&P 500 Rally Exhausted? Watch This Level for the Next Drop!The S&P 500 Index( SP:SPX ) has finally touched the Resistance zone($5,680-$5,500) as I expected in my previous post .
The S&P 500 Index is moving near the Resistance zone($5,680-$5,500) , the Resistance line, and Yearly Pivot Point .
Also, we can see the Regular Divergence(RD-) between Consecutive Peaks .
In terms of Elliott Wave theory , it seems that the S&P 500 Index is completing the Zigzag Correction(ABC/5-3-5) , and if the uptrend line breaks , we can confirm the end of the Zigzag correction .
When the S&P 500 Index started to rise on April 22 , Bitcoin also started to rise at the same time , so a decline in the S&P 500 Index can cause Bitcoin ( BINANCE:BTCUSDT ) to decline .
I expect the S&P 500 Index to drop to at least $5,313 AFTER breaking the uptrend line .
Note: If the S&P 500 Index touches $5,712, we can expect more pumps.
Please respect each other's ideas and express them politely if you agree or disagree.
S&P 500 Index Analyze (SPX500USD),2-hour time frame.
Be sure to follow the updated ideas.
Do not forget to put a Stop loss for your positions (For every position you want to open).
Please follow your strategy and updates; this is just my Idea, and I will gladly see your ideas in this post.
Please do not forget the ✅' like '✅ button 🙏😊 & Share it with your friends; thanks, and Trade safe.
To the Moon: Space Isn't Just for Billionaires. It's for You TooTo your parents, getting involved in space meant joining NASA, becoming an astronaut, or — more realistically — building a scale model of the Saturn V and telling them you wanted to be "just like Neil Armstrong."
Today? You don’t need a PhD, perfect vision, or the ability to survive on dehydrated ice cream. The economics of orbit is accessible from your screen through the shares of publicly listed companies.
While billionaires are busy trying to out-flex each other in orbit, there’s a rapidly growing group of public companies that you can use as a launchpad to space exposure.
Let's explore (pun intended) how space is no longer science fiction only — it's an economic sector you can trade.
🚀 SpaceX: The Giant with a Gravitational Field
First, let’s get this out of the way: SpaceX is still private. Elon Musk’s rocket-powered unicorn dominates the headlines — and deservedly so. The company is launching Starlink satellites by the hundreds, winning NASA contracts, and discussing building cities on Mars where we can move and grow space potatoes.
But unless you have deep VC connections or you run a private equity fund, you can’t buy SpaceX stock yet. (Cue the tiny violin.) According to private-market estimates, SpaceX boasts a valuation of $350 billion, making it the world’s most expensive private company.
What you can do is invest in companies that supply, compete with, or benefit from the SpaceX era. Here are a few ideas.
🛸 Rocket Lab NASDAQ:RKLB : The Mini-SpaceX
If SpaceX is the Goliath of orbital launches, Rocket Lab is the David — except instead of a slingshot, it's using the Electron rocket and prepping the bigger Neutron.
Rocket Lab specializes in small satellite launches — think communications, Earth observation, climate monitoring. The company is cheaper, faster, and more frequent than the heavy-lifters like Falcon 9 by SpaceX. If you’re bullish on the boom in low-Earth orbit activity, Rocket Lab could be the small-cap rocket you can strap your portfolio to.
Bonus points — it’s not just a launch company. Rocket Lab, valued at around $10 billion, is expanding into satellite manufacturing, in-orbit services, and deep space missions.
👽 Intuitive Machines NASDAQ:LUNR : Houston, We Have a Moonshot
With a ticker symbol NASDAQ:LUNR — obviously leaning into the Moon theme — Intuitive is all about lunar landers and space infrastructure. The company is part of NASA’s Commercial Lunar Payload Services (CLPS) program, helping deliver payloads (science experiments, rovers, tech gizmos) to the Moon.
In the absence of crypto moons, these guys are aiming for the real thing.
But be warned: Intuitive is a true moonshot investment. As recently as March, the company's moon lander, Athena, couldn't pull off a stellar touchdown and its shares nosedived roughly 60%. Year to date, the stock is down 55%.
The startup is pioneering in a market that doesn’t quite exist yet at scale. Revenues are coming in phases, tied to contracts, with success as lumpy as a Moon crater. In a nutshell? It's a high-risk, high-reward kind of ride.
Still — if you're looking for an early, pure-play exposure to the Moon economy, Intuitive Machines, valued at just $1.5 billion, is basically as close as you can get.
🌟 Northrop Grumman NYSE:NOC : The Silent Space Titan
While Rocket Lab and Intuitive Machines get the Reddit buzz, Northrop Grumman keeps a low profile, winning contracts and building stuff that actually gets yeeted into space.
The company is deeply involved in NASA’s Artemis program, manufacturing boosters for the Space Launch System (SLS) — the rocket that’s supposed to return humans to the Moon. It also makes satellite systems, missile defense tech, and stealthy aerospace goodies for the US government.
Northrop isn’t going to quadruple overnight on a meme rally — it’s worth just under $70 billion. But it provides serious, steady exposure to the high-stakes space game — with dividends. It’s the choice for traders who like their moonshots with a side of mature risk management.
✨ Lockheed Martin NYSE:LMT : Space Cowboys in Business Suits
Lockheed Martin isn’t just the F-35 fighter jet company. It also builds the Orion spacecraft — NASA’s chosen ride for deep space missions, including Mars (if Elon doesn’t get there first).
Lockheed’s space division covers everything from weather satellites to missile warning systems. The company, worth around $111 billion, has been in the space race before Jeff Bezos came up with Blue Origin and way before Musk founded SpaceX.
Think of Lockheed like the expert-level astronaut: calm, collected, and still racking up mission hours while everyone else is learning which button not to press.
💫 Boeing NYSE:BA : Sometimes Up, Sometimes… Not So Much
Boeing’s Starliner capsule is supposed to ferry astronauts to the International Space Station. Supposed to. It’s been delayed more times than your average budget airline flight.
The astronauts that were stuck in space for nine months? Riding a Starliner that failed during docking (the mission was supposed to be a ten-day roundtrip). So Musk’s SpaceX had to intervene and bring those two space explorers back to earth in March.
Still, despite technical hiccups and PR headaches, Boeing remains heavily involved in the space economy. It builds rockets, satellites, and space station modules. Even when it trips, it trips forward — thanks to government contracts and industrial clout.
If you can stomach some turbulence, Boeing, worth $134 billion, offers another angle on the space trade.
🌙 RTX NYSE:RTX : Watching the Skies
You may not think "space" when you hear RTX (formerly Raytheon), but you should. The company builds sensors, satellites, and missile tracking systems — vital components of the US space and defense apparatus.
Space isn’t just about launching astronauts and rovers; it's about surveillance, communications, and security. RTX, valued at a whopping $168 billion, plays behind the scenes, helping make space a battlefield for signals, not soldiers.
Steady, profitable, and sneakily important, RTX is the stealth bomber of space stocks.
🪐 Other Orbit-Worthy Notables
Outside of the headliners, there’s a growing constellation of companies playing critical roles in space commerce:
Redwire NYSE:RDW : In-space manufacturing and tech solutions.
Blacksky Technology NYSE:BKSY : Real-time satellite imagery and analytics.
Virgin Galactic NYSE:SPCE : Richard Branson’s waning dream of space tourism, working to make suborbital flights a regular experience (careful, though, the stock is down 99.9% from peak).
☄️ Your Portfolio Doesn't Have to Stay on Earth
Space is no longer just a billionaire’s playground or a sci-fi dream. It's an investable theme — one that covers exploration, infrastructure, defense, data, and connectivity.
Sure, the sector is volatile. There will be delays, explosions (hopefully unmanned), stock swings, and moments where it all seems like an expensive science experiment. But there’s also real innovation, massive contracts, and a trillion-dollar economy forming right above our heads.
The thing is, while the biggest names in tech make the headlines and get daily coverage , you won’t see those space companies featured on the front page of big financial journals or covered in the weekly take of your financial podcast.
Traders who are serious about catching the big moves before they blast off should keep one tool close: the earnings calendar . These companies’ quarterly reports highlight progress, revenue, profit or loss figures, and present forward-looking guidance to act as a compass to traders and investors.
The economics of space isn’t just exciting because it’s shiny and futuristic — it’s exciting because the groundwork is being laid quietly, deal by deal, launch by launch. And the traders who are paying attention before the crowd shows up? They’re the ones best positioned for lift-off.
Your turn : Are you already investing in the space economy? Did we miss any names in there? Tell us — what’s your favorite way to reach for the stars? ✨🚀🌔
Stromm | S&P 500 & NASDAQ a RESISTANCE is NearThe S&P 500 and the Nasdaq are basically moving in lockstep right now — their structures look almost identical.
Starting with the S&P 500:
We’re currently trading into a 4-hour Fair Value Gap between $5,546 and $5,634, Sitting just under a 4-hour Order Block that could trigger a short-term reaction.
At the moment, though, it doesn’t really look like we’re going to flush all the way back down toward the $5,000 level (2-hour Order Block sitting much lower).
More likely?
This 4h Order Block just gives us a brief pullback, a minor reaction — and then price pushes higher again.
This would line up perfectly with my original scenario of Wave A completing around $4,805.
Personally, I’m already positioned around $4,800, so obviously, I'd love to see that level hold and price continue moving higher — ideally heading toward $6,000.
That would be the perfect extension — but nothing is guaranteed yet.
Still, structure right now leans bullish unless we see a sudden breakdown.
Now, for the Nasdaq CME_MINI:NQ1! :
Almost the same setup —
We have a 2-hour Order Block just above the current price, acting as short-term resistance,
And another 2-hour Order Block way lower, which now seems less likely to be tested unless something drastic happens.
So for the Nasdaq, the most realistic short-term scenario:
Hit resistance at the current 2h Order Block,
Maybe a small pullback toward 18,900–19,000,
Then continuation higher toward 20,000 or even 21,000 over the next few weeks.
US 500 Index – How Far Can the Recovery Extend?The upside recovery in the US 500 index continued last week, adding nearly 5% to close at 5523 on Friday, a 1 month high, as weak short positions continued to be squeezed out by a combination of factors, including signs that US/China trade relations may be starting to thaw out, President Trump pulling back on his initial commentary challenging Federal Reserve independence and more positive Alphabet earnings.
Now, looking forward to the week ahead, traders trying to work out where the index may move next face a number of scheduled economic data updates to digest and then react to, which will provide a health check on the US economy and labour market, while also showing the impact of President Trump's tariffs on US inflation.
These include,
* Tuesday 1500 BST US Consumer Confidence
* Wednesday 1330 BST US Preliminary Q1 GDP,
* Wednesday 1500 BST US PCE Index (Fed's preferred inflation gauge)
* Thursday 1500 BST ISM Manufacturing PMI Survey
* Friday 1330 BST US Non-farm Payrolls
Not only that, 4 of the Magnificent Seven companies also report earnings, with Microsoft and Meta results due after the close on Wednesday and Amazon and Apple due after the close on Thursday.
The outcome of all these events, plus trade war/tariff updates may well determine if the rally has already run its course, or has further to go.
Technical Update: Is the Break of Mid-Point (50%) Fibonacci Resistance Important?
Last week was a positive one for the US 500 index, as an 8.5% rally developed from Monday’s session low at 5095 into Friday’s high at 5530. This of course comes after what was an aggressive liquidation of assets into the April lows at 4799 (April 7th), and some may now be asking if this could be a sign of further attempts at price strength.
Much will of course depend on future market sentiment and price trends, but last week’s strength did see a closing break above the 5474 level, which is equal to the 50% Fibonacci retracement of the February to April 2025 price weakness.
This upside move may leave traders looking at the possibilities of further attempts at price strength this week and wondering where the next resistance levels may now stand.
Potential Resistance Levels:
A closing break of a 50% retracement while not a guarantee of further price strength, can suggest risks to higher levels and 5635, which is the higher 62% Fibonacci retracement could be the next resistance level to monitor.
If a further phase of price strength is to materialise, traders might now focus on closing defense of this 5635 resistance, with breaks higher possibly opening up potential tests of 5788, which marks the March 25th session high.
Potential Support Levels:
Of course, as we have said, the latest breaks of the 50% retracement resistance are not a sure sign of continued price strength. So, with that in mind, lets look at possible support levels that if broken, might point to the potential of downside pressure.
The 38.2% Fibonacci retracement of last weeks rally stands at 5364, so even if the new week starts with a price setback, this level may need to be broken on a closing basis to suggest risks of further price declines.
Such breaks lower could then point to a deeper decline and retracement towards 5313, the 50% level, even 5262, which is equal to the 62% retracement.
The material provided here has not been prepared in accordance with legal requirements designed to promote the independence of investment research and as such is considered to be a marketing communication. Whilst it is not subject to any prohibition on dealing ahead of the dissemination of investment research, we will not seek to take any advantage before providing it to our clients.
Pepperstone doesn’t represent that the material provided here is accurate, current or complete, and therefore shouldn’t be relied upon as such. The information, whether from a third party or not, isn’t to be considered as a recommendation; or an offer to buy or sell; or the solicitation of an offer to buy or sell any security, financial product or instrument; or to participate in any particular trading strategy. It does not take into account readers’ financial situation or investment objectives. We advise any readers of this content to seek their own advice. Without the approval of Pepperstone, reproduction or redistribution of this information isn’t permitted.
S&P 500 Analysis Ahead of the Busiest Week of Earnings SeasonS&P 500 Chart Analysis Ahead of the Busiest Week of Earnings Season
Despite the fact that President Trump’s earlier decision to impose tariffs (at higher rates than expected) shook the stock markets, the S&P 500 index (US SPX 500 mini on FXOpen) could still end April without significant losses (currently trading less than 2% below the month’s opening level) or even achieve a positive result.
According to media reports, around 180 S&P 500 companies are expected to release their quarterly earnings this week, including Apple (AAPL), Amazon (AMZN), Coca-Cola (KO), Eli Lilly (LLY), Meta (META), Microsoft (MSFT), and Chevron (CVX).
The share prices of these major companies — some of the largest by market capitalisation — could have a substantial impact on the S&P 500 index chart (US SPX 500 mini on FXOpen), given that their combined weight accounts for approximately a quarter of the index calculation.
Technical Analysis of the S&P 500 Chart
Based on the key price actions marked on the chart, we can identify a descending trend channel for the US stock market, which has been in effect since mid-February.
At the same time, the price has:
→ moved into the upper half of this channel, reaching its upper boundary;
→ found support around the median line (as evidenced by the price action on 21 April).
These are bullish signs, reinforced by the aggressive nature of the rebound from the psychological 5,000-point level, which acted as significant support in the first few days following the tariff announcement. Bears may still see an attractive opportunity to attempt to resume the downward momentum of the S&P 500 index (US SPX 500 mini on FXOpen), but will the fundamental backdrop support such a move?
From an optimistic perspective, sharp impulses driven by corporate news could lead to a breakout above the upper boundary of the red channel. This would likely be facilitated by important announcements (particularly from senior officials in the US, China, and Europe) regarding de-escalation of the tariff situation.
This article represents the opinion of the Companies operating under the FXOpen brand only. It is not to be construed as an offer, solicitation, or recommendation with respect to products and services provided by the Companies operating under the FXOpen brand, nor is it to be considered financial advice.
SPX: confusion will continueFinally some positive sentiment on the US equity markets. The S&P 500 marked a weekly gain of 4,6%, while investors are waging the relaxation of the ongoing trade tariffs war. Regardless of estimates of the future impact of imposed tariffs, the US tech companies are still posting relatively good results. The S&P 500 ended the week at the level of 5.525, which was the market low in March and beginning of April this year.
Alphabet gained 1,5% during the week, on the wings of posted relatively good results above estimates. Other big tech companies were also supported, like Tesla, Nvidia and Meta. Only on Friday, Nvidia gained 4,3%, while Tesla advanced by 9,8% within one day. Regardless of positive weekly results, it is still not time to celebrate. The news regarding trade tariffs coming from the US Administration still continues to be mixed, bringing a high level of confusion among market participants. In this sense, it could be expected that volatility on the equity markets will continue also in the future period.
SPX500 I Bearish Drop Based on the H4 chart analysis, we can see that the price has just reacted off our sell entry at 5522,70, which is an overlap resistance.
Our take profit will be at 5371.29, an overlap support level.
The stop loss will be placed at 5685.38, which is an overlap resistance level.
High Risk Investment Warning
Trading Forex/CFDs on margin carries a high level of risk and may not be suitable for all investors. Leverage can work against you.
Stratos Markets Limited (tradu.com):
CFDs are complex instruments and come with a high risk of losing money rapidly due to leverage. 63% of retail investor accounts lose money when trading CFDs with this provider. You should consider whether you understand how CFDs work and whether you can afford to take the high risk of losing your money.
Stratos Europe Ltd (tradu.com):
CFDs are complex instruments and come with a high risk of losing money rapidly due to leverage. 63% of retail investor accounts lose money when trading CFDs with this provider. You should consider whether you understand how CFDs work and whether you can afford to take the high risk of losing your money.
Stratos Global LLC (tradu.com):
Losses can exceed deposits.
Please be advised that the information presented on TradingView is provided to Tradu (‘Company’, ‘we’) by a third-party provider (‘TFA Global Pte Ltd’). Please be reminded that you are solely responsible for the trading decisions on your account. There is a very high degree of risk involved in trading. Any information and/or content is intended entirely for research, educational and informational purposes only and does not constitute investment or consultation advice or investment strategy. The information is not tailored to the investment needs of any specific person and therefore does not involve a consideration of any of the investment objectives, financial situation or needs of any viewer that may receive it. Kindly also note that past performance is not a reliable indicator of future results. Actual results may differ materially from those anticipated in forward-looking or past performance statements. We assume no liability as to the accuracy or completeness of any of the information and/or content provided herein and the Company cannot be held responsible for any omission, mistake nor for any loss or damage including without limitation to any loss of profit which may arise from reliance on any information supplied by TFA Global Pte Ltd.
The speaker(s) is neither an employee, agent nor representative of Tradu and is therefore acting independently. The opinions given are their own, constitute general market commentary, and do not constitute the opinion or advice of Tradu or any form of personal or investment advice. Tradu neither endorses nor guarantees offerings of third-party speakers, nor is Tradu responsible for the content, veracity or opinions of third-party speakers, presenters or participants.
$SPX Sell in May, Go Away, $5k, Dead Cat to $5.3k, $4.8k by EOMAlrighty. My forecast is as follows. I made a video explaining just a quick thought and here's the video in a written version for the most part. Basically, I'm a pattern chart trader and I spend the majority of my days looking for specific candlestick patterns that match candle for candle. I cannot find anything remotely close to today's Price Action besides October 2001. I have been and will continue to be doubted and that's okay. I am not here for anyone except myself and anyone that wants to gain a fresh unbiased perspective. People have called me a Permabear but that only pertains to my personality, which is that of a realist. I do not believe investing for the next 20-50 Years will work for everyone. You'd have to do it well and continuously contribute even during the down days. Either way. This is the analog I will be following. Fib is Extended way beyond Blow Off Top measurements imo. The market gained 50% in One Year and Three Months. I'd like to think that the uncertainty being priced in will cause these Deeper Fib Retracements. We already crashed down to the 1.61 GOLDEN POCKET from above and now bounce back to Secon Golden Pocket at 2.61. Based on the past behavior, now we move back to 2.0 for a move to the original extension of the 1.00 Fib. If we lose this, we start moving back to the 1.27 near $4.74k on SPX where I will then be looking for one final dead cat to $5300 by mid August, Every July dip being grabbed up ... Final Sell in August for an End of Year Crash to Mark 2025 as one of the worst years ever in Life as far as the Market goes. Good Luck everyone. Tips always welcome.
S&P 500: Key Levels and Potential ScenariosThis analysis of S&P500 will explore both bullish and bearish scenarios, incorporating key levels and considering possible market and crowd psychology.
Bullish Scenario: Potential Uptrend Resumption
From a bullish perspective, if the S&P 500 maintains a position above the 5482 level, it could suggest a potential end to the current correction and a resumption of the major uptrend. A hold above 5482 might reinforce bullish sentiment, encouraging further buying activity, as traders may view this as confirmation of renewed strength. The index could then potentially retest the 5801 level, where it's possible that the index may encounter resistance on the first attempt. A successful break above 5801 would then open the path towards the 6135 zone, which represents a key upside target.
Bearish Scenario: Potential Retest of Support Zones
Conversely, if the S&P 500 fails to hold above the 5482 support level might trigger increased selling pressure, as traders liquidate positions. The index could then potentially retest the 5092 to 4833 support zone. This zone represents a critical area where buyers may step in, but a break below it would signal further weakness.
Concluding Remarks
In conclusion, the S&P 500's price action around the identified key levels will be crucial in determining its short- to medium-term direction. A sustained hold above 5482 could favor a bullish continuation towards 5801 and potentially 6135, while a break below 5482 might lead to a retest of the 5092 to 4833 support zone.