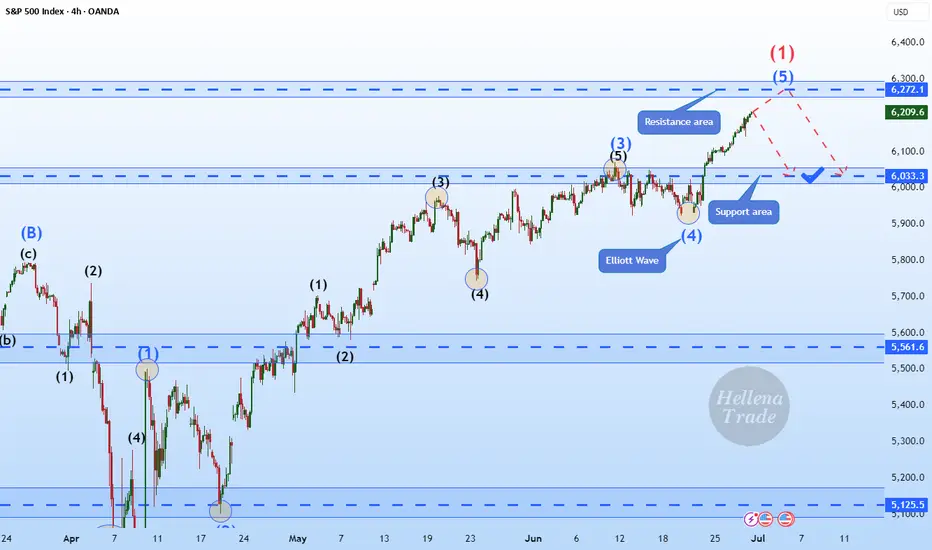
Hellena | SPX500 (4H): SHORT to support area of 6033.Colleagues, I assume that wave “1” completes the upward movement and somewhere around here a major correction ‘2’ should begin, which will consist of waves “ABC” and may continue to the level of 5700. But for now, I think we need to focus on the nearest targets.
I see the support area of 6033 as the first target.
Manage your capital correctly and competently! Only enter trades based on reliable patterns!
US500AUD trade ideas
Bullish continuation?S&P500 (US500) is falling towards the pivot which acts as a pullback support and could bounce to the 1st resistance, which aligns with the 161.8% Fibonacci extension.
Pivot: 6,127.80
1st Support: 5,785.00
1st Resistance: 6,428.64
Risk Warning:
Trading Forex and CFDs carries a high level of risk to your capital and you should only trade with money you can afford to lose. Trading Forex and CFDs may not be suitable for all investors, so please ensure that you fully understand the risks involved and seek independent advice if necessary.
Disclaimer:
The above opinions given constitute general market commentary, and do not constitute the opinion or advice of IC Markets or any form of personal or investment advice.
Any opinions, news, research, analyses, prices, other information, or links to third-party sites contained on this website are provided on an "as-is" basis, are intended only to be informative, is not an advice nor a recommendation, nor research, or a record of our trading prices, or an offer of, or solicitation for a transaction in any financial instrument and thus should not be treated as such. The information provided does not involve any specific investment objectives, financial situation and needs of any specific person who may receive it. Please be aware, that past performance is not a reliable indicator of future performance and/or results. Past Performance or Forward-looking scenarios based upon the reasonable beliefs of the third-party provider are not a guarantee of future performance. Actual results may differ materially from those anticipated in forward-looking or past performance statements. IC Markets makes no representation or warranty and assumes no liability as to the accuracy or completeness of the information provided, nor any loss arising from any investment based on a recommendation, forecast or any information supplied by any third-party.

Little more upside for SPX500USDHi traders,
Last week SPX500USD went higher then expected (wavecount updated).
If this is correct, then next week we could see a little more upside for this pair.
Let's see what the market does and react.
Trade idea: Wait for price come into the Daily bullish FVG's to trade longs again. At the moment price is too high to trade.
If you want to learn more about trading FVG's & liquidity sweeps with Wave analysis, then please make sure to follow me.
This shared post is only my point of view on what could be the next move in this pair based on my technical analysis.
Don't be emotional, just trade your plan!
Eduwave

S&P 500 and the Elliott Wave TheoryAnalysis shows that the Wave 3(Black) correction is a Flat because Wave 2(Black) was a Zigzag. From the ending of Wave 3(Black), we see a shallow Wave A(Blue) forming. This is our first Wave of the 3 move correction. From A(Blue), another 3 wave move MUST occur and must go beyond the ending of Wave 3(Black) as seen. The correction of Wave A(Blue) is marked by an unfolding 3 wave move shown in Green. Waves A and B are formed after Wave A(Blue) completes. For the last 'leg' of the 3 Wave correction, we find a 5 Wave move shown in Red and this should contain all properties of a normal 5 wave move. Wave 1(Red) is followed by a Zigzag correction and we should expect a Flat correction at Wave 3(Red). Indeed a Flat is formed and is highlighted in Purple. Wave 4(Red) is complete. This sets in motion a last wave that upon completion would be the end of Wave C(Green) hence the end of Wave B(Blue) and would trigger the start of Wave 4(Black). Follow for breakdown of the same chart in the Daily time frame.

SPX Expansion with Historical DataGood morning everyone!
This week I wanted to elaborate more on my previous idea of SPX with the historical data that led to this analysis. This is almost all fundamental analysis adding in the retracement percentages which can also be evaluated through some technical instruments.
Unemployment rate is currently at 4.1%, with inflation at 2.4%. Based on the data, it is evident the market is currently in an expansion period which is why the narrative that we will see 2 interest rate drops by the end of year continues to diminish. I think we will probably see 1 before the year ends and that would just fuel the market and gain momentum to the upside.
If we were to measure the expansion of SPX going back to the 2000's, we get an extension of at least 75%. If we were to extend 75% based on the previous swing high (6,147) we could see future SPX price at 8,500. Now, do your own research, but the data is here. I expect the market to possibly retest previous high, but if you did not enter during the dip, no worries. There is still plenty of upside potential and better late than never.
Remember... CASH FLOW IS KING!
Avoid all the noise and distractions. The job of many platforms out there is to have something to put out for the public EVERYDAY! A good amount of that is noise. Look for macroeconomic news and let that be your indicator.
Historical Data:
(1) .com Bubble (2000 - 2002) We had a 50% drop of SPX. This lasted for almost 2 years before recovery.
(2) Housing Market (2007 - 2009) The SPX dropped 57% due to the collapse of subprime lenders collapsing. Housing prices decline drastically leaving people with high mortgage payments than what their homes are actually worth leading to a wave of foreclosures.
(3) Covid (2020) This was a global event with government mandated shutdowns causing the entire financial markets to come to a halt. Many business closures that led to jobs loss with an unemployment rate of approximately 15%.
(4) Inflation & Rate Hikes (2022) When Covid happened, upon recovery market expanded way too fast causing inflation to rise and the Feds to increase interest rates to slow down the economy.
(5) Tariffs (2025) Will stay away from politics on this one, however, a rebalancing of trade has taken place with some countries still working on tariff deals with the U.S. This has caused huge uncertainty for companies and corporation. VIX (fear index) reached 60.13.
Hope you enjoyed this post. Have a great rest of your week, don't forget to like and follow and Happy Trading!

Gold Bullish for 2 months followed by 3 months of Bearish?An interesting pattern developed on Gold for the monthly that could indicate 2 months of Bullish order flow to 3600 - 3800 area followed by 3 months of bearishness to 3000 - 3100 area.

Let’s talk about technical analysis & stops.Technical analysis is not your decision-making process — it’s a tool to help you structure better trading decisions by studying past price movements to anticipate likely future moves.
👉 Every time you look at a chart, you should decide:
✅ Do I want to trade at all?
✅ What’s my entry?
✅ Where’s my stop (when does my thesis fail)?
✅ What’s my target (where will I take profits)?
________________________________________
🛑 Where to put your stop?
Take the S&P 500 daily chart. It’s been trending up strongly. Many traders use an exponential moving average (EMA) as a dynamic stop.
But:
• A 9 EMA often stops you out too early on strong trends.
• Adjusting to a 15 or 16 EMA could keep you in the trade longer, letting your winners run.
In tools like TradingView, you can visually adjust the EMA and see in real time how it would have kept you in or taken you out.
________________________________________
💡 Key takeaway:
When price closes below your EMA stop — that’s your signal to exit and lock in profits.
Use TA to structure your trades, not just spot pretty patterns.
________________________________________
💬 What’s your favourite method for setting stops?
Disclaimer:
The information posted on Trading View is for informative purposes and is not intended to constitute advice in any form, including but not limited to investment, accounting, tax, legal or regulatory advice. The information therefore has no regard to the specific investment objectives, financial situation or particular needs of any specific recipient. Opinions expressed are our current opinions as of the date appearing on Trading View only. All illustrations, forecasts or hypothetical data are for illustrative purposes only. The Society of Technical Analysts Ltd does not make representation that the information provided is appropriate for use in all jurisdictions or by all Investors or other potential Investors. Parties are therefore responsible for compliance with applicable local laws and regulations. The Society of Technical Analysts will not be held liable for any loss or damage resulting directly or indirectly from the use of any information on this site.

SPX: highly optimisticThe US market celebrated on Friday the US Independence Day, after highly optimistic last two weeks. Almost every day, the S&P 500 was reaching new all time highest levels, finishing Thursday trading session at 6.279. At this moment this is officially treated as a new ATH for the index. The optimism was supported by better than expected US jobs data posted during the previous week. The NFP added 147K new jobs in June, which beated market expectations. The strong US payrolls reinforced market confidence despite concerns over trade tariffs. With inflation remaining sticky and solid jobs growth, markets have increased expectations of the Fed's rate cut in September. Currently, there is relatively low odds that the next rate cut might occur at the Julys FOMC meeting.
Tech companies were again those who led the index to the upside. The leader was for one more time Nvidia, with a weekly surge of 9,7%. AMZN was traded higher by 6,3%, MSFT by 3,9%. TSLA was struggling a bit, ending the week 0,33% higher from the week before.
Weekly news regarding trade tariffs include a US-Vietnam trade deal of 20% tariffs on imports from Vietnam. At the same time, the US exports to Vietnam will be tariffs-free. However, markets are still concerned regarding the final resolution of imposed 90-days delay of implemented tariffs for almost 180 countries around the world, a period which expires in July. On the other hand, Trump's tax mega bill was passed by the US Senate on Tuesday, and is currently awaiting final approval from the House. There were many discussions during the previous period that this tax mega bill might further increase US debt levels, which will be negatively reflected in the economy.

Dummy ideaFastest Way to Create an Idea on TradingView
Here’s a step-by-step guide to quickly publish an idea (analysis, chart, or setup) on TradingView:
1. Prepare Your Chart
• Open TradingView and set up your chart with all desired indicators, drawings, and timeframes.
2. Open the Publish Idea Window
• Shortcut: Press `Alt + P` on your keyboard to instantly open the “Publish Idea” window.
• Or: Click the Publish button at the top-right corner of your chart.
3. Fill Out the Required Fields
• Title: Enter a clear, descriptive title for your idea.
• Description: Write a brief explanation of your analysis or setup.
• Category: Select the appropriate category (e.g., Analysis, Tutorial).
• Direction: Mark your idea as Long, Short, or Neutral.
• Privacy: Choose Public or Private.
• (Optional) Add tags and related ideas for better visibility.
4. Publish
• Confirm you agree to the House Rules.
• Click Publish Idea.

SPX to 7450?Looking at the long term chart starting from the covid crash we can see 2 impulse of average 2650 pts and two retracement, so from the trump crash to 4800 we could see one last bullish impulse of around 2650 pts to target 7450 in autumn.
Now I expect a retracement to 5965-5970 area before last bullish impule

S&P 500 Daily Chart Analysis For Week of July 3, 2025Technical Analysis and Outlook:
During this abbreviated trading week, the S&P 500 Index has primarily shown an upward course, hitting and surpassing our target for the Outer Index Rally of 6235. Currently, the index demonstrates a consistent bullish trend, with the following objective for the Outer Index Rally set at 6420, followed by forthcoming targets of 6620 and 6768. Nevertheless, it is crucial to acknowledge the current price action may cause prices to retrace from their current fluctuation to test the Mean Support at 6200 before resuming their upward movement.

SPX : Next Stop @ 6800 :-)Since we are now expecting a delay in the FED cutting, there will be plenty of liquidity to spice things up.
The 'D' @ yellow had worked once before and since it has been 'used up' , its potency had been somewhat reduced.
But have no fear/worry, there would always be more 'D' ahead. The next one at 6,800
Good luck.

SPX500 Holds Above 6,225 – Bullish Trend Intact for NowSPX500 Update – Bullish Pressure Holds Above Pivot
SPX500 continues to show bullish momentum, as highlighted in our previous analysis. The price remains supported by strong buying volume above the key pivot zone at 6,225.
As long as the price stays above this level, a retest toward 6,225 remains possible before another leg higher.
However, a confirmed break below 6,225 would signal potential bearish momentum and shift the short-term structure.
Key Levels:
• Pivot Line: 6,246
• Resistance: 6,265 / 6,287 / 6,325
• Support: 6,225 / 6,191 / 6,143

S&P 500 Hit Record High Ahead of Holiday BreakS&P 500 Hit Record High Ahead of Holiday Break
Today, financial markets in the United States are closed in observance of Independence Day. Investor sentiment was likely buoyed by the latest rally in the S&P 500 index (US SPX 500 mini on FXOpen), which set a new all-time high yesterday, surpassing 6,280.
The bullish momentum has been driven by robust labour market data in the US. According to ForexFactory, analysts had anticipated a rise in the unemployment rate from 4.2% to 4.3%, but instead, it unexpectedly declined to 4.1%.
Can the stock market continue to climb?
Technical Analysis of the S&P 500 Chart
Analysing the 4-hour chart of the S&P 500 index (US SPX 500 mini on FXOpen)on 30 June, we observed the following:
→ An ascending channel was formed (indicated in blue);
→ A developing bullish impulse (marked with an orange line) suggested the price would move towards the upper boundary of the channel – a scenario that materialised with yesterday’s rally (as shown by arrow 1).
However, from a price action perspective, the recent downward move (arrow 2) has now gained significance. It may indicate that sellers are becoming more active around the identified resistance level.
Should the price decline towards the lower orange line, this could negate the current bullish impulse altogether, effectively reflecting a classic bearish engulfing pattern.
Given the above, there is reason to believe that bears are attempting to regain control after the S&P 500 (US SPX 500 mini on FXOpen) surged over 5% in the past 10 days. As such, a potential breakout below the orange line cannot be ruled out, with price action possibly targeting the median of the blue ascending channel.
What happens next?
The market’s trajectory will largely hinge on developments related to tariffs. Trade policy will remain in the spotlight next week, as key deadlines set by the White House approach — events that traders will be closely monitoring.
This article represents the opinion of the Companies operating under the FXOpen brand only. It is not to be construed as an offer, solicitation, or recommendation with respect to products and services provided by the Companies operating under the FXOpen brand, nor is it to be considered financial advice.

SP500 rock & roll with Trump.. 4/July/25SPX500 breaking ATH again are we in bullish stage? Or again Donald Trump "Inviting" us come to his WWE stage for his favourite "wrestling" games.. Jumping up and down or up side down.( expanding triangle) ......

S&P 500 ($SPX) Nests Upward in Strong RallySince bottoming out on April 7, 2025, following the tariff war selloff, the S&P 500 (SPX) has sustained a robust rally. The Index is reaching new all-time highs in a clear Elliott Wave impulsive structure. Technical analysis, particularly momentum indicators like the Relative Strength Index (RSI), shows no divergence at the latest peak. This indicates sustained bullish momentum and suggests the rally remains within the third wave of the Elliott Wave sequence. From the April 7 low, wave 1 concluded at 5968.6. A corrective wave 2 followed which ended at 5767.41. The index has since nested higher within wave 3, demonstrating strong upward momentum.
Breaking down the substructure of wave 3, the hourly chart below reveals that wave ((i)) peaked at 6059.4. The subsequent pullback in wave ((ii)) unfolded as a zigzag pattern. Wave (a) declined to 5963.21, and wave (b) rebounded to 6050.83. Wave (c) concluded at 5941.4, completing wave ((ii)) in the higher degree. The index has since resumed its ascent in wave ((iii)). Up from wave ((ii)), wave (i) reached 215.08 and a minor pullback in wave (ii) ended at 6177.97.
The SPX is expected to continue its upward trajectory, with potential pullbacks finding support in a 3, 7, or 11 swing against the 5941.4 level, setting the stage for further gains. This analysis underscores the index’s bullish outlook, supported by technical indicators and Elliott Wave structure, as it navigates higher within this impulsive cycle.

USA Economy Long-Term Outlook:The long-term outlook for the U.S. economy , as of mid-2025, is characterized by several key factors and some uncertainty, particularly around tariffs and monetary policy.
GDP Growth: The U.S. economy experienced a contraction in Q1 2025 (down 0.2-0.5% GDP), the first in three years, partly due to a surge in imports and a sharp cutback in consumer spending. Economists anticipate a bounce back in Q2 2025 (forecasted at 3% growth). However, the overall expectation for 2025 is for growth to decelerate significantly (e.g., Vanguard projects 1.5% GDP growth for year-end 2025, EY forecasts 1.5%, Trading Economics 1.7%, J.P. Morgan 2.1%). The second half of 2025 is expected to see a "pronounced demand cliff" due to front-loaded purchases ahead of anticipated trade restrictions.
Inflation: Tariffs are a significant factor impacting inflation. CPI growth is expected to average around 2.9% in 2025 and potentially accelerate to 3.2% in 2026, moderating to around 2.3% by 2029 (Deloitte). Core PCE inflation is expected to climb to the 2.8-3.0% range year-over-year in Q3 2025 - Q3 2026 as tariffs filter through the economy (University of Michigan). The Federal Reserve is closely watching tariff-induced price spikes.
Interest Rates/Monetary Policy: The Federal Reserve is likely on hold with interest rates for now, but two more rate cuts are anticipated later in 2025 if the labor market remains stable (Vanguard). Some forecasts suggest the Fed will resume cutting rates in July 2025, reaching a terminal range of 3.25-3.5% by mid-2026 (University of Michigan). However, the uncertainty around tariffs and their impact on inflation could influence the Fed's decisions.
Labor Market: The labor market has been cooling but remains stable. The unemployment rate is expected to increase throughout 2025, potentially reaching 4.3% (Morningstar), 4.7% (Vanguard), or even 4.8% by year-end (EY). Job gains are predicted to decelerate significantly in the second half of 2025 due to tariffs.
Tariffs: Tariffs are a major source of uncertainty. While some recent de-escalation in trade policy with China has led to positive revisions in the outlook, the long-term impact of tariffs remains a concern, with potential to lower GDP growth, raise inflation, and weaken the labor market. The expectation is that tariffs will be at least modestly higher than at the start of 2025.
In essence, the long-term economic forecast for the USA suggests continued growth, but at a more moderate pace than recent years, with ongoing vigilance required for inflation and labor market dynamics, heavily influenced by evolving tariff policies.

Major resistance level for the S%P 500the s and p 500 have been on an uptrend but reems some correction might take place soon

Nonfarm Payroll and some other news 03.07.2025Nonfarm Payrolls surprisingly turned out to be moderate. These are excellent arguments for the Fed not to touch the rate, since labor market is their main mandate along with inflation.
At the same time, stock market is showing steady growth and overheating in some places.
What should the US economy be saved from by lowering the Fed rate?
From Trump's future decisions, or create an influx of liquidity for a good picture so that Trump can further report on GDP growth?
These questions should be asked by engaged Fed chairman.
At 5:00 PM, an interesting ISM services report was released: the growth of new orders against background of falling employment immediately makes us wonder why then such a level of applications to Nonfarm.
The answer is simple, Elon Musk fired a lot of employees during his short career in the White House.

S&P500: Once it breaks the 1W MA50, it doesn't look back.S&P500 has turned overbought on its 1D technical outlook (RSI = 75.570, MACD = 96.940, ADX = 23.950) and rightly so as it is extending the rally after crossing above the 1W MA50. The Channel Up since late 2011 shows that when the index crosses above its 1W MA50, it tends to spend a notable time over it (and every contact is a buy opportunity), with the most recent example being the March 2023 - December 2024 period. The shortest such period has been in 2019, which was suddently disrupted by the black Swan event of COVID. We may have gotten out of a similar situation as Trump's tariffs disrupted the uptrend earlier this year with a huge, unexpected correction. There 1W MA200 supported and this brings us to a new 'above the 1W MA50 bullish phase', which even if it is as short as 2019, it can still target 7,000.
See how our prior idea has worked out:
## If you like our free content follow our profile to get more daily ideas. ##
## Comments and likes are greatly appreciated. ##

SPX500 at New ATH – Will NFP Fuel the Next Leg Up? SPX500 Outlook: Trade Optimism Fades as Focus Shifts to U.S. Jobs Data
Caution prevails ahead of today’s high-impact U.S. Nonfarm Payrolls report, which could be pivotal for the July rate cut narrative. A weaker print may support risk assets and push SPX500 higher, while a strong report could dampen momentum.
Technical Analysis (SPX500):
SPX500 has printed a new all-time high and is now targeting 6287, especially if the index closes above 6246 on the 1H chart.
As long as price holds above 6225 (pivot), the bias remains bullish, with potential upside targets: 6287 & 6325
However, a 4H close below 6213 would suggest a correction toward: 6190 & 6143
Key Levels:
• Resistance: 6287 / 6325
• Support: 6190 / 6143
Stay alert — today's NFP report could trigger major moves across indices and FX.

July Doesn't Disappoint - S&P Nasdaq Dow Russell All RunningS&P All Time Highs
Nasdaq All Time Highs
Dow Jones closing in on All-Time Highs (and outperforming both S&P and Nasdaq recently)
Russell 2000 playing catch up and moving higher
This is melt-up at its finest
Since US/China Trade Agreement and Middle East Ceasefire Agreement, markets have used
these two events as further catalysts to continue the upside runs
Stochastic Cycle with 9 candles suggesting a brief pause or pullback in the near-term, but
a 3-5-10% pullback is still an opportunity to position bullish for these markets
I'm only bearish if the markets show that they care with price action. The US Consumer isn't breaking. Corporate Profits aren't breaking. Guidance remains upbeat. Trump is Pro Growth and trolling Powell on the regular to run this economy and market HOT demanding cuts (history says that's a BUBBLE in the making if it's the case)
Like many, I wish I was more aggressive into this June/July run thus far, but I'm doing just fine with steady gains and income trades to move the needle and still having plenty of dry powder
on the sidelines for pullbacks
Markets close @ 1pm ET Thursday / Closed Friday for 4th of July
Enjoy the nice long weekend - back at it next week - thanks for watching!!!

Acorn's Smart Money S&P SignalJuly 2, 2025 - S&P broke to the upside confirming a bullish S&P signal. If correct, the bullish S&P indicator suggests the S&P will close above 6177.97 on July 17. Let’s see if the market can continue to the upside!
