SPX500As on NASDAQ100 Analysis, seeing a shorting position herein as well, for a fair drop to the recent demand zone and QML levels, sort of skewed Head and Shoulder pattern unfolding due to give the second bearing shoulder.
US500FU trade ideas

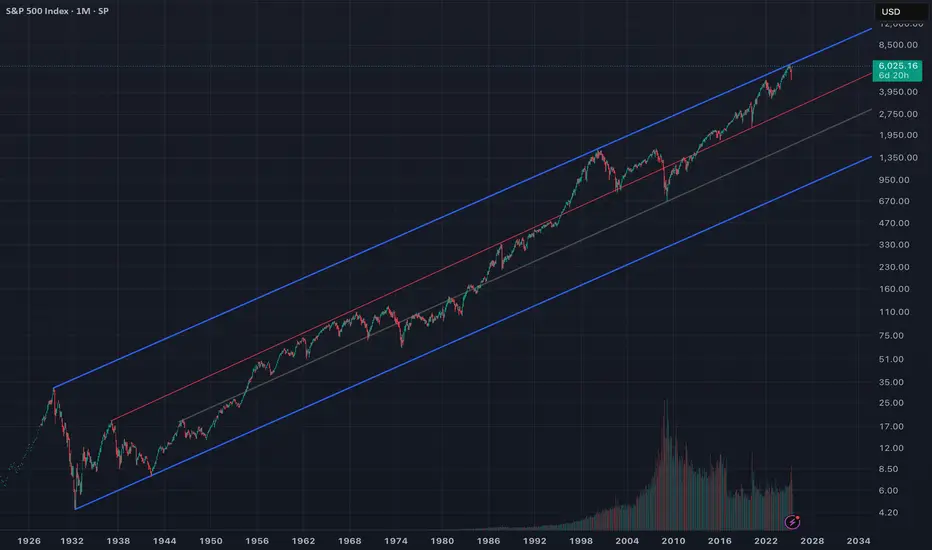
🇺🇸 America at the Crossroads: Golden Age or Great Reset? As the S&P 500 crosses 6,000 , investors celebrate yet another all-time high. But beneath the surface of this rally lies an uncomfortable truth: we are standing at a national and market inflection point.
This isn’t just another leg up. This is the top of a century-long trend channel, a moment where all prior historical peaks have led to sharp reversion . Will this time be different?
📉 Or are we heading into the final blow-off top of a fiat-fueled bull market ?
📈 Or is this the birth of a new nominal supercycle — a “Golden Age” driven by AI, deglobalization, and fiscal firehoses?
📊 The Chart That Frames the Future
This chart stretches back to 1926. Price now presses against the upper blue boundary , just like in:
1929 → Great Depression
2000 → Dot-com Crash
2021 → Post-COVID Inflation Panic
Every previous touch has ended in multi-year mean reversion . Will we now break out — or break down?
🕰️ The Fiat Currency Clock Is Ticking
“The average lifespan of a fiat currency is 80–100 years.”
The U.S. defaulted on gold bonds in 199 and the U.S. dollar was untethered from gold in 1971. We're many years into a fiat system. Every fiat regime in history has collapsed under debt, inflation, and loss of confidence .
📉 K-Shaped Economy and the Strained Consumer
Since 2008, monetary policy has disproportionately enriched capital holders. Asset owners got rich. Wage earners stagnated.
Now we see:
-Record-high credit card interest
-Rising consumer delinquencies
-Real wages trailing inflation
This is not a healthy economy — it’s a two-speed system with widening fractures.
📈 The Most Expensive Market in History?
CAPE Ratio : ~33x — rivaling 1929 and 2000
ZIRP is gone , yet valuations remain elevated
Investors are pushed out the risk curve by low real bond yields
This is the result of TINA (There Is No Alternative) — but that narrative is fragile.
🏦 Cracks in the Core: Treasuries and Liquidity
The U.S. Treasury market is flashing red:
Weakening auction demand
Foreign buyers (like China, Japan) stepping back
Bank of Japan may be forced to liquidate U.S. debt
Liquidity is thinning — just like in 2007
🤖 AI and the Accelerating Wealth Gap
AI is a double-edged sword:
It boosts productivity
But it eliminates mid-skill jobs
It consolidates wealth into a few mega-cap tech monopolies
And it strains an already outdated energy grid
AI could fuel inequality and fragility .
🌍 End of Globalization and Rise of BRICS
The BRICS alliance is actively challenging dollar hegemony
Trade is shifting to commodity-backed and bilateral settlement
U.S. foreign policy is being stress-tested on multiple fronts (Ukraine, Taiwan, Middle East)
The post-WWII order is unraveling. And America must adapt — or lose ground.
⚠️ Blow-Off Top Before the Storm?
This market feels like a blow-off top :
Narrow breadth
Retail mania
AI euphoria
Massive fiscal deficits
All-time high valuations
Next step? A potential deflationary bust , followed by a stimulus-fueled inflationary wave — especially in energy and commodities.
⚡ Power Grid Risk in an Electrified World
AI and EVs demand **enormous energy inputs**. But:
U.S. grid is **underdeveloped**
Transmission infrastructure is outdated
Blackouts are increasing
China, meanwhile, has been quietly building resilient grid systems for over a decade taking advantage of Nuclear, while The U.S. risks falling behind.
🌀 The Fourth Turning: Crisis as Catalyst
“History doesn't repeat itself, but it often rhymes.” – Mark Twain
According to Fourth Turning theory, we are nearing the climax of a ~100-year generational cycle — a period marked by institutional breakdown, global conflict, and radical transformation. Each cycle contains four “turnings,” and we are now deep into the fourth: the Crisis phase.
The current Fourth Turning began in 2008 with the Global Financial Crisis. It is expected to resolve sometime between 2025 and the early 2030s — a period of upheaval that mirrors previous turning points such as:
The Great Depression & World War II (1929–1946)
The American Civil War (1861–1865)
The Revolutionary War (1775–1794)
As Neil Howe writes in The Fourth Turning Is Here (2023):
“Each Fourth Turning is a time of radical disruption — a time when an old order is replaced by a new one, often through war, collapse, or revolution. ”
Today, we face:
Political polarization at generational extremes
Sovereign debt levels previously only seen during world wars
Eroding trust in media, financial institutions, and government
Technological upheaval via AI and automation
Geopolitical flashpoints from Ukraine to Taiwan
The market, the dollar, and our political system are not outside this cycle — they are central to it.
The question is no longer whether we are in a transformation, but:
What kind of world will emerge on the other side?
🚧 The Fork in the Road: Two Futures
We stand at a fork in the road — not just for markets, but for **America’s future**:
🟢 Path 1: The Breakout – Golden Age
AI revolution supercharges GDP
Commodities rise but wages lag
Treasury/Fed normalize debt via inflation
S&P and assets soar in **nominal terms**, even if real value lags
🔴 Path 2: The Reversion – Great Reset
Credit cycle breaks
Liquidity vanishes
Markets mean revert 40–60%
Global capital flees to safety
🧠 Final Thought: Don’t Chase the Top
“At the top of a long-term channel, humility is a better strategy than hubris.”
Now is not the time to blindly chase momentum. Whether we break out or break down, the risks are rising — and history offers few second chances after peaks like this.
We stand not only at a technical inflection, but at a civilizational one.
The Fourth Turning is reaching its apex, and markets are reflecting that tension — between collapse and rebirth, between order and entropy.
📌 Hedge.
📌 Diversify.
📌 Prepare.
Because one way or another, America is crossing a threshold — and there’s no going back.
S&P 500 Wave Analysis – 23 June 2025- S&P 500 reversed from support area
- Likely to rise to resistance level 6065.00
S&P 500 index recently reversed from the support area between the support level 5930.00 (which reversed the price multiple times from the start of June) and the 50% Fibonacci correction of the sharp upward impulse 1 from last month.
The upward reversal from this support area stopped the previous minor ABC correction 2 from the start of June.
S&P 500 index can be expected to rise to the next resistance level 6065.00 (which stopped the previous minor impulse wave 1).

THE END SNP MEGA DUMPThe chart speaks for itself brace yourself for a huge crash in the market either take advantage of options or trade via CFD or leverage play on other stocks either way make money from this epic crash 💥

SOARING 20's are you ready for the Blowoff of the century#SPX v Currency in circulation
#Cup&Handle
1929 Echo bubble
AI will increase earnings and GDP
as ASI enters the workplace and Robotics grow us out of Debt
GDP = Number of people * Productivity
Now add an autonomous workforce to this.

S&P500 calm reaction to geopolitical riskGeopolitics:
The US launched airstrikes on Iran, raising global tensions. Iran has vowed to retaliate, and Israel isn’t backing down. Trump warned of more action if Iran doesn’t make peace. The US issued a global travel alert, airlines are avoiding the Gulf, and Japanese banks may pull staff from the region. Oil is in focus, especially with tankers avoiding the Strait of Hormuz.
Markets:
Reactions were calm overall. The US dollar gained, oil prices rose briefly, and stock futures were mixed as investors waited to see what Iran does next.
Corporate News:
BNY Mellon is reportedly in talks to merge with Northern Trust, which could lead to a major deal in the banking sector.
Tesla launched its first robotaxi service in part of Austin, aiming to spark new growth after a sales slump.
Key Support and Resistance Levels
Resistance Level 1: 6018
Resistance Level 2: 6043
Resistance Level 3: 6070
Support Level 1: 5910
Support Level 2: 5870
Support Level 3: 5845
This communication is for informational purposes only and should not be viewed as any form of recommendation as to a particular course of action or as investment advice. It is not intended as an offer or solicitation for the purchase or sale of any financial instrument or as an official confirmation of any transaction. Opinions, estimates and assumptions expressed herein are made as of the date of this communication and are subject to change without notice. This communication has been prepared based upon information, including market prices, data and other information, believed to be reliable; however, Trade Nation does not warrant its completeness or accuracy. All market prices and market data contained in or attached to this communication are indicative and subject to change without notice.

SPX500: Bearish Momentum Below 5966, Bullish Recovery Above 6010SPX500 – Technical Overview
SPX500 is currently exhibiting bearish momentum, largely driven by escalating tensions in the Middle East, which are contributing to heightened market volatility.
At present, the price is approaching the pivot level at 5966. A confirmed 1-hour candle close below this level would likely reinforce the bearish bias, targeting 5938, and potentially extending the decline toward 5902 and 5858.
However, if the price stabilizes above 5990, we may see a retest of the 6010 resistance. A breakout above this level would shift the momentum toward the upside, with further targets at 6041 and 6098.
Key Levels
• Pivot: 5966
• Support: 5938, 5902, 5858
• Resistance: 6010, 6041, 6098

Weekly Red Candles Signal Potential PullbackOn the weekly chart, two clean red candles have formed. The price is struggling to move higher — every attempt to break above is being sold off.
An additional factor is geopolitical tension, which puts extra pressure on bullish momentum.
After such an exponential rally, I expect at least a pullback .
Could there be a new high and breakout above resistance? Yes, it's possible.
But the current setup offers a clear stop-loss just 1.60% below the current price — a small and comfortable risk.
This is not a quick trade. I plan to hold the position anywhere from 1 week to 1 month, depending on how the market develops. Therefore, I choose an optimal position size for my account, knowing that margin will be frozen.

SPX: geopolitics, Fed, inflationDuring the previous week the S&P 500 was moving in a mixed manner. The trading range was between levels 6.039 and 5.967 where the index is closing the week. Traders and investors had quite a lot of topics to cover in order to decide which side should be traded. The tensions in the Middle East were one of them, continuing for the second week in a row. The FOMC meeting was held, with the Fed holding interest rates steady, for another meeting. Still, the Fed continues to count with two rate cuts till the end of this year. The Fed expects that implemented trade tariffs by the US Administration might affect short term inflationary pressures, but it should be a one-off effect. Some positivity for markets came from the statement of the Fed Governor Waller, who noted that the Fed might make the first rate cut in July. On the opposite side was San Francisco Fed President Mary Daly, who noted that she would be more confident to cut rates, after she is certain that the trade tariffs would not make a significant impact on inflation.
Uncertainty still holds on markets, especially after news posted by the Wall Street Journal, noting that the U.S. might cancel technology waivers, impacting some chipmakers. The tech companies involved in the semiconducting business dropped in value. Friday's trading session Nvidia ended by 1,12% lower, AMZN also closed the week with a drop of 1,33%. This week on the opposite side was Apple, with a gain of 2,25%.
As long as uncertainty shapes investors sentiment, the market will lack optimism. The volatility on the US equity markets might continue, with possibly negative trends. The week ahead brings the PCE data as well as Fed Chair Powell`s testimony in front of the Congress, in which sense, the volatility will most certainly hold.

Bullish continuation?S&P500 (US500) is falling towards the pivot which has been identiifed as ab overlap support and could bounce to the 1st resistance.
Pivot: 5,796.40
1st Support: 5,555.95
1st Resistance: 6,091.55
Risk Warning:
Trading Forex and CFDs carries a high level of risk to your capital and you should only trade with money you can afford to lose. Trading Forex and CFDs may not be suitable for all investors, so please ensure that you fully understand the risks involved and seek independent advice if necessary.
Disclaimer:
The above opinions given constitute general market commentary, and do not constitute the opinion or advice of IC Markets or any form of personal or investment advice.
Any opinions, news, research, analyses, prices, other information, or links to third-party sites contained on this website are provided on an "as-is" basis, are intended only to be informative, is not an advice nor a recommendation, nor research, or a record of our trading prices, or an offer of, or solicitation for a transaction in any financial instrument and thus should not be treated as such. The information provided does not involve any specific investment objectives, financial situation and needs of any specific person who may receive it. Please be aware, that past performance is not a reliable indicator of future performance and/or results. Past Performance or Forward-looking scenarios based upon the reasonable beliefs of the third-party provider are not a guarantee of future performance. Actual results may differ materially from those anticipated in forward-looking or past performance statements. IC Markets makes no representation or warranty and assumes no liability as to the accuracy or completeness of the information provided, nor any loss arising from any investment based on a recommendation, forecast or any information supplied by any third-party.

The Market Sways and Trump sets a deadline ‼️ Hey hey, hope all is well, don't have too much time so just gonna keep this short and get at what we need right now, thanks for tuning in.
‼️ If you've been following the news then you understand that tensions are pretty high, the conflict in the Middle East is progressively getting worse and worse by the day with The United States now looking to play peacemaker between Iran and Israel.
‼️ Trump himself has given a two week deadline for him to decide on whether or not the United States will join the fight and bomb Iran which notably has the market shaken. Below I've added a link with a reference to an article which highlights the recent news and trumps deadline.
www.npr.org
‼️ Historically, we've seen trump do this before, he's no stranger to setting deadlines, especially when it comes to global conflicts. As the article also references, trump has done this before, take April 24th for example when a reporter asked Trump on his position with continuing military assistance for Ukraine: "You can ask that question in two weeks, and we'll see" responded Trump. It's become a tactic that Trump has used often throughout his term's prompting the question of whether or not we will really see him take action by the end of the two weeks or not. So we should take that understanding and take everything with a grain of salt.
‼️ The market itself is already use to the idea of war or joining a fight like we had to deal with when fighting started between Ukraine and Russia which shook the market before things ultimately got back to routine and the market was able to price in the war. I do have to note though that the global conflicts in Ukraine are much more different than those in the Middle East so that should be taken into consideration as well.
‼️ That being said on Saturday Trump made the announcement that the U.S had launched an attack on three of Iran's main nuclear sites signifying the U.S may be ready to join the fray. That or they have taken advantage of the high tensions to launch an attack of their own to beat at Iran's nuclear progress in order to delay, prevent them from acquiring a nuclear capability understandably.
‼️ I have to go but for technical analysis we'll be watching that 200 EMA for our bullish and bearish convergences, as well as news which will give us an idea of what way the market will head. Definitely one of those times to sit and watch how things play out, we've already come relatively close to retesting our all time high breaking above 6,000 so the market's definitely got some energy. We've dealt with this before but should the U.S really get itself involved with the war and bomb Iran then I would expect the global markets to react heavily. We've seen the U.S offer aid to countries such as Ukraine but when speaking about joining war that's a different matter entirely.
‼️ Definitely be mindful of the news the next few weeks as things progress and don't be to rash with your decision and choices, stick to what's worked and let's focus on what's worked. Paying mind to our indicators and strategies alongside much patience.
‼️ Thank you for tuning in with me as always, appreciate the constant support and wishing all the best. Feel free to keep tuned for more and thanks again.
Best regards,
~ Rock '

Weekly Preview - SPX USOIL NAT GAS GOLD BTCfor SPX to have a good down move, 5900 has to break overnight tonight. 5700 is possible this week. Nat Gas still looks bullish, OIl as well. Gold may go to new highs but that wouldn't necessary be longer term bullish. BTC should continue to drop.

S&P500 Update: Break of Lower TrendlineIn this video, I updated the wave count for S&P500 and discussed 2 different ways of counting it but ended with a bias on a stronger wave 3 down as opposed to a wave 5 of 1 down.
The stop loss is above 6016, with 2 take profit targets:
1) 5940
2) 5923
Good luck!

SPX Gap for BTC LongIf you want to long BTC, wait for SPX to fill its weekly gap :) as simple as that.

Us500:What is going to happen?hello friends👋
This time we are here with the analysis of us500, an important and vital index in the market that is being talked about a lot these days.
Well, let's go to the analysis, you will see that with the drop we had, a lower floor was made and the price was quickly supported and pumped by buyers.
Now it is clear that an ascending pattern has been formed, which is a very strong support in the specified area and a good buying point that you can enter into a transaction with capital and risk management.
Note that if the floor is broken and the stop loss is placed, our bullish pattern becomes invalid and we have to wait for lower floors.
🔥Follow us for more signals🔥
*Trade safely with us*

Big CorrectionThe S&P index.
The chart shows the potential end of the final rally from the 2009 low.
Currently, with this rally from the recent 4,800 low, we are still in a correction period that will end in late October (highs and lows are irrelevant), & We have a date coming up in August so let's see what happens there.
After this period, we will have a rally combined with uncertainty and unjustified speculative movements (bubble) that could take us to the final peak, which I expect in 2026.
This remains a possibility, but don't base your trades on it. However, caution is often good.

Another drop for SPX500USDHi traders,
Last week SPX500USD broke the low of the previous week just as I've said in my outlook. After that it went up again. This pair is still in a bigger correction down.
So next week it could drop again into the direction of the bullish Weekly FVG.
Let's see what the market does and react.
Trade idea: Wait for a small correction up on a lower timeframe to trade short term shorts to the previous Weekly lows.
If you want to learn more about trading FVG's & liquidity sweeps with Wave analysis, then please make sure to follow me.
This shared post is only my point of view on what could be the next move in this pair based on my technical analysis.
Don't be emotional, just trade your plan!
Eduwave

Bull market for growth stocks (vs yields) ending...The Stock Market vs Yields is below the 10 year moving average.
Gold, silver, uranium, copper, oil & friends thrived in similar past setups.

S&P 500 Daily Chart Analysis For Week of June 20, 2025Technical Analysis and Outlook:
The S&P 500 Index has primarily exhibited downward trends during this week’s abbreviated trading session, narrowly failing to reach the targeted Mean Support level of 5940, as outlined in the previous Daily Chart Analysis. Currently, the index exhibits a bearish trend, suggesting a potential direction toward the Mean Support level of 5940, with an additional critical support level identified at 5888.
Contrariwise, there exists a substantial likelihood that following the accomplishment of hitting the Mean Support of 5940, the index may experience recovery and ascend toward the Mean Resistance level of 6046. This upward movement could facilitate a resilient rally, ultimately topping in the completion of the Outer Index Rally at 6073, thereby enabling the index to address the Key Resistance level situated at 6150.

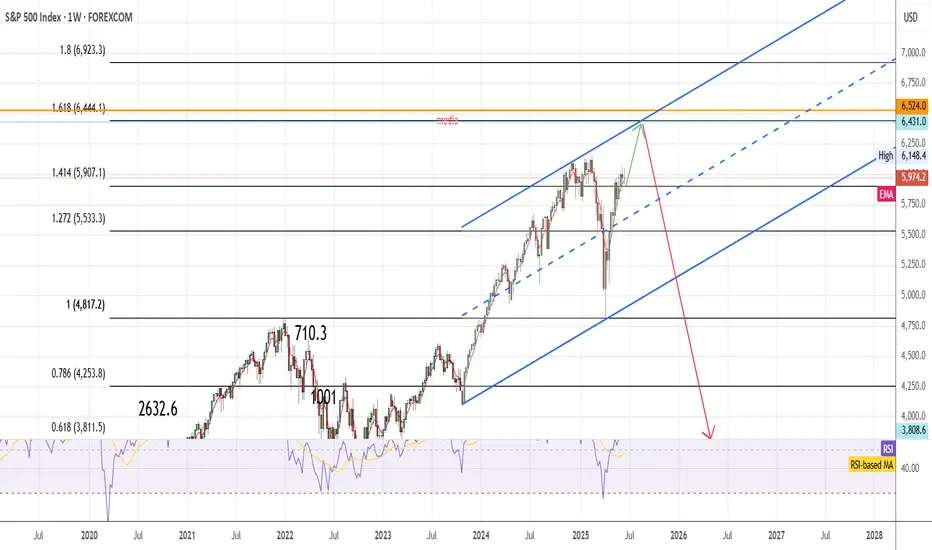
SPX tp 6440 then 3800In my view next month will be bullish for SPX, I expect a test of 6444 area (1.6 fibonacci extension from bullish trend started in 2020) then bearish market will start and push SPX to 3800 area.
SPX500 Technical Outlook: Balancing Risk and RewardPost Content:
🔍 SPX500 Analysis - 4H Timeframe
Our latest technical analysis showcases a detailed approach to the S&P 500 Index using Smart Money Concepts, Fibonacci tools, and volume dynamics. Here's the breakdown:
1️⃣ Trend Structure
The price has formed a wedge within the premium zone, indicating potential exhaustion.
BOS and ChOCH markers highlight key pivots, emphasizing a weak high and strong low.
2️⃣ Fibonacci Insights
We're observing equilibrium near 5,668.57, a critical area where price may consolidate or pivot.
Higher Fibonacci extensions suggest an upside target near 6,580.38, should momentum hold.
3️⃣ Risk-Adjusted Strategy
Short Opportunity: Bearish retracement expected toward equilibrium; target around 5,668.57.
Long Opportunity: Look for confirmations to buy at the discount zone or post-retracement breakout above the weak high.
4️⃣ Volume Dynamics
Spikes at key pivot points signal institutional activity, strengthening the validity of liquidity zones.
📊 Trade Setup Overview
Entry: Short near premium zone OR Long near equilibrium/discount zone.
Stop-Loss: Place below the strong low for longs or above weak highs for shorts.
Target: Extensions at 6,580.38 align with the broader bullish sentiment.
🎯 Key Takeaway: This model emphasizes patience, precision, and risk management. Be sure to monitor upcoming macro events and confirm entry triggers before committing to any position.
🌟 Follow WaverVanir International LLC for more actionable insights, technical breakdowns, and AI-driven strategies!
📈 Trade Safe,
Team WaverVanir International LLC

[06/16] Weekly GEX Roadmap - Diagonal Spreads or Put Hedges?📊 Weekly GEX Map (SPX)
This week’s GEX profile looks nearly identical to last week:
Positive bias above 6020 up to 6100
But a sticky chop zone remains from 5975 to 6020
Below 5950? That’s where things get interesting…
⚠️ What Happens If 5950 Fails?
In that case - welcome to negative gamma territory:
Delta becomes unstable → fast, erratic moves
Gamma loses influence → hedging effectiveness drops
Dealer hedging lags → market makers chase, not lead
Vega + theta distort readings → charm decay accelerates
Result:
GEX zones lose clarity.
Pinning breaks down.
Reactions become nonlinear and emotional.
If we drop below 5950, we might see acceleration instead of stabilization — despite the positive GEX profile.
💡 Trade Idea of the Week – With Caution
If not for Wednesday's macro risk (Fed rate decision), I'd suggest a bullish diagonal spread toward 6100–6150:
Limited downside
Defined risk
Covers the full squeeze zone
But with FOMC looming, I'd only hold this trade until Thursday and close once the debit doubles or earlier.
🧨 Macro + Geo Risks
Fed is priced for “no move” → any surprise = volatility spike
Rising tensions with Iran → oil and futures could react violently
Recommendation : Avoid OIL this week, especially futures and naked strategies
🛡️ Prefer Downside Protection?
If you expect weakness on SPX weekly:
Consider a put debit spread with the short leg at 5950, where the second strongest Put Support sits.
This type of structure can offer up to 6:1 reward-to-risk, making it one of the most efficient bearish hedges for this week.
If you enjoyed the above breakdown, feel free to check out my previous weekly analyses or explore my tools as well.
Until next time – Trade what you see, not what you hope,
– Greg @ TanukiTrade

SPX vs VIX: Is this a sign of a bullish market?VIX has seen a strong decline in the past 2 months following the massive surge of Feb-March due to the Tariff War. In contrast, the S&P500 rose massively to almost its ATH, which is a natural response as the two assets are negatively correlated. This VIX pattern has been seen during every major market bottom in the past 15 years, the strongest of which was the 2020 COVID crash. This is a sign of a very bullish market, TP = 6,800 by the end of the year.
## If you like our free content follow our profile to get more daily ideas. ##
## Comments and likes are greatly appreciated. ##
