SPX'S BULLS !6200 Will get touched easily soon !
because the much vol up there waiting to be hunted at 6100+
𓄀𝓈𝓉𝒶𝓎 𝓉𝓊𝓃ℯ𝒹 𓃓
US500FU trade ideas

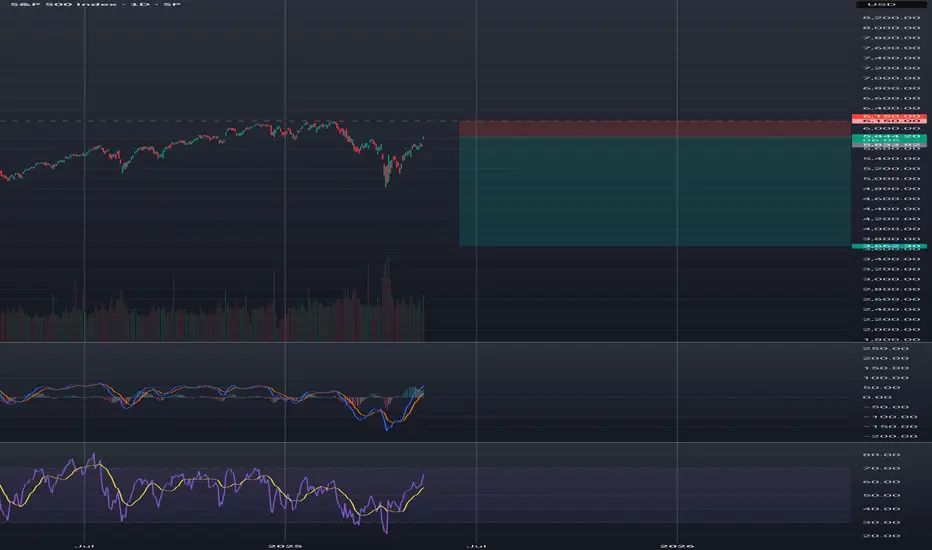
Recession? Weak. Let's Do a DepressionS&P pulled a fast one — but the real show might be just warming up.
Markets tease, bounce, tempt. And then — they punish.
After a sharp rebound, S&P500 is still below 6,150, with weak volumes. The recent rally looks more like a bear trap than a new impulse.
Trading note:
Possible short entries can be considered from current levels, with 50% now, 25% near 6,000, and 25% at 6,100. Stop-loss only after 4H close above 6,150. No clean levels below that — only noise and traps.
This market isn't about fundamentals. It's about desperation. Participants are chasing returns in a shrinking pie, taking on absurd risks.
And now, buckle up:
We are entering what might be the most dramatic market weeks in decades. This is setting up to be a mega-short, folks. Get ready for turbulence. Fasten your seatbelts.
---
Important:
This is NOT a recommendation to trade. This is an extremely high-risk scenario shared for discussion purposes only. If you've already made such a mistake and entered, respect your money and risk management. Losses are much harder to recover than gains.
S&P 500 Short Update 2: Shifting wave degreeHi all,
As I explained in this video, the previous idea was invalidated because of an issue with "degree" of wave that a fellow watcher of my idea rightly pointed out in the comments section. I did the change on this video and explain the mistake I made in the previous idea.
In this video, I also talked about the last wave, how it can still be the peak but on the bigger picture, it is still too small compared to wave 1 and 3.
I then recommend 3 "safer" entry points:
1. One reversion trade at the top of the trendline.
2. One breakdown from the diagonal trendline.
3. One breakdown from the 4th wave support price.
Which entry point(s) you choose depends on your personal preference and opportunity. The stop will be above where you identify as the peak at your point of entry.
Good luck!

S&P500 is Nearing an Important Support of 5,960!!!Hey Traders, in today's trading session we are monitoring US500 for a buying opportunity around 5,960 zone, US500 is trading in an uptrend and currently is in a correction phase in which it is approaching the trend at 5,960 support and resistance area.
Trade safe, Joe.

S&P500: Targeting 7,000 by the end of the year.S&P500 is bullish on its 1D technical outlook (RSI = 64.729, MACD = 100.990, ADX = 19.772) as it is extending the bullish wave started on the April 7th bottom. The long term formation is a Bullish Megaphone and the previous bullish wave peaked after a +48.33% rise. With the 1W RSI pattern almost identical as then, we remain bullish on SPX, TP = 7,000.
## If you like our free content follow our profile to get more daily ideas. ##
## Comments and likes are greatly appreciated. ##

My favorite skitzo line in the S&P 500This is a test post, but it's also one of the single most potentially vindicating technical analysis ideas of all time: that the market really is an oracle that encodes the entirety of relevant information.
This trendline uses a logorithmic scale that intuitively "counterbalances" monetary policy and every other value-traveling dynamic like financial technologies and increasing market efficiencies, et cetera. It's a textbook trendline--Murphy says a trendline is a line that connects two highs or lows--and these highs and lows are the country's most violent economic crises: "The Great Depression" and "The Recession".

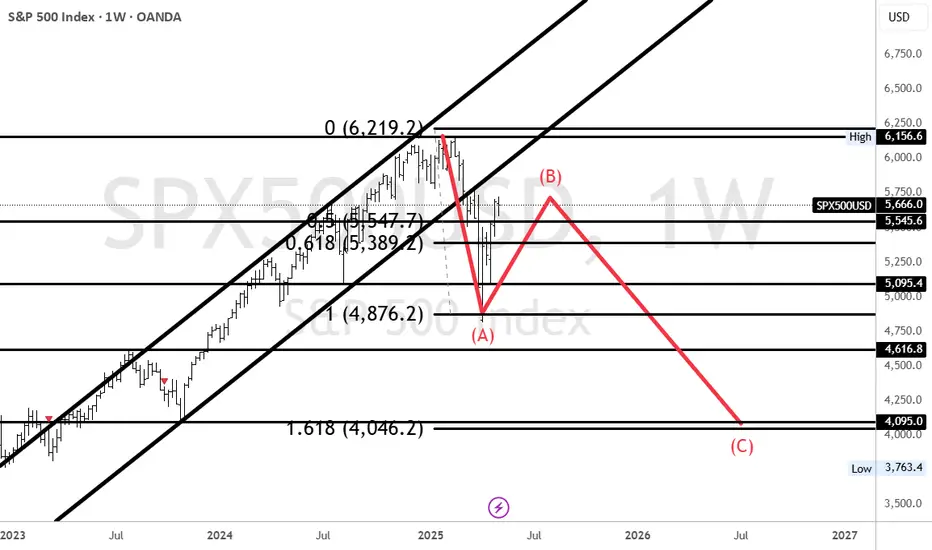
COMPLETED 5 of 3 or C RSI bearish Non confirmation The chart is now labeled as COMPLETED . Please also take note of The HUGE difference in QQQ to QQQE and SPY to RSP . Best of trades Wavetimer 115 % short

sp 500 trend down S&P 500 remains in a broader downtrend, driven by persistent economic uncertainties and inflationary pressures. Despite a recent correction, with the SPY rising approximately 2.5% from $551.23 on April 25 to $565.00 on May 9, this uptick may be temporary, as market sentiment and macroeconomic indicators suggest ongoing volatility and potential further declines
Waiting for the turnSPX cash is likely to confirm the futures high but I don't think any rally from here will last. My bet is still on a turn by Friday. Gold, Nat Gas and USOIL look like a short setup right now. BTC is hard to read, it may go higher first.

S&P500 INDEX (US500): More Growth Ahead
US500 broke and closed above a neckline of an ascending triangle
pattern on a daily time frame.
It is a strong bullish pattern that indicates a strong bullish interest.
With a high probability, buyers will push at least to 6124 resistance.
❤️Please, support my work with like, thank you!❤️

SHORT ON SPY (SPX/USD)SPY has failed to create higher highs and given us a head and shoulders pattern.
I will be selling spy to the next level of demand looking to catch 50-60 points.

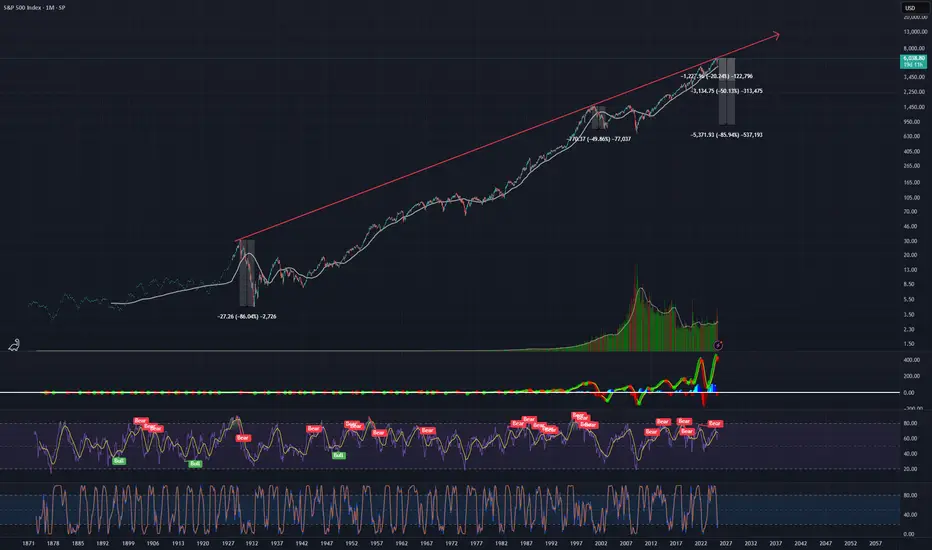
SPX Danger ZoneLog chart of SPX with a trendline connecting 1929 top to 2000 dot com top and up to 2024-25 top.
We already touched this trendline multiple times at the end of 2024 and the beggining of 2025, after which we saw a 20ish percent pullback.
If history rhymes, then we can expect a top at 6250-6350 area in the next few months and we might even stay around there for some time trapping retail investors and other foverever bulls. However, the crash ranging beteween 50 percent (2000 dot com bubble burst) and 86 percent (1929 Wall Street crash) might unravel over the next few years.
With the amount of leverage in the market this house of cards can tumble down even quicker.
Take care.
US500 Could Rise Further After U.S - China Trade FrameworkUS500 could rise further after U.S.-China Trade Framework - Bloomberg
After two days of marathon negotiations in London, the U.S. and China agreed to a “framework” for resuming a trade truce that had unraveled in recent weeks. Top economic officials from both countries are expected to present it to President Trump and Xi Jinping, China’s leader, for final approval.
This news could boost the stock market today, and the US500 could rise further after the two leaders confirm this agreement.
US500 is well-positioned for another upward wave.
The price broke out of a bullish triangle pattern, suggesting further gains.
Key upside targets are 6100 and 6240.
You may find more details in the chart!
Thank you and Good Luck!
❤️PS: Please support with a like or comment if you find this analysis useful for your trading day❤️

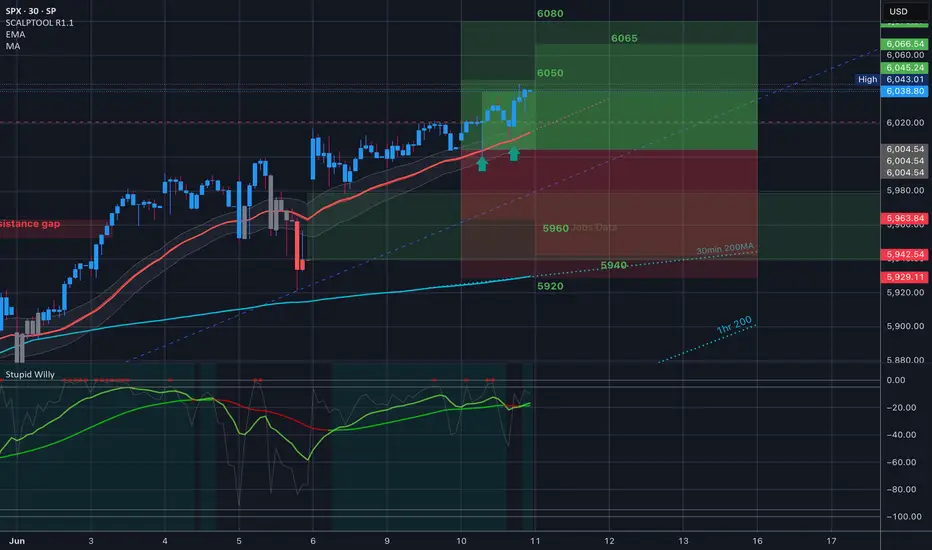
$SPX // June 10 2025 // Analysis & Targets for Day TradersWow!!! What a day!! This is the chart from premarket, and you can see that 35EMA catching us all day. The setup was there. Good Game!!
My 6050/6065 bear call spreads paid today!!
S&P 500 & Indexes Breakdown + Trade SetupsIn this video, I dive into the S&P 500 and other major indexes to share my current market outlook. Right now, price action is stalling and volume continues to dry up — a signal that we could be due for a deeper pullback before any continuation to the upside.
📌 With global fundamentals such as:
US–China trade tensions
Russia–Ukraine war
Broader geopolitical risks
…it’s hard to ignore the pressure building. That’s why I lean bearish in the short term, expecting potential downside before any breakout to new highs.
⚠️ Of course, trying to short in this slow grind can feel like catching a falling knife — but I’ve prepped a few setups, all broken down in the video based on solid technical confluences.
Watch the full breakdown and let me know your thoughts.
Thanks for tuning in! 🙏
👇 Drop a comment, like, and subscribe for more market breakdowns.
#SP500 #IndexBreakdown #MarketOutlook #TechnicalAnalysis #TradeSetups #BearishBias #VolumeAnalysis #GeoPolitics #SwingTrading #TradingCommunity #TradingView

SPX500 weekly overviewThis 6,136.54 calculated by 4821.59 and 3506.64 and worked really well as top of the SPX500!
Expect the zone around that line! All zones could be chosen to long the instrument.
4821.59 * 2 - 3506.64 = 6,136.54
The indicated levels are determined based on the most reaction points and the assumption of approximately equal distance between the zones.
Some of these points can also be confirmed by the mathematical intervals of Murray.
You can enter with/without confirmation. IF you want to take confirmation you can use LTF analysis, Spike move confirmation, Trend Strength confirmation and ETC.
SL could be placed below the zone or regarding the LTF swings.
TP is the next zone or the nearest moving S&R, which are median and borders of the drawn channels.
*******************************************************************
Role of different zones:
GREEN: Just long trades allowed on them.
RED: Just Short trades allowed on them.
BLUE: both long and short trades allowed on them.
WHITE: No trades allowed on them! just use them as TP points

Morning market ideasSPX could be finished overnight but the cash session may try to equal the overnight high. Gold is coming up to heavy resistance. Oil Looks to be heading towards 66 and maybe more. BTC looks like it may drop again but right now it's at support. Natural Gas is likely going to drop.

S&P500 No signs of stopping here. Can hit 6900 before years end.The S&P500 index (SPX) has turned the 1W MA50 (blue trend-line) into Support, successfully testing it and holding and is now going for the All Time High Resistance test. Based on its 1W RSI structure and candle action, it resembles the previous times since 2023 that after a quick consolidation, it broke upwards again aggressively.
As you can see, both of those Bullish Legs that started on the 2023 Higher Lows trend-line, hit at least their 1.618 Fibonacci extension before a new 3-week red pull-back. In the case of 2024, even the 2.0 Fib ext got hit a little later.
As a result, we expect to see at least 6900 (Fib 1.618) before the end of 2025, with the good case scenario (Fib 2.0) going as high as 7500.
-------------------------------------------------------------------------------
** Please LIKE 👍, FOLLOW ✅, SHARE 🙌 and COMMENT ✍ if you enjoy this idea! Also share your ideas and charts in the comments section below! This is best way to keep it relevant, support us, keep the content here free and allow the idea to reach as many people as possible. **
-------------------------------------------------------------------------------
Disclosure: I am part of Trade Nation's Influencer program and receive a monthly fee for using their TradingView charts in my analysis.
💸💸💸💸💸💸
👇 👇 👇 👇 👇 👇

S&P500 INTRADAY uptrend continuation supported at 5960Key Support and Resistance Levels
Resistance Level 1: 6120
Resistance Level 2: 6170
Resistance Level 3: 6220
Support Level 1: 5960
Support Level 2: 5900
Support Level 3: 5800
This communication is for informational purposes only and should not be viewed as any form of recommendation as to a particular course of action or as investment advice. It is not intended as an offer or solicitation for the purchase or sale of any financial instrument or as an official confirmation of any transaction. Opinions, estimates and assumptions expressed herein are made as of the date of this communication and are subject to change without notice. This communication has been prepared based upon information, including market prices, data and other information, believed to be reliable; however, Trade Nation does not warrant its completeness or accuracy. All market prices and market data contained in or attached to this communication are indicative and subject to change without notice.

A Potentially Dangerous Pattern Takes ShapeWhile the futures market has yet to break into new all-time high territory, the previously discussed bearish micro setup has now been invalidated. In its place, we’re witnessing a complex, overlapping advance—creeping steadily toward the prior highs in the S&P 500 (ES).
At the micro level, I currently see no compelling bearish setup. However, this grinding upward move—lacking strong conviction from either buyers or sellers—is not necessarily bullish. In fact, it’s a hallmark of a potentially dangerous pattern: a primary degree ending diagonal.
If my interpretation is correct, both the “orange” and “purple” wave counts point to the same ominous conclusion. They suggest that what we're seeing could culminate in a sharp, possibly violent reversal—one that would ultimately retrace back to where this entire primary wave began. For reference, that’s just above 4,000, marked by the conclusion of Primary Wave 4 in October 2022.
This is the moment for caution—not after the damage is done.
Yes, we may push into new all-time highs. But within this fragile and overlapping structure, that outcome is far from guaranteed. Even if we get there, the looming question remains:
At what cost?

SPX500 Holds Steady as Markets Eye US-China Trade Developments SPX500 Overview
U.S. stock futures were little changed on Tuesday as investors awaited key developments from the U.S.-China trade talks underway in London.
Technical Outlook (4H Chart):
The index is experiencing cautious movement amid ongoing tariff tensions and geopolitical uncertainties.
Bullish Scenario:
A sustained 4H close above 6030 could confirm bullish momentum, with upside targets at 6066 and 6098, potentially extending toward a new all-time high (ATH).
Bearish Scenario:
As long as the price remains below 6010, bearish momentum may persist, targeting the support levels at 5966, followed by 5938 and 5902.
Support: 5966 • 5938 • 5902
Resistance: 6066 • 6098

S&P 500 Short Update: Ending DiagonalEnding diagonals completed. Stop above 6040. Take profit at 5744 first.

Position Sizing 101: How Not to Blow Up Your Account OvernightWelcome to the trading equivalent of wearing a seatbelt. Not really exciting but entirely recommended for its lifesaving properties. When the market crashes into your stop-loss at 3:47 a.m., you’ll wish you’d taken this lesson seriously.
Let’s talk position sizing — the least flashy but most essential tool in your trading kit. This is your friendly reminder that no matter how perfect your chart setup looks, if you’re risking 50% of your capital on a single trade, you’re not trading. You’re gambling. And also — if you lose 50% of your account, you have to gain 100% to get even.
✋ “Sir, This Isn’t a Casino”
Let’s start with a story.
New trader. Fresh demo account turned real. He sees a clean breakout. He YOLOs half his account into Tesla ( TSLA ). "This is it," he thinks, "the trade that changes everything."
News flash: it did change everything — his $10,000 account turned into $2,147 in 48 hours.
The lesson? Position sizing isn’t just about managing capital. It’s about managing ego. Because the market doesn’t care how convinced you are.
🌊 Risk of Ruin: The More You Know
There’s a lovely concept in trading called “risk of ruin.” Sounds dramatic — and it is. It refers to the likelihood of your account going to zero if you keep trading the way you do.
If you risk 10% of your account on every trade, you only need to be wrong a few times in a row to go from “pro trader” to “Hey, ChatGPT, is trading a scam?”
Risking 1–2% per trade, however? Now we’re talking sustainability. Now you can be wrong ten times in a row and still live to click another chart.
🎯 The Math That Saves You
Let’s illustrate the equation:
Position size = Account size × % risk / (Entry – Stop Loss)
Example: $10,000 account, risking 1%, with a 50-point stop loss on a futures trade.
$10,000 × 0.01 = $100
$100 / 50 = 2 contracts
That’s it. No Fibonacci razzle-dazzle or astrology needed. Just basic arithmetic and a willingness to not be a hero.
🤔 The Myth of Conviction
Every trader has a moment where they say: “I know this is going to work.”
Spoiler alert: You don’t. And the moment you convince yourself otherwise, you start increasing position size based on emotion, not logic. That’s where accounts go to die.
Even the greats keep it tight. Paul Tudor Jones, the legend himself, once said: “Don't focus on making money; focus on protecting what you have.” Translation: size down, cowboy.
🔔 Position Size ≠ Trade Size
A common mistake: confusing position size with trade size.
Trade size is how big your order is. Position size is how much of your total capital is being risked. You could be trading 10 lots — but if your stop loss is tight, your position size might still be conservative.
So yes, trade big. But only if your risk is small. You’ll do better at this once you figure out how asymmetric risk reward works.
🌦️ Losses Happen. Don’t Let Them Compound
Let’s say you lose 5% on a trade. No big deal, right? Until you try to “make it back” by doubling down on the next one. And then again. And suddenly, you’re caught in a death spiral of revenge trading .
This is not theoretical. It’s Tuesday morning for many traders.
Proper position sizing cushions the blow. It turns what would be a catastrophe into a lesson — maybe even a mildly annoying Tuesday.
🌳 It’s Not Just About Risk — It’s About Freedom
Smart sizing gives you flexibility (and a good night’s sleep).
Want to hold through some noise? You can. Want to scale in? You’re allowed. Want to sleep at night without hugging your laptop? Welcome to emotional freedom.
Jesse Livermore, arguably the most successful trader of all time, said it best: “If you can’t sleep at night because of your stock market position, then you have gone too far. If this is the case, then sell your position down to the sleeping level.”
⛳ What the Pros Actually Do
Here’s a dirty little secret: pros rarely go all-in without handling the risk part first (that is, calibrating the position size).
If they’re not allocating small portions of capital across uncorrelated trades, they’ll go big on a trade that has an insanely-well controlled risk level. That way, if the trade turns against them, they’ll only lose what they can afford to lose and stay in the game.
Another great one, Stanley Druckenmiller, who operated one of the best-returning hedge funds (now a family office) said: “I believe the best way to manage risk is to be bullish when you have a compelling risk/reward.”
🏖️ The Summer of FOMO
Let’s address the seasonal vibes.
Summer’s here. Volume’s thin. Liquidity’s weird. Breakouts don’t follow through. Every false move looks like the real deal until it isn’t. And every poolside Instagram story from your trader friend makes you want to hit that buy button harder.
This is where position sizing saves you from yourself. Small trades, wide stops, chill mindset. Or big trades, tight stops, a bit of excitement in your day.
No matter what you choose, make sure to get your dose of daily news every morning, keep your eye on the economic calendar , and stay sharp on any upcoming earnings reports (GameStop NYSE:GME is right around the corner, delivering Tuesday).
☝️ Final Thoughts: The Indicator You Control
In a world of lagging indicators, misleading news headlines, and “experts” selling you dreams, position sizing is one of the few things you have total control over.
And that makes it powerful.
So next time you feel the rush — the urge to go big — take a breath. Remember the math. Remember the odds. And remember: the fastest way to blow up isn’t a bad trade — it’s a good trade sized wrong.
Off to you: How are you handling your trading positions? Are you the type to go all-in and then think about the downside? Or you’re the one to think about the risk first and then the reward? Let us know in the comments!
