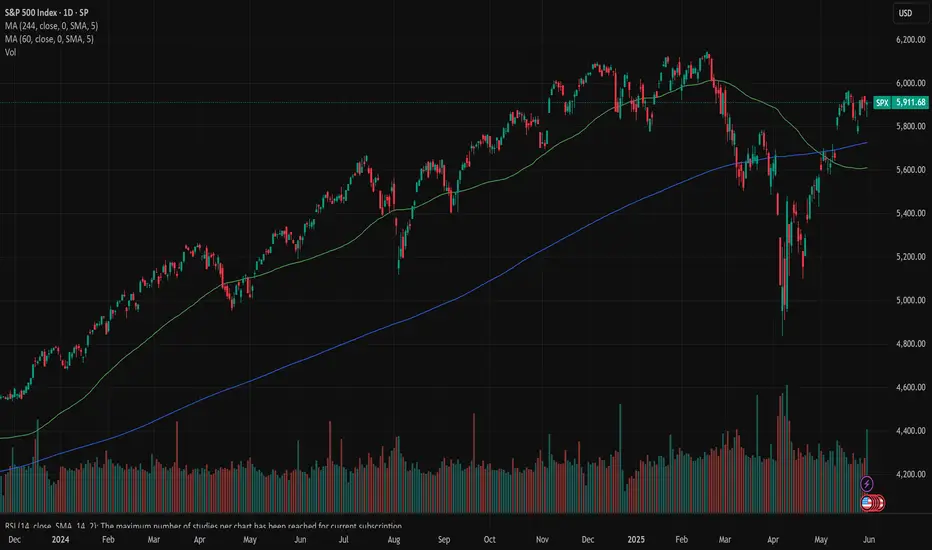
SPX: tariffs weekly tweet updateThe US Administration trade tariffs continue to bring confusion among market participants, but despite this, the S&P 500 managed to end May with a gain of 6,2%. The tariff-weekly-news included the announcement of the US President on social media that China “violated” current tariffs agreement. Although there were no further explanations, Bloomberg published information from an uncited source, that the US is planning to bring tariffs to China tech sector. At the same time, there was no official confirmation from the US Administration. The European Union is considering countermeasures on the US, after the announcement of the US Administration on an increase of tariffs on steel from 25% to 50%. All these ping-pong tariffs measures from the last period are causing some investors to slowly lose temper, with comments like “If you are an investor, you want to bet on good earnings, not good tweets about tariffs”, as Jay Hatfild from Infrastructure Capital Management told to CNBC. This brings some confidence that the markets will not make stronger moves on tweets, but only to actual moves of the US Administration in the coming period. Trading during May might provide some confidence also for the future period.
In line with investors, the University of Michigan Consumer Sentiment showed some relaxation with the final May data. The indicator ended the month at the level of 52,2 a bit better from estimated 51. The most important are inflation expectations which also eased a bit from previous release, in which sense five year inflation expectations are currently at 4,2%, and below market estimate of 4,6%.
The market confusion will most certainly continue also during June, but it seems at the lower volatility levels. More attention will be turned to macro data, and company earnings. The first trading week in June is bringing US jobs data, including the Non-farm payrolls, which might bring back some volatility on US equity markets.
US500FU trade ideas

SPX500 (S&P 500 Index) – Smart Money + Fibonacci Liquidity Sweep📅 Chart Timestamp: May 31, 2025 – 4H Timeframe
📈 Current Price: 5,902.26
📊 Volume (Recent Candle): 64.95K
🧠 Technical Breakdown
🔺 Premium Zone Rejection
Price has sharply rejected the 5,995–6,050 area — a key premium supply zone aligned with the Fibonacci 1.0–1.236 extension.
This rejection occurred after a weak internal high was formed, showing signs of exhaustion and liquidity grab behavior.
📉 Market Structure
Multiple Break of Structure (BOS) and Change of Character (CHoCH) confirm a short-term bearish market structure.
Price has begun forming lower highs and is now in a distribution phase.
📏 Key Fibonacci & Smart Money Levels
0.786 Fib Retracement (5,804) → Recently tested; acted as a short-term support but broken.
Equilibrium Zone (5,443.75) → Critical price magnet. Price is projected to gravitate toward this zone as part of a liquidity sweep and reaccumulation.
Discount Zone (below 5,300) → Stronger support if equilibrium fails. Could serve as a long-term buying opportunity.
🌀 Expected Price Path (Yellow Projection)
Short-term downside continuation into 5,560–5,440.
Likely to form a double-bottom or mitigation structure at equilibrium.
Reversal potential targeting 6,200–6,300 (1.236–1.382 extension) before next macro correction.
📈 Probability Framework
Scenario Description Probability Rationale
📉 Pullback to Equilibrium Price revisits 5,443.75 75% Confluence of Smart Money FVGs + Fib levels + BOS indicates liquidity resting below
🔁 Reaccumulation at EQ Reversal from 5,440–5,500 65% Price often reacts to equilibrium in a bullish uptrend continuation
📈 Rally to 6,200+ Price takes out weak highs and extends 50% Depends on macro sentiment improving + liquidity expansion
🧨 Break below EQ into Discount Price collapses toward 5,300 30% Only if macro deterioration accelerates (Fed surprise, global contagion)
🧠 Macro Risk & Fundamental Context (as of May 31, 2025)
🏦 Federal Reserve
Market is pricing in no rate cut in June, but increased odds (65–70%) of a cut in July.
Sticky inflation + slowing job growth creates an uncertain macro narrative.
💵 Liquidity & Risk Sentiment
Bond market volatility (MOVE Index) remains elevated → signaling stress in interest rate pricing.
VIX is stable near 12–14 range → complacency risk if volatility spikes.
Global liquidity has tightened in EMs due to dollar strength, though US equities remain buoyed by AI & tech.
📉 Earnings + Breadth
Earnings season was mixed; top-heavy performance (few stocks driving index).
Weak market breadth suggests a correction is healthy or overdue.
⚠️ Risk Factors to Monitor
Surprise Fed policy pivot (hawkish).
Geopolitical escalations (Middle East, Taiwan).
Sudden rise in VIX or credit spreads.
Bearish divergence between index and market breadth indicators.

SPX500USD still going upHi traders,
How accurate do you want an outlook to be? Last week I said price rejected from the Daily BPR so we could see this pair go up again to the higher Daily FVG. And that's exactly what happened.
And after price swept the liquidity to the left, it made a correction into the 4H FVG.
So next week we could see the continuation of the upmove.
Let's see what the market does and react.
Trade idea: Wait for a bullish change in orderflow and a small correction down on a lower timeframe to trade longs.
If you want to learn more about trading FVG's & liquidity sweeps with Wave analysis, then please make sure to follow me.
This shared post is only my point of view on what could be the next move in this pair based on my technical analysis.
Don't be emotional, just trade your plan!
Eduwave

S&P 500 Index -- Weekly Volatility Potential Good Afternoon!
This week, I want to talk about the CBOE:SPX and its weekly potential for how I read historical volatility to weight it then to implied volatility -- this creates my custom trading ranges.
Implied ranges for this week are calculated at 4 DTE using my strength of IV method. You can find out more how I do this over at my highlights page on 'X' - Find me @askHVtobidIV
We are entering a short week, with IV currently in the 89th percentile for the year ( 18.31% ) and resonating between bi-weekly ( 19.36% ) and monthly ( 15.13% ) historical values. Quarterly volatility trends ( 31.79% ) have risen more than 10% this year alone due to macro concerns and increased news from tariff uncertainties. This is creating a volatile environment that, in turn, only increases our trading ranges. Something I personally like.
Near-term trends are above the currently high IV environment, suggesting further expansion. This provides premium value on what is happening to what is projected to happen and a “strength of IV” of >100% indicating rising volatility, slowly towards quarterly means, while resonating around monthly trends.
If price action drives downwards, our gap from May 16th could fill around $5,692.56 with confluence of HV21 trends at $5,710.91.
Conversely, I can see HV10 ranges with rising pricing action and good macro news with EU tariffs breaking $5,971.33—Expanding to the price of $5,995.95 with continuing expansion and regression towards means.
Come back next weekend as I will review the chart to see how we developed!
For those interested in volatility analysis and the application of weighted HV ranges to IV, I encourage you to BOOST and share this post, leave a comment, or follow me to join me on this journey.

S&P 500 Daily Chart Analysis For Week of May 30, 2025Technical Analysis and Outlook:
The S&P 500 Index has undergone considerable price fluctuations during the trading sessions of this week, successfully reaching a critical target at the Mean Support level of 5800. Presently, the index is exhibiting an upward trend with a focus on the retest of the Inner Index Dip at 5955 and Key Resistance at 5965. Furthermore, additional significant levels have been identified, including the Next#1 Outer Index Rally at 6073, Key Resistance at 6150, and the Next#2 Outer Index Rally at 6235. Conversely, there is a potential for the index prices to downfall aiming to retest Mean Support 5800 and to complete the Outer Index Dip, noted at 5730.

June is expected to be bllodbathHistorical trends suggest that June tends to be a weaker month for U.S. equities, with the S&P 500 averaging a modest gain of just 0.1% over the past 20 years, according to CFRA Research. Seasonal factors, including lower trading volumes and investor caution ahead of mid-year earnings, often contribute to subdued performance.
Despite May’s gains, analysts warn of a potential pullback in June. Market sentiment remains fragile amid lingering Fed rate uncertainty and geopolitical risks. The CBOE Volatility Index (VIX) has ticked higher, signaling growing caution (MarketWatch).
The potential return of Trump-era trade policies—including aggressive tariffs—has injected uncertainty into markets. Investors fear renewed trade wars could disrupt supply chains and inflate costs, weighing on corporate profits
In conclusion, while May delivered a bullish surprise, investors should brace for increased volatility in June. Historical trends, coupled with overbought conditions, suggest a correction may be on the horizon.
Expect a major pullback to test previous lows of ~5000

SPX500 – Fibonacci Breakdown Hints Deeper Correction AheadThis 1H SPX500 setup highlights a potential bearish continuation pattern following a clear rejection from the 0.618–0.786 Fibonacci retracement zone. Here's a breakdown of the trade thesis:
🔍 Analysis Summary:
Fibonacci Cluster Rejection: Price failed to reclaim 5,921.31 (key resistance) and sharply rejected from the 0.618–0.786 retracement zone.
Bearish Market Structure: Lower highs formed near the .618 Fib, followed by a strong impulsive sell-off.
Liquidity Zone Below: The price is targeting the previous demand block near 5,796.99, a major structural liquidity zone.
Measured Targets (Fibonacci Extensions):
TP1: 1.236 @ 5,844.09
TP2: 1.618 @ 5,796.99
TP3: 2.0 @ 5,749.35
📌 Trade Setup:
Short Entry Zone: 5,915 – 5,921 (retest of resistance)
Stop Loss: Above swing high at 5,932
Take Profits:
TP1: 5,844 (partial close)
TP2: 5,796.99 (main target)
TP3: 5,749 (optional extension)
🧠 Macro Consideration:
With Fed rate uncertainty and bond market fragility, equities may be vulnerable to deeper retracement as institutions de-risk.
Volatility remains elevated heading into month-end—be flexible and risk-aware.
📊 Evidence Supporting the Hypothesis
Resistance at 0.618 Fibonacci Level:
The SPX has approached the 0.618 Fibonacci retracement level, a critical resistance point. A failure to break above this level could indicate a potential reversal or continuation of the downtrend.
Historical Significance of 0.618 Level:
Breaking below the 0.618 Fibonacci support level often signals a continuation of the downtrend, as it is a significant retracement level in technical analysis.
Stalling at Key Fibonacci Target:
The S&P 500's recent rally has stalled near a critical Fibonacci retracement level, raising questions about whether the market is entering a new uptrend or merely experiencing a bear-market bounce.
📉 Implications for Traders
Bearish Continuation: The inability of the SPX to surpass the 0.618–0.786 retracement zone suggests that the recent rally might be a temporary correction within a broader downtrend.
Potential Targets: If the bearish trend resumes, traders might look for support levels at the 1.236, 1.618, and 2.0 Fibonacci extension levels, aligning with the previously mentioned targets of 5,844.09, 5,796.99, and 5,749.35, respectively.
Risk Management: Given the current market volatility and the significance of these Fibonacci levels, traders should employ strict risk management strategies, including setting stop-loss orders above recent swing highs and monitoring for confirmation signals before entering positions.
In summary, the SPX's struggle to break through the 0.618–0.786 Fibonacci retracement levels, combined with historical patterns and recent technical analyses, supports the hypothesis of a potential bearish continuation. Traders should remain cautious and consider these technical indicators when making trading decisions.
📊 Wavervanir International LLC | Discretionary + Quant Hybrid Risk Management

SPX week & month review 5/30/25Intrigued by today as we closed the month and week. The charts appear bullish until something changes that. Key points I noticed...
*Monthly morning star pattern
*RSI above 50 on month and week chart
*MACD over zero line and signal up on month and week chart
*Key levels holding up (21 ema, FVGs)
We are still in volatile times and narratives are being thrown all over the place. Do you see what I see? Enjoy your weekend.

S&P500 finishing re-accumulation and sets eyes on 6230.The S&P500 / SPX has turned sideways after an impressive recovery from April's lows.
The 1day MA50 provides the same kind of support as it did after the October 2023 rebound.
The RSI pattern on both sequences is also similar and it suggests that the price is at the point where it breaks upwards to the Rising Resistance.
Target 6230.
Follow us, like the idea and leave a comment below!!

Bull trap into the close?Daily Bias is still up, but if we end the day near 5940, it may be a C wave with a further move down into next week. I also look at Gold, USOIL, and BTC

S&P 500 4 HR. WAVE C IS LIKELY OVER ON CORRECTION!1). Price is very likely heading towards the fair Market value @ 5870. 2). Risk Assets are weak today on US$ strength! 3). BANKS ARE SELLING! 4). Volume is dropping. 5). Trendline intersecting with target fib. level. 5). ONCE COMPLETED PRICE WILL PROGRESS NORTH ON WAVE 5 VERY LIKELY

SPY update for todayHello everyone,
Not much new to update today, the main highlight is that the market has broken down from the trendline. This is definitely something to take note of. However, today’s move came with relatively low volume, which suggests that while price dropped significantly, there wasn’t a lot of strength behind the move.
This reminds us of a key principle in trading: the market can do whatever it wants. It may look bullish today and turn bearish tomorrow. So always react to what the market is showing you, not just what you expect it to do. Easier said than done, I know, but it's essential.
Looking ahead, this potential pullback could present better entry opportunities, assuming the market doesn’t flip into a full bearish meltdown. For now, we need to give the market some room to breathe, observe how it reacts at key levels, and stay patient for the right setup.
Remember: we're still in a broadly bullish environment. So let’s wait for strong reactions at the right price points before jumping in.

SPX500: Lwets go! This message will be deleted in 15 minutes. let's see what we get today. my convictions are high for short.

Choose Your Fighter SPX Here is the broadening formation we're in.
TVC:SPX is likely to consolidate further before making a decisive move.

Watching SPX500, buying puts right now!I think the market will reverse here. I don't know what the market is going to do, but I have high conviction in .886 reversal from this zone. Also, 0.618–1.618 confluence pending. Let's see what we get here.

SPX - June ProjectionsMay showed price heading back up to the high. This is four months now from the previous top. Generally for a major top to exhibit itself, it might take only three months to test. Four months is also not uncommon so it is possible that today's close will be last positive monthly close in a while.
I expect that the price will continue to rise, probably above the 6010 level of the last monthly closing high. If price surpasses the previous monthly close high, I will be watching for a turnaround, with prices eventually closing out June to the downside.
To me, based on the 40-month moving average. I have noticed that usually waves 2 and 4 have strong support at the 40 month moving average, where more major corrections will see price go below it. As price just came down to that level and didn't break it, we are in or have finished a wave 4. I'm still looking for lower prices assuming that this wave 4 to be a Flat with more sideways action ahead.
Currently short SP

$SPX // May 30 2025 // Analysis & Targets for Day TradersSP:SPX // May 30 2025 // Analysis & Targets for Day Traders

Structure Over Sentiment: Multi-Asset View into Month-End📊 Structure Over Sentiment: Multi-Asset View into Month-End | May 30, 2025
This isn’t a crash. This isn’t a rally. This is digestion.
The multi-asset view tells the real story — and it's not as chaotic as it looks.
🔍 What the Chart Shows:
This correlation lens plots key macro and market drivers YTD:
🟣 Gold (XAUUSD): Leading with +24.71% — this is the quiet macro bid no one’s talking about
🟢 Bitcoin (BTCUSD): Holding +8.47% — volatile, but still showing risk appetite
🔴 10Y Yield (US10Y): Up +5.31% — signalling rates peaking
🟠 Nasdaq (NDX): Nearly flat, -0.36% — NVDA strength masking internal rotation
🔵 S&P 500 (SPX): -2.32% — structurally fine, just not euphoric
🔵 Dow (DJA): -5.91% — lagging, cyclical drag
🔵 Russell 2000 (RTY): -13.60% — small caps under pressure, risk-on caution flag
🟣 Dollar Index (DXY): -6.44% — fading after a strong Q1
🟢 Oil (WTIUSD): -10.26% — no inflation panic here
🧠 Key Insight:
Despite the tariff headlines, sticky PCE, and conflicting narratives — the market remains internally consistent.
Gold is leading
Yields are rising but not sharply
Bitcoin is positive
Equities are flat-to-negative
Oil is weak
Dollar is fading
This is classic late-cycle digestion, not a crisis.
🛡️ Titan Mindset Check-In:
Don’t get lost in single headlines
Follow structure, not speculation
Let leaders lead (NVDA, Gold, BTC)
Protect equity when breath narrows
Zoom out, reduce noise, trade the curve — not the chaos
📍“Volatility isn’t risk. Misinterpretation is.”
Take Profits, Not Chances.
#MultiAssetView #StructureOverShock #TitanProtect #SPX #NDX #BTC #Gold #DXY #WTI #US10Y #MacroFlow #MarketMindset #LateCycleSignals #DigestDontPanic

S&P 500 MAJOR REVERSAL INCOMING? | SPX500 SELL ZONE HIT SPX500 just tapped into a critical supply zone near 5985 and has started pulling back. Is this the beginning of a deeper correction? Here’s what I’m watching 👇
---
📊 Key Technical Zones:
🔵 Supply Zone: 5985 – 6000 (Strong historical rejection zone)
⚠️ First Support: 5436.1 – potential bounce area, but already tested
🧱 Major Demand Zone: 4990 – heavy volume base, ideal buy zone for bulls
---
🚨 Bearish Clues on the Chart:
Price got rejected at the top of the supply range with a strong wick.
Bearish divergence on recent highs (not shown here but evident on RSI/MACD).
Clean downside structure could target 5436, then 4990 if broken.
📉 Downside Projections:
First TP: 5436
Final TP: 4990 (big institutional interest)
---
🔁 Possible Scenarios:
1. 🔻 Bearish Continuation: If we break below recent support near 5880, expect speed towards 5436.
2. 🟢 Bullish Fakeout: Only a strong breakout above 5985 invalidates this setup.
---
🎯 Trade Idea (Educational):
Entry: Break and retest below 5880
SL: Above 5985 zone
TP1: 5436
TP2: 4990
---
📅 June Will Be Volatile – Stay prepared.
💬 Do you think this is the start of a correction or just a dip before ATH?
🔔 Follow @FrankFx14 for clean and professional chart updates! 👍 Like, 🔁 share, and 💭 comment your thoughts below!

SPX, Final choppy leg upExpecting choppy ending diagonal wave 5 up to 6130-6200area. Followed by a larger wave 2 correction at the next higher degree/ set up for the a larger wave 3 wave to new ATH. ( Tax cuts/ rate cuts ).
How low will wave 2 go? ( somewhere in the green box most likely). Will we need to monitor its structure going down. Trump will not let market collapse to far If he can help it... And he can help it.

The Bias remains up on both Gold and the SP500 Both markets are above their 18mas so the bias remains up. SPX BB is 6054 and if I'm right we will get there.

Tracking a pattern that could signal the Top is In I am tracking a micro pattern with the new local high made in the ES last night and today's price action as a micro 5-down....we should get a slight retrace into the 5960 ish area. Maybe tomorrow...maybe in the overnight session tonight.
If price can then breach todays micro low of 5884 in the ES futures...we need to then follow through with a breach of 5857 to give us our first indication, we may have struck a top.
From there I am following 2 counts...Purple, or my primary count which is a minor C of Intermediate (A).
Best to all,
Chris
