Unsustainable Market Trends I'm overall a bear but I think we'll probably make a new high. I've explained previously how a new high does not annul the bear thesis since there are various spike out patterns. Let's now talk about the unsustainable nature of what we're currently seeing.
First things first - trendlines going up at angles of over 70 degrees is not good! 35 - 45 degrees, good. That's quite sustainable. It can keep doing that. 70+, not good. It can not keep doing that.
I hate to speak in absolutes, but we can be fairly sure markets can not rise at this angle indefinitely without something really bad happening. Were this to happen, it would have to be a result of devaluation of the currency and although stock markets would be higher, everyone would be hurting. Especially average people.
A highly optimistic forecast of how this can end well would be after making gains markets go into a prolonged period of contraction. There's no more straight up price action but there's also nothing terrible to the downside. I can't really think of any examples of this ever happening. I guess the closest would be the big range before the 80s/90s breakout (But that was not like this into the high).
The most common outcome of markets going up at angles of over 70 degrees is they come down at angles of over 70 degrees!
I feel the moves of 2021 and 2023 have made the market exceptionally more risky. Markets looked extended in 2018 - 2019, but what felt like mania in 2018 was dwarfed in the following years with full years of rallies at angles above what is sustainable. It'd be highly uncommon for these moves to resolve without spiking out the low of where they started.
The tendency of parabolic moves to resolve themselves by trading under where the move started becomes increasingly worrying as we move further from that level. It's around 2,200 in SPX. Even if it came from the current high this would forecast a move worse than 2008. Were it to come from a bit higher, this would start to forecast a move on the scale of depression crashes (At least 80% and lasting at least 10 yrs without a new high).
What I am trying to say here is, if markets keep going up at angles of over 70 (And SPX really isn't far off 100 right now), something very bad is likely to happen. And it's looking likely SPX may do this. Markets may break and make a blow-off without further major retracements and this style of blow-off can be 20 - 25% above the last high.
This would give us estimates for a blow-off ending 6,000 area in SPX and just under 20,000 area in Nasdaq. Both of these would be drawing down at least 70% to break the low of where the excessive angle of buying started. While this is nothing earthshattering in terms of charting norms (What goes up comes down), this would be significant in the real world.
If this big spike out is coming, I think we're seeing the grand final act of the bull market. It will be the best it has ever been and it will be the best we're going to see it in a significant amount of time.
If markets continue higher at the same or steeper angles than the recent climbs (Especially if there's no big pullbacks) I think we'll have seen every single major warning signal there was at the top of rallies that would turn into multiple decade bears.
US500FU trade ideas

S&P 500 Intra-day Analysis 25-Apr 2025The markets currently are showing some relief after China's decision to exempt certain U.S. goods from tariffs.
Potential scenarios for intra-day moves:
• Price recently touched the lower end of the range around $5,520 and then moved up. If this upward move continues, it could test the top of the range near $5,550. If that level is passed, the next area to keep an eye on might be around $5,660.
• If the price drops below $5,500, it could mean sellers are gaining strength, and the next level to watch could be around $5,360.
• If the price also goes below $5,320, then the $5,200 level might become the next important zone to monitor.
Disclaimer: easyMarkets Account on TradingView allows you to combine easyMarkets industry leading conditions, regulated trading and tight fixed spreads with TradingView's powerful social network for traders, advanced charting and analytics. Access no slippage on limit orders, tight fixed spreads, negative balance protection, no hidden fees or commission, and seamless integration.
Any opinions, news, research, analyses, prices, other information, or links to third-party sites contained on this website are provided on an "as-is" basis, are intended only to be informative, is not an advice nor a recommendation, nor research, or a record of our trading prices, or an offer of, or solicitation for a transaction in any financial instrument and thus should not be treated as such. The information provided does not involve any specific investment objectives, financial situation and needs of any specific person who may receive it. Please be aware, that past performance is not a reliable indicator of future performance and/or results. Past Performance or Forward-looking scenarios based upon the reasonable beliefs of the third-party provider are not a guarantee of future performance. Actual results may differ materially from those anticipated in forward-looking or past performance statements. easyMarkets makes no representation or warranty and assumes no liability as to the accuracy or completeness of the information provided, nor any loss arising from any investment based on a recommendation, forecast or any information supplied by any third-party.

The Bear Is Dead. Long Live the Bull.From Fakeout to Full Send - SPX Flips Bullish
You could almost hear the financial media pop champagne today.
“Markets Surge Amid Easing Trade Tensions” they yelled.
“Global confidence returns!” they assured.
And sure, that’s a cute story.
But for us, Wednesday’s bear push now looks like a feint. A setup. A spring.
By Friday, the bull had not only taken the ball - it ran with it.
That V-shaped reversal pattern on the daily chart? It’s live. And it’s loud.
Technically, it’s now pointing to a projected upside of 6106.
That’s not just some random number. That’s the prior range high zone coming back into focus.
And in case you needed a reminder…
The bear is dead. Long live the bull. (until it isn't)
---
SPX Market View - Bullish Flip Confirmed
Wednesday gave us a classic tease.
Bearish energy. A flicker of downside. But it fizzled fast.
Then came Thursday - and with it, a clean sweep into Friday.
The V-shaped daily reversal triggered.
Price pushes off the lows
Sentiment flipped
And a new upside target emerged at 6106
It’s not just technical fluff. This level marks a structural return to the previous range highs - a natural magnet for bullish continuation.
Meanwhile, I’ve done a bit of chart housekeeping myself.
After two months of letting bias sneak in and lines and notes multiply like rabbits, I’ve hit the reset button.
🧹 Clean charts. Clean mind. Just the essentials.
The direction has changed - and I’m treating it with fresh eyes.
One line I am keeping?
5400. It’s been the pivot point for weeks. A battle-tested zone. It now serves as the bull’s first major checkpoint.
If price respects that level on any dip, it’s game on.
And if we breach it? That’s when the doubt returns.
---
💡Expert Insights: Common Trading Mistakes & How to Avoid Them
MISTAKE: Letting cluttered charts and old bias cloud current decisions.
FIX:
Regularly clean your charts — strip them down to what matters.
Use setups that speak for themselves (like the V-shape).
Don’t bring yesterday’s opinion into today’s trade.
A new direction demands a new perspective. And as price shifts, so must your lens.
---
🗞️Rumour Has It…
BREAKING:
Powell Declares Bull Market, Blames Moon Phase for Midweek Bear Tease
Financial news outlets were caught scrambling when the SPX reversed higher through thursday despite Wednesday’s doom-and-gloom.
“Clearly the moon was in retrograde,” Powell reportedly muttered, while clutching a Fibonacci ruler.
In other news, China's trade delegation released a statement saying, “We’re not sure what’s happening either.”
(This section is entirely made-up satire. Probably.)
---
🤯Fun Fact - The Original “Clean Chart” Addict Was… Jesse Livermore
Before indicators, algos, and triple-screen madness, Jesse Livermore – the OG speculator – was famous for trading from price and price alone.
In fact, he refused to use charts with clutter.
He would manually draw his price levels, log his trades by hand, and sometimes go days without placing a trade – waiting for the market to tip its hand.
His trading edge?
Patience.
Price action.
And a clean, unobstructed read.
One of his favourite tricks?
He’d mentally mark key inflection levels (like your 5400) and wait until price either exploded past or rejected hard before acting.
So next time you reset your chart – you’re not just decluttering…
You’re channelling Livermore.

S&P 500: The Indicator to Watch Right NowWith US stocks bouncing on Trump’s backtracking over tariffs — just weeks after a 20% correction — it’s fair to say caution is the name of the game. Even though the headline risk has eased slightly, markets are still navigating through a fog of geopolitical noise and economic uncertainty.
In moments like these, where the fundamental picture feels muddy at best, objective technical analysis can offer clarity — not crystal-ball predictions, but structure and focus.
The Traditional Technical Backdrop
Traditional technical analysis isn’t about magic lines on a chart — it’s about mapping out price behaviour with tools that help us stay grounded. Structural levels, trendlines, and a couple of moving averages might seem basic, but they’ve stood the test of time because they do something incredibly useful: they make sense of chaos.
In the case of the S&P 500, several key structural levels should anchor any serious analysis. We’ve got the pre-sell-off highs from February, the April lows, and two interim levels — broken support levels that flipped to resistance during retracement rallies between February and April. These levels now act like milestones in the market’s memory.
Drawing a downward-sloping trendline through the swing highs during the correction gives us a good sense of the broader downtrend. More recently, we’ve also started to see a modest uptrend emerge from the April lows. That creates something of a wedge formation — a narrowing range that’s coiling tighter as buyers and sellers battle it out.
Simple moving averages like the 50-day and 200-day are useful additions here. While they’re lagging by nature, they give us immediate context for where price sits in relation to recent momentum and long-term sentiment.
US500 Daily Candle Chart
Past performance is not a reliable indicator of future results
The Indicator to Watch
There’s a good argument to be made that the most important indicator to watch right now, with the S&P 500 trying to claw back ground, isn’t a moving average or RSI — it’s Anchored VWAP.
Anchored Volume-Weighted Average Price (VWAP) is one of the most effective ways to cut through the noise and see who’s really in control — buyers or sellers. It tells you the average price that traders have paid for the index, weighted by volume, since a specific event or turning point. And unlike regular VWAP that resets daily, Anchored VWAP lets us choose a significant date and track how price interacts with that “anchor.”
If we anchor the VWAP to the February highs, we’re essentially tracking how the market has performed relative to that peak. This anchored VWAP line becomes a kind of gravity — it reflects the average cost basis of those who bought just before the sell-off. If price remains below it, it tells us those buyers are still underwater, and therefore less likely to add risk. Sellers, in that case, still hold the advantage.
On the flip side, if we anchor VWAP to the April lows, we get the average cost basis of the recent bounce. This line reflects where more optimistic, bottom-fishing buyers stepped in. If price holds above this level, it suggests those participants remain in profit — and potentially willing to buy dips.
Right now, the S&P 500 is stuck in a battle between these two anchored VWAP levels. One tracks the pain, the other tracks the hope. It’s a VWAP funnel, and it won’t last forever. Eventually, price will break above one and leave the other behind — and when it does, we’ll have an objective answer as to which side is winning.
Will it be the late bears holding on from February’s highs, or the early bulls from the April lows? The answer is coming. Keep your eyes on the anchored VWAPs — they’re telling the real story.
US500 Daily Candle Chart
Past performance is not a reliable indicator of future results
Disclaimer: This is for information and learning purposes only. The information provided does not constitute investment advice nor take into account the individual financial circumstances or objectives of any investor. Any information that may be provided relating to past performance is not a reliable indicator of future results or performance. Social media channels are not relevant for UK residents.
Spread bets and CFDs are complex instruments and come with a high risk of losing money rapidly due to leverage. 83% of retail investor accounts lose money when trading spread bets and CFDs with this provider. You should consider whether you understand how spread bets and CFDs work and whether you can afford to take the high risk of losing your money.

Another AB=CD formation for the S&P 500?Following a low of 4,835 on 7 April – which touched gloves with an ‘alternate’ AB=CD support (1.272% Fibonacci projection ratio) at 4,983 – the S&P 500 index is on course to pencil in an ‘equal’ AB=CD resistance (100% projection ratio) at 5,746. Notably, the 5,746 level is accommodated by a 1.618% Fibonacci projection ratio at 5,718, as well as a nearby 61.8% Fibonacci retracement ratio at 5,652.
Also of technical relevance, the market index has completed the dreaded ‘Death Cross’, which is the 50-day SMA at 5,645 crossing below the 200-day SMA at 5,746 (converges with the above-noted resistance zone), and suggests that a longer-term downtrend could be on the cards.

S&P500 Index End of Day Trend AnalysisS&P 500 Index Outlook:
The index may experience bearish momentum starting around April 25th or 28th, with key support at 5160. If this level holds and bearish confirmation does not emerge, the bullish trend is expected to continue toward the target of 6109.
Traders should wait for a confirmed short signal before considering bearish positions. Otherwise, the ongoing bullish momentum is likely to persist. The MastersCycle indicator has signaled a buy, with a suggested stop-loss at 5100.
Disclaimer: This is a personal market view. Traders are encouraged to rely on their own technical analysis and always trade with an appropriate stop-loss.

SPX with 2 Zweig breadth thrust indicatorsMost argue that Zweig breadth thrust was triggered on 4/24. 2 indicators for interested people to check it out.

SPX on threshold of bullish breakout? I am cautiously bullishNations may be lining up to kiss Trump's a??? but SPX has come to kiss a confluence of trendline resistance as well as POC
Also markets we approaching month end. You only need to look at the past month ends and see what happens to the price, yes they tend to reverse very often if not always, specially if the prices are below 200 ema as it is now.
I would be watching how the market behaves next week. Soft economic data are pointing to weaker economy and the underlying problem of highly leveraged Hedge Funds remain. I wonder if they begin to deleverage some more at this level.
Any future decline would be a good entry point

US500 LIVEHello friends
Given the price rise and correction we had, we can open a position with capital and risk management.
*Trade safely with us*

$SPX Bull/Bear Line in the Sand – Fireworks Ahead?The S&P 500 ( SP:SPX ) is sitting just below a clear resistance level—a true bull/bear line in the sand.
On the one hand, bulls are eyeing a potential breakout into the weekend that could ignite a short squeeze or continuation rally. 🎆 On the other, Deutsche Bank, the last of the major bulls, has thrown in the towel—cutting their year-end target from 7,000 to 6,150 amid economic concerns.
This is where things get interesting. If we break above this resistance with volume, expect upside momentum. If not… this could be the start of a deeper rollover.
👉 Watch that overhead line closely. It's the fuse. 💣
🟢 Breakout = bull party
🔴 Rejection = potential for bearish reversal

Option Insights – Trading the Greeks (Part 2 of 4):Gamma Effects# Option Insights – Trading the Greeks (Part 2 of 4)
## Option Convexity and Gamma Effects
### Gamma – The Convexity of Options
Gamma measures how much the Delta of an option changes in response to movements in the underlying asset’s price. Mathematically, it is the second derivative of the option’s value with respect to the price of the underlying. In simpler terms, Gamma quantifies the curvature—or convexity—of the option’s price sensitivity.
- Positive Gamma: Accelerating Delta as the underlying moves.
- Negative Gamma: Decelerating Delta as the underlying moves.
This convexity becomes especially important for traders managing exposure. A directional trader might seek:
- Positive Gamma near anticipated breakouts to increase exposure during favorable moves.
- Negative Gamma in areas where they want to taper exposure, such as in covered call setups (where the short call reduces gains as price rises).
---
## Gamma and Delta Hedging
Traders who Delta hedge their option positions using the underlying (or a Delta-1 instrument) face the reality of nonlinearity: Delta changes as the market moves, and Gamma determines how fast.
In practice, this means hedgers must adjust frequently to maintain a neutral Delta—Gamma tells them how often and how aggressively.
---
## Hedging a Position with Positive Gamma
When hedging and holding positive Gamma:
- If the underlying price rises → Delta increases → Sell the underlying.
- If the underlying price falls → Delta decreases → Buy the underlying.
This results in countercyclical trading, i.e., trading against the market trend.
**Advantages:**
- Potentially dampens volatility.
- Allows for limit order execution (e.g., sell at offer when price rises), capturing bid-offer spreads.
- Automated or semi-automated setups possible.
---
## Hedging a Position with Negative Gamma
With hedging and holding negative Gamma, the adjustments are procyclical:
- Price rises → Delta drops → Buy more underlying.
- Price falls → Delta rises → Sell more underlying.
**This means:**
- You're chasing the market, increasing exposure in the direction of the move.
- You likely cross the spread to ensure execution (lifting the offer or hitting the bid).
- This behavior tends to amplify volatility and incurs transaction costs.
---
## Summary: Gamma's Impact on Hedging
- Long Gamma → Hedge countercyclically, dampen market movements, and potentially profit from spreads.
- Short Gamma → Hedge pro-cyclically, amplify market movements, and pay the spread.
This distinction underscores a critical point: hedging Delta is not just about neutralizing exposure—it’s about managing how that exposure evolves, which is precisely what Gamma represents.
---
## Can You Hedge Delta Without Gamma Risk?
**In theory?** Yes.
**In practice?** Not really.
Hedging an option (a nonlinear instrument) with the underlying (a linear one) means you’re using a linear approximation of a curved payoff structure. This hedge is only locally accurate—it must be rebalanced frequently to remain effective.
While it’s theoretically possible to hedge both Delta and Gamma using other options, this introduces complexity:
- Other Greeks (like Theta and Vega) enter the equation.
- Option hedges are often illiquid, expensive, or difficult to scale.
For most traders, hedging Delta with the underlying remains the simplest, most liquid, and most cost-effective approach—despite the need for Gamma-based adjustments.
---
## Gamma Trading & Gamma Scalping
Even in non-directional strategies, Gamma has value.
Gamma scalping involves actively trading the underlying around an options position to exploit short-term price swings:
- You buy low and sell high as the underlying fluctuates,
- Profiting from volatility, not direction.
This is a powerful technique for monetizing Gamma, particularly when implied volatility is elevated relative to realized moves.
---
## Coming Up Next:
📘 Part 3: Gamma Scalping – Monetizing Convexity Through Active Hedging
by parsifaltrading

Option Insights – Trading the Greeks (Part 1 of 4): Delta Target# Option Insights – Trading the Greeks (Part 1 of 4)
## Delta Targeting
Options are often utilized by traders as a leveraged tool, akin to generating lottery tickets. By selecting the appropriate expiration time and strike price, it's possible to achieve significant leverage on an underlying asset, potentially yielding high profits in percentage terms, albeit with a low probability of occurrence.
However, trading options offers more than just directional bets on the underlying asset. Due to their dependence on various factors with distinct characteristics, option strategies enable flexible exposure management and innovative risk profiles.
To fully exploit the potential of options, risk factors are quantified using the **Greeks** – Greek letters (not all of them) that assess the sensitivity of option prices to changes in different risk factors ("primary Greeks") or second-order effects ("secondary Greeks").
### Primary Greeks:
- **Delta** – sensitivity to changes in the underlying price
- **Theta** – sensitivity to changes in time
- **Vega** – sensitivity to changes in implied volatility
- **Rho** – sensitivity to changes in interest rates
### Secondary Greeks:
- **Gamma** – rate of change of Delta with respect to the underlying
- **Vanna** – rate of change of Delta with respect to implied volatility
- **Charm** – rate of change of Delta with respect to time
- **Volga** – rate of change of Vega with respect to implied volatility
For trading purposes, **Delta, Gamma, Theta, and Vega** are the most critical Greeks.\
They are depicted in the introductory graphs for Call Options, showing their behavior as a function of the underlying price across various levels of implied volatility.
*(Graphs not shown here — you can add screenshots as image uploads if needed.)*
---
## Trading the Greeks: Delta
The art of trading options is fundamentally the art of managing an option portfolio by **trading the Greeks**. For short-term options (from same-day expiration, or 0DTE, up to about three months), **Delta** is the dominant risk factor. The influence of other Greeks is limited to a narrow range around the strike price — this range becomes even narrower as expiration approaches.
When managing an options position, **controlling Delta is the first and most critical step**.
- Delta values range from 0% to 100% for long calls and short puts
- From -100% to 0% for long puts and short calls
- Delta represents the participation rate of an option in the underlying asset’s price movement
Example:\
If an option has a Delta of 40% and the underlying asset moves by 10 points, the option’s price will typically move by approximately 4 points in the same direction.
Delta can also be loosely interpreted as the **implied probability** that the option will expire in the money — though this is only an approximation.
---
## Delta-Neutral Strategy
The most common Delta-targeting strategy is the **Delta-neutral strategy**.
It aims to hedge the Delta of an options position by taking an **offsetting position in a Delta-1 instrument**. These instruments replicate the price movements of the underlying asset (e.g., the underlying itself, ETFs, futures, or CFDs).
### Example:
- If an options position has a Delta of 40% and a notional exposure of 100 units
- → Take a short position in 40 units of the underlying (or equivalent Delta-1 instrument)
But:\
Delta is **not constant** — it evolves over time (**Charm**), with price changes (**Gamma**), and with changes in implied volatility (**Vanna**).\
This means the hedge must be **adjusted regularly** to maintain Delta neutrality.
Adjustments are typically:
- Made at discrete intervals (e.g., daily)
- Or when Delta changes by a set amount (e.g., more than 5%)
---
## Delta Target Strategy (More General)
The Delta-neutral strategy is a **specific case** of a broader **Delta target strategy**, where the Delta target is explicitly set to zero.
### Who uses Delta target strategies?
- Option **market makers** to hedge inventory
- Traders aiming to **isolate other risk factors** (e.g., volatility premium strategies like short strangles)
These traders seek to:
> **Capture the volatility premium** — the difference between implied volatility at entry and realized volatility after
Delta target strategies with **non-zero targets** are used for managing portfolio-level risk when options are used alongside other instruments.
---
## Why Adjust Delta Target Strategies?
The main reasons for adjusting:
- **Gamma (convexity)**: Delta changes as the underlying moves
- **Time decay**:
- For OTM options: Delta decreases (calls), increases (puts)
- For ITM options: Opposite behavior
- **Changes in implied volatility or skew**: also affect Delta
---
## Coming Up Next:
📘 *Part 2: The Concept of Convexity and the Role of Gamma in Managing Delta Target Strategies*
---


S&P500 INTRADAY resistance at 5510Stocks are pulling back after Wednesday’s rally, pressured by renewed trade tensions. China stated that no deal talks are underway, and Treasury Secretary Scott Bessent expressed scepticism over resolving the trade dispute. US futures slipped, the dollar weakened, and gold rose as investors sought safety.
Jefferies strategist Christopher Wood warned that US equities, Treasuries, and the dollar may face further downside, noting the market has likely peaked. Deutsche Bank also trimmed its S&P 500 target, citing the negative impact of ongoing tariffs on US companies.
It’s a packed earnings day: PepsiCo, Procter & Gamble, and American Airlines report before the open, while Alphabet and Intel are set to release results after the close.
Key Support and Resistance Levels
Resistance Level 1: 5510
Resistance Level 2: 5660
Resistance Level 3: 5790
Support Level 1: 5110
Support Level 2: 4950
Support Level 3: 4815
This communication is for informational purposes only and should not be viewed as any form of recommendation as to a particular course of action or as investment advice. It is not intended as an offer or solicitation for the purchase or sale of any financial instrument or as an official confirmation of any transaction. Opinions, estimates and assumptions expressed herein are made as of the date of this communication and are subject to change without notice. This communication has been prepared based upon information, including market prices, data and other information, believed to be reliable; however, Trade Nation does not warrant its completeness or accuracy. All market prices and market data contained in or attached to this communication are indicative and subject to change without notice.

S&P 500 Ready for another leg lower ?S&P recovering back to an area where is flipped back and forth after the drop yesterday ( Ellipse on chart ).
Negative China headlines in the background from earlier this morning , but US traders choosing to ignore them early on .
There's good volume and resistance up here ( blue line)- and in the absence of any positive news on tariffs it looks like it should move lower this afternoon .
Sell at current levels 5370
Stop at 5410
Target 5295
E

Narrative Noise vs. System ClarityApparently, the market was “uncertain” today.
Somewhere between Trump retracting his Powell shade, the Fed playing PR dodgeball, and tariffs being simultaneously on and off the table… headlines were doing what they do best: explaining yesterday with confidence.
But the chart?
The chart spoke first.
We came into the session ready for bullish confirmation.
Instead, we got a clean rejection of 5400, with early signs of downside pressure before lunch.
This is why we follow price, not PR.
Today’s action didn’t invalidate the bull bias completely, but it sure made the case that bears aren’t done just yet.
Let’s unpack what we saw and where we’re headed next.
---
Additional images mentioned can be seen on my main blog
---
SPX Market Outlook - Structure Rejected, Futures Rolling
While the headlines continue to spin post-news confusion, the price action remains our guide.
Yesterday, we came into the session prepared for a bullish continuation, but 5400 acted as a firm barrier once again.
The daily chart showed a clear rejection, and despite the bullish lean in the morning, the structure leaned bearish by session’s end.
Now, as I write this before the cash open, overnight futures are pushing lower, indicating potential follow-through.
That doesn’t confirm anything just yet - but it does tilt the bias.
Here’s what I’m watching:
5400 = still key resistance
5300 = GEX flip level - will reassess bearish view if we break and hold below it
5000 remains the target for the Wolfe pattern continuation
Upper Bollinger tag is in - another technical sign of short-term exhaustion
No bear pulse bar yet, but a clean V-shaped reversal is visible on the chart
ADD remains near bull extreme - offering more bear potential than bull in the short term
Bias remains bearish below 5300, and I’ll reassess to add in below that level.
---
GEX Analysis Update
5500 - 5400 - 5350 all look interesitng levels
5300 is the current flip point
---
Expert Insights: React to Price, Not PR
❌ Mistaking news for a setup
Narratives are seductive. They come with headlines, urgency, and lots of confident pundits.
✅ Stick to the chart
Price told us today’s story long before CNBC tried to.
5400 rejection. No pulse bar. Bullish exhaustion on ADD.
That's not confusion. That's confirmation — if you're paying attention.
---
Rumour Has It…
Trump was overheard saying, “Maybe Powell’s alright. Maybe.” Dow gained 0.3% and then shrugged.
5400 is reportedly suing for emotional damages after being rejected for the third time this month.
A Wolfe Wave ghost briefly appeared on the chart, waved, and vanished near 5300.
(This section is entirely made-up satire. Probably.)
---
Fun Fact - News Always Arrives After Price
Markets don’t wait for clarity.
They move first, then the headlines scramble to explain why.
The pattern is timeless:
Price shifts.
Smart traders react.
Media catches up.
Retail says, “Oh, THAT’S why.”
Yesterday was no exception.
So if the news says “flat and uncertain,” but the chart shows a failed breakout, don’t wait for a CNBC blessing to press the button.
The system already said what it needed to say.

US500 - Will the stock market go up?!The index is located between the EMA200 and EMA50 on the four-hour timeframe and is trading in its descending channel. If the index moves down towards the specified demand zone, we can look for the next Nasdaq buying positions with an appropriate risk-reward ratio. The channel breakdown and the index entering the supply zone will provide us with its next selling position.
The chief economist at Citigroup has stated that the imposition of tariffs in the United States constitutes a stagflationary shock to the economy. According to his estimates, there is a 40% to 45% chance of a recession. It is expected that GDP will increase in the second quarter, as consumers rush to make purchases ahead of the new tariffs. However, the most significant negative impact on U.S. economic growth is projected to unfold in the second half of the year.
You may have noticed that recent economic statistics are no longer moving markets. The reason is simple: markets are forward-looking and trade on expectations rather than past data. Economic figures reflect what has already occurred, while market pricing focuses on what lies ahead.
At this stage, current data has yet to fully reflect the impact of tariffs and trade tensions. Even if weaker numbers emerge, markets may have already priced in the potential resolution of the trade war and an eventual recovery.
Experienced traders understand that today’s developments are already factored into prices. What matters now is the outlook for the coming months—the real driver of market direction.
Ryan Petersen of Flexport noted yesterday that, three weeks after the U.S.imposed heavy tariffs on Chinese imports, bookings for ocean freight containers have dropped more than 60% industry-wide. He explained that the U.S. imports around $600 billion worth of goods annually from China, with those items valued at approximately $2 trillion at the retail level.
He stated that the first ships carrying goods fully subject to the new tariffs arrived on Monday, and shipping volumes are expected to decline in the coming weeks. However, due to high inventory levels, the impact on the retail sector may be delayed.
Petersen also expressed concern that a potential rollback of tariffs could introduce a new set of challenges. With ships currently being repositioned globally, a sudden wave of new orders could disrupt logistics networks—especially if markets perceive the suspension of tariffs as only temporary.
In my view, no one really knows how this situation will evolve, as a large portion of imports consists of intermediate goods and components used in final products. My guess is that this could lead to a surge in transshipment and even smuggling, though it could just as easily echo the unexpected consequences seen during the COVID era. We are truly venturing into uncharted territory.
Petersen concludes: “This is a strange era for global logistics, as we must simultaneously prepare for the unimaginable—like full U.S. self-sufficiency—while also planning for a return to something closer to normal trade relations.”

What Is the Advance-Decline (A/D) Line, and How Can You Use ItWhat Is the Advance-Decline (A/D) Line, and How Can You Use It in Trading?
The Advance-Decline (A/D) Line is a widely used market breadth indicator that provides insights into the strength of trends by tracking advancing and declining stocks. Popular among traders analysing indices like the NASDAQ, it helps identify broad participation or hidden divergences. This article explores how this indicator works and its role in effective market analysis.
What Is the Advance-Decline Line?
The Advance-Decline (A/D) line, also known as the Advance-Decline Index, is a popular market breadth indicator used to gauge the overall health of a market's movement. Instead of focusing solely on price changes in an index, it analyses how many stocks are participating in the market's rise or fall. This makes it particularly useful for traders looking to understand whether a trend is supported by widespread participation or driven by just a handful of stocks.
The indicator can be set up based on stocks on different exchanges. For example, a NYSE Advance-Decline line provides insights into NYSE-listed stocks. However, it can be applied to any index or exchange, resulting in the Nasdaq Advance-Decline line or a line based on stocks listed in the UK, Australia, Europe, or Japan.
At its core, the A/D line is a cumulative measure of the net advances of stocks on a given day. The calculation is as follows:
1. Count the number of advancing stocks (those that closed higher than their previous close).
2. Count the number of declining stocks (those that closed lower than their previous close).
3. Subtract the number of declining stocks from the advancing stocks to get the net advance.
4. Add this net advance to the previous day’s A/D line value.
Formally, the Advance-Decline line formula is:
Net Advances = Advancing Stocks − Declining Stocks
Current A/D Line Value = Previous A/D Line Value + Net Advances
For example, if 500 stocks advanced and 300 declined on a given day, the net advance would be +200. If yesterday’s A/D Line value was 10,000, today’s value would be 10,200. Over time, these daily values form a line that tracks the cumulative net advances.
The indicator provides insights into sentiment. A rising line indicates more advancing stocks than declining ones, while a falling line suggests the opposite. Traders often use this data to determine whether a price trend in an index reflects broad strength or is being carried by a few heavyweights.
Understanding Market Breadth
Market breadth measures the extent to which individual assets are contributing to a market's overall movement, providing a clearer picture of the strength or weakness behind trends. Rather than relying solely on an index's price performance, breadth gives traders insights into how widespread participation is within a rally or decline. This information is crucial for understanding whether market moves are broad-based or concentrated in a few influential assets.
A market with a strong breadth typically sees most stocks or assets moving in the same direction as the overall trend. For example, during a rally, broad participation—where a large percentage of assets are advancing—signals a robust and healthy trend. Conversely, weak breadth occurs when only a small group of assets drives the movement, potentially indicating fragility in the trend. This is especially important in large indices where a few heavily weighted assets can mask underlying weaknesses.
How Traders Use the A/D Line
The A/D Line is more than just a market breadth indicator—it’s a practical tool traders use to gain insight into the strength and sustainability of trends. By analysing how the indicator behaves in relation to price movements, traders can uncover potential hidden opportunities and spot potential risks. Let’s consider how the Advance-Decline line behaves on a price chart.
Identifying Trend Strength
One of the A/D Line’s key uses is evaluating the strength of a market move by examining overall participation. When both the A/D Line and an index rise together, it suggests widespread buying activity, with most stocks contributing to the rally. Similarly, if both the index and the A/D Line decline, it often reflects broad-based selling, indicating that weakness is widespread across the market rather than concentrated in a few assets.
Spotting Divergences
Divergences between the A/D line and price are closely watched by traders. For instance, if an index continues to rise but the A/D line starts declining, it could signal that the trend is losing momentum. Conversely, when it begins rising ahead of a price recovery, it may suggest underlying strength before it becomes apparent in price action.
Complementing Other Indicators
Traders often pair the A/D line with other tools to refine their analysis. For example, combining it with moving averages or oscillators like RSI can help confirm signals or highlight discrepancies. A rising A/D line alongside RSI rising above 50 might reinforce the possibility of a price rise.
Strengths of the A/D Line
The A/D line is a widely respected tool for understanding market dynamics, offering insights that price-based analysis alone can’t provide. Its ability to measure participation across a broad range makes it especially valuable for traders looking to assess sentiment and trend reliability. Let’s explore some of its key strengths.
Broad Market Perspective
The A/D line captures the performance of all advancing and declining stocks within an index, offering a comprehensive view of how much support a trend has. Instead of focusing solely on a handful of large caps that often dominate indices, the indicator reveals whether the majority are moving in the same direction. This helps traders gauge the true strength of a rally or decline.
Early Warnings of Weakness or Strength
Divergences between the A/D line and the price can act as an early signal of potential changes in momentum. When the A/D Line deviates from the overall trend, it can highlight areas where market participation is inconsistent. This allows traders to assess whether a trend is gaining or losing support across a broad range of assets, offering clues about potential shifts before they fully materialise in price action.
Applicability Across Markets
Another strength is its versatility. The A/D line can be applied to indices, sectors, or even individual markets, making it useful across various trading strategies. Whether monitoring a broad index like the S&P 500 or a specific sector, the indicator can be adapted to provide valuable insights.
Limitations of the A/D Line
While the A/D line is a useful tool for analysing breadth, it isn’t without its limitations. Traders need to understand its drawbacks to use it effectively and avoid potential misinterpretations. Here are some of the key challenges to consider.
Ignores Stock Weighting
One major limitation is that the A/D index gives equal weight to every stock, regardless of size or market capitalisation. In indices like the S&P 500, where a small number of large-cap stocks often drive performance, this can create a disconnect. For example, a large-cap stock’s strong performance might lift an index while the indicator shows weakness due to low-caps underperforming.
Vulnerability to Noise
The index can produce misleading signals in certain conditions, such as during periods of low trading volume or heightened volatility. Market anomalies, such as large fluctuations in a small number of stocks, can skew the indicator and make it less reliable. This can be especially problematic in thinly traded assets or at times of high speculation.
Not a Standalone Indicator
The A/D line is combined with other tools. On its own, it doesn’t account for factors like momentum, valuation, or sentiment, which can provide critical context. Traders relying solely on it may miss out on key details or overemphasise its signals.
Comparing the A/D Line with Other Market Breadth Indicators
The A/D Line is a powerful tool, but it’s not the only market breadth indicator traders use. By understanding how it compares to other indicators, traders can select the one that suits their analysis needs or combine them for a more comprehensive view.
A/D Line vs Advance-Decline Ratio
The A/D Ratio measures the proportion of advancing to declining stocks. While the A/D line provides a cumulative value over time, the ratio offers a snapshot of market breadth for a single trading day. The A/D Ratio is often better for identifying short-term overbought or oversold conditions, whereas the A/D line excels at tracking long-term trends.
A/D Line vs McClellan Oscillator
The McClellan Oscillator uses the same advancing and declining stock data but applies exponential moving averages to calculate its value. This approach makes the McClellan Oscillator more sensitive to recent market changes, allowing it to highlight turning points more quickly than the A/D line. However, the A/D line’s simplicity and cumulative nature make it more straightforward to interpret for broader trend analysis.
A/D Line vs Percentage of Stocks Above Moving Averages
This indicator tracks the percentage of stocks trading above specific moving averages, such as the 50-day or 200-day. While the A/D line focuses on daily advances and declines, the moving average approach highlights whether stocks are maintaining longer-term momentum. The A/D line provides a broader perspective on participation, whereas this indicator zeros in on sustained trends.
The Bottom Line
The Advance-Decline line is a valuable tool for traders seeking deeper insights into market trends. By analysing market breadth, it helps identify potential opportunities and risks beyond price movements alone.
FAQ
What Is the Meaning of Advance-Decline?
Advance-decline refers to the difference between the number of advancing stocks (those that closed higher) and declining stocks (those that closed lower) on a specific trading day. It’s commonly used in market breadth indicators like the NYSE Advance-Decline line to measure the overall strength or weakness of the market.
How to Find Advance-Decline Ratio?
The Advance-Decline ratio compares advancing stocks to declining stocks in an index. It is calculated by dividing the number of advancing stocks by the number of declining stocks.
How to Use an Advance-Decline Line Indicator?
The A/D line indicator tracks the cumulative difference between advancing and declining stocks. Traders analyse its movement alongside price trends to assess market participation. For example, divergence between the A/D line and an index price direction can signal potential changes in momentum.
What Is the Advance-Decline Indicator Strategy?
Traders use the Advance-Decline indicator to analyse market breadth, identify divergences, and confirm trends. For example, a rising A/D line with an index suggests broad participation, while divergence may signal weakening trends.
This article represents the opinion of the Companies operating under the FXOpen brand only. It is not to be construed as an offer, solicitation, or recommendation with respect to products and services provided by the Companies operating under the FXOpen brand, nor is it to be considered financial advice.

SP500 remains very bearish overall📈 In my previous post, I highlighted the confluence support zone and the potential for a bounce — and we got it. SP500 rallied around +10% off the lows.
But let’s not get too comfortable...
❓ I s the worst behind or is this just a trap before the next leg down?
From my perspective, the correction is not over.
The current bounce looks more like a bear market rally than a true reversal.
📉 Why I expect another drop:
1. Technically, as long as SP500 is trading below 5500-5600 zone, the structure remains bearish
2. Fundamentally, the backdrop hasn’t improved — if anything, it’s getting worse
3. Price is approaching a major resistance zone, which I plan to sell into
📌 My Plan:
I’m watching this zone for signs of weakness.
If momentum fades, I’ll look to short, targeting at least 5k, potentially even a new local low.
Disclosure: I am part of Trade Nation's Influencer program and receive a monthly fee for using their TradingView charts in my analyses and educational articles.

US500 Day Trade Setup: Liquidity Pools, Gaps & What’s Next?The US500 (S&P 500) 4-hour chart recently showed a gap up, followed by a strong move into the previous range highs. This price action likely triggered buy stops and tapped into buy-side liquidity above the prior swing highs. After this liquidity sweep, the market has pulled back and is now consolidating just above a visible gap, which sits slightly below the current price level.
From a Wyckoff perspective, this resembles an upthrust after distribution, where price runs stops above resistance before reversing. The current pullback suggests a potential test of the gap area, which often acts as a magnet for price, especially if there’s unmitigated liquidity left behind.
Using ICT (Inner Circle Trader) concepts, the recent move above the range high can be seen as a raid on buy-side liquidity, followed by a retracement. The gap below current price represents an imbalance, and ICT traders often look for price to revisit such inefficiencies before resuming the trend.
🌐 Fundamental & Sentiment Backdrop
Recent data shows the S&P 500 has experienced a sharp correction in April, with a monthly drop of about 5.75% from the previous month, but it remains up 6.8% year-over-year (YCharts). The market has been volatile, with sentiment shifting due to macroeconomic concerns, including renewed trade tensions (notably new tariffs), a mixed earnings season, and questions about the Federal Reserve’s next moves (IG).
Wall Street analysts have recently revised their year-end targets lower, citing increased risks from tariffs and slowing earnings growth (Yahoo Finance). The VIX is elevated (28.45), and the put/call ratio is above 1, indicating heightened hedging and caution among market participants (YCharts).
🏦 Wyckoff & ICT Concepts in Play
🏗️ Wyckoff: The recent rally into the highs and subsequent pullback fits the upthrust after distribution narrative. If the market fails to reclaim the highs, a move back into the gap (potentially as a sign of weakness) is likely.
💧 ICT: The gap below current price is a clear area of interest. If price trades down to fill this gap, watch for a reaction—either a bounce (if demand steps in) or a continuation lower if the gap fails to hold.
💡 Day Trade Idea (Not Intra-day)
Scenario: If price trades down to fill the gap just below the current level (around 5,300–5,320), monitor for a bullish reaction (such as a strong daily close, a bullish order block, or a clear rejection wick).
Trade Plan:
🕵️♂️ Wait for price to fill the gap and show a bullish daily signal.
🎯 Enter a day trade long at the next day’s open if confirmation is present (e.g., a bullish daily candle close or a break above the previous day’s high).
🛑 Place a stop loss just below the gap or the most recent swing low.
📈 Target the previous high near 5,400 for a day trade, or consider scaling out if momentum continues.
Alternative: If price fails to hold the gap and closes below it on the daily chart, consider a day trade short the following day, targeting the next liquidity pool below (e.g., 5,200).
⚠️ Disclaimer
This analysis is for educational purposes only and does not constitute financial advice. Trading involves risk, and you should do your own research or consult with a professional before making any trading decisions. Past performance is not indicative of future results.

Updated levels for SP500 buy/hold/sell zonesDrawn-in areas represent red/ylw/grn sell/hold/buy zones
Crash? Here's the case for a crash.
You may have noted I can, on occasion, be a bit of a bearish guy - but I don't actually use the word "Crash" all that much. Not all bear setups are crash setups. Even when they will be, a less dramatic bear move usually happens before a crash. The times when there's actual crash risk are low - but we have a confluence of them now.
Let's run through some crash signals.
1 - Pending 1.61 break. In any self respecting crash (anyone you know by a number for sure) the crash clearly picks up on a 1.61 break. If we drop again, we threatening that break.
www.tradingview.coem
Examples:
All the good ones, and other ones. Go look. You'll find over and over a downtrend transitions to a crash under the 1.61. The 1.61 either does not break- or we crash.
We currently have a bounce off the 1.27, retest of the previous structure and possible new sell off coming - these are things that can precede a 1.61 break.
Looking at local structure, this looks like a butterfly correction. Which is often found at or before the MIDDLE of a trend (crash).
Or an ABC.
Which would predict a drop stronger and bigger than the first (crash).
Then you have things like the 200 SMA bounce, those can get sketchy if there's a new low.
...Crash.
And we have the reason. Because although the technical norms I've explained here have been features in every notable crash ever, there was always a reason. Always something that would not be foreseeable with TA and would make the crash appear to be unpredictable.
The things that just seem too weird to be true unless take time to look into them.
Like Covid being a perfect 1.61 top.
Which started similarly to what we have here.
The Covid crash would start once the 1.27 broke- which is where we are now.
Conditions for a crash now are actually realistic. Generally speaking a crash is something that it's only valid to speak of potentially in the future in the event of multiple markers hitting. Lots of things have to happen before we have real honest and true crash conditions.
Unusual things. Like trending down consistently for a couple months.
Having insanely aggressive bounces off support but not really getting anywhere.
Containing a correction inside a 2 leg structure.
...Breaking a 1.61.
See where I'm going with this?
It might happen. If the low is not made, we enter into real crash territory on the next break.

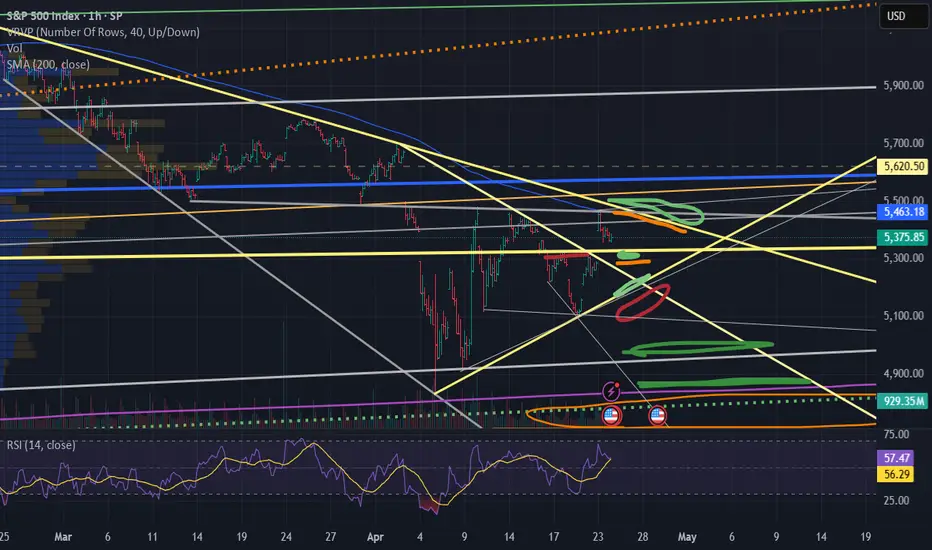
5800 Would le Optimal for a Bear SetupThe market is fast and ATR is high so I make sure I have plans to both sides so as not to be caught out, but realistically I've done hardly any trading since the day we dropped 6% and the rallied to retest the high. That was the last day I took big positions (longs which hit trailing stops for 300 points) and since then I've been mainly watching.
Spectating rather than speculating. There are times to make money and times to lose it, it's good to know the difference between them.
In a simple bear trend, we could see a high here somewhere in the 5200 - 5300 range - but to best suit the things I expect to see in a good bull trap before a real drop, I'd like to 5800.
SPX at 5800 would convince me to start trying to trade big positions short again.
