S&P 500 Pullback Nearing End? Hammer + Elliott Wave Say Rebound!The S&P 500 Index ( FOREXCOM:SPX500 ) is one of the most important indexes in the financial market these days , with the cryptocurrency market and especially Bitcoin ( BINANCE:BTCUSDT ) having a strong correlation with this index .
After Donald Trump suspended tariffs on 90 countries (except China) , the S&P 500 Index started to rise and seems to have managed to break through the Resistance zone($5,284-$5,094) and is pulling back to this zone .
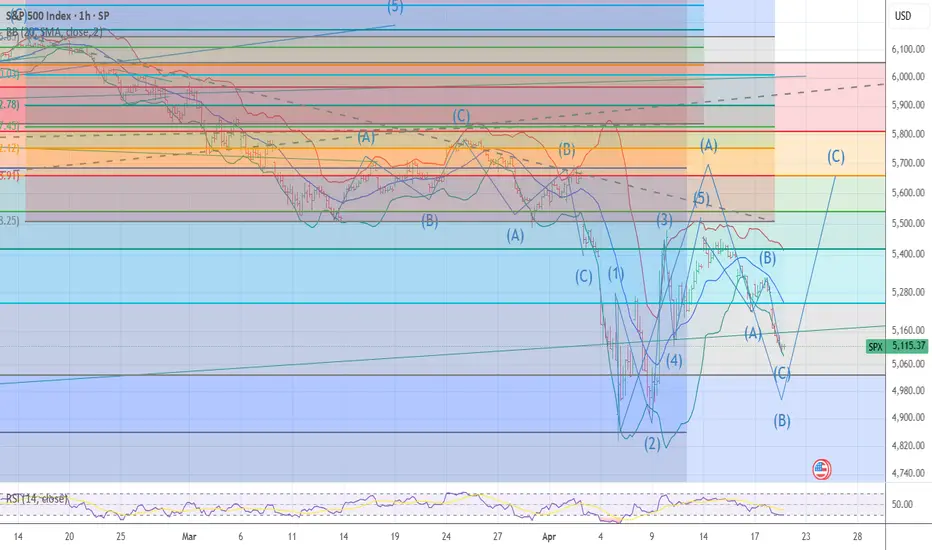
One of the signs of a reversa l of the S&P 500 Index can be the formation of the Hammer Candlestick Pattern , which announces the end of the pullback .
In terms of Elliott Wave theory , it seems that the S&P 500 Index is completing a corrective wave that could be in the form of a main wave 4 ( it is correcting both in time and price ).
I expect the S&P 500 Index to resume its upward trend in the coming hours, if nothing special is released , and to reach the Resistance zone($5,680-$5,500) and Yearly Pivot Point . If this happens, today's Bitcoin analysis could also be correct .
Note: In the worst case, if the S&P 500 Index touches $5,050, we should expect a further decline in the S&P 500 Index and Bitcoin.
Do you think the S&P 500 Index will return to an upward trend, or is this increase temporary?
Please respect each other's ideas and express them politely if you agree or disagree.
S&P 500 Index Analyze (SPX500USD),1-hour time frame.
Be sure to follow the updated ideas.
Do not forget to put a Stop loss for your positions (For every position you want to open).
Please follow your strategy and updates; this is just my Idea, and I will gladly see your ideas in this post.
Please do not forget the ✅' like '✅ button 🙏😊 & Share it with your friends; thanks, and Trade safe.
US500FU trade ideas


Déjà Vu: 2025 Tariffs Mirror 2018 Trade War PlaybookThe economic strategy behind the new wave of tariffs bears an unmistakable resemblance to the 2018–2020 U.S.–China trade conflict. That’s no coincidence. Peter Navarro, the architect of the 2018 tariff playbook under President Trump, has once again stepped into a key role shaping trade policy in Trump’s second term.
In 2018, the Trump administration launched a phased escalation of tariffs, starting with targeted duties on Chinese imports and expanding into broader measures that disrupted global supply chains. By Q4 2018, the S&P 500 had fallen nearly 20%, while tech-heavy names like NVIDIA plunged over 50% amid valuation compression, supply chain fears, and geopolitical stress.
Peter Navarro’s re-emergence signals that this isn’t just about political posturing. Known for his hardline stance on China and focus on economic nationalism, Navarro treats tariffs not as negotiation tools but as long-term policy. In 2018, that posture drove escalation until the market forced a pause.
Now in 2025, we’re watching the same script unfold almost beat for beat:
1. Start with China
2. Expand globally
3. Soften the global rhetoric to isolate China
4. Target key sectors (semiconductors, pharmaceuticals, energy)
5. Start the media misdirection to work behind the scenes with China
6. Set up a “deal” under market pressure
In 2025, the market again entered bear territory but staged a brief recovery after a pause in reciprocal tariffs. As of April 21, 2025, the index sits 16% off its February high and still in a downtrend.
Now, looking at the charts, here where things begin to take shape. Let’s start with the 2018 chart (figure 1). Like previously mentioned, back in 2018, the S&P 500 dropped over 20% between September and December, finding the bottom at a key support from 20 months prior (Q1 2017). The first gray box represents 10 weeks from the 2018 high. The 10 weeks is important because we are currently 10 weeks off the 2025 high, so this first gray box shows historically where we are today relative to the 2018 prices. The second gray box represents the 3 remaining weeks of drawdown, which was roughly 10%.
Figure 1
Now looking at the 2025 chart (figure 2), we have the same 10-week gray box marked up, and the additional 3-week, 10% drawdown, gray box that follows. Coincidentally, or not, the bottom of the second gray box aligns almost perfectly with the 0.618 Fibonacci retracement from the 2022 swing low to the 2025 high (figure 3). Even more interesting, that support level also ties back to the September 2023 high—roughly 20 months prior. Sound familiar?
Figure 2
Figure 3
I will be watching that 4500 level for SPX over the next few weeks as Trump and Navarro are preparing to roll out more sector-specific tariffs in the coming weeks. Meanwhile, Jerome Powell is facing renewed pressure, including calls to step down—again, nearly identical to the rhetoric from late 2018.
Currently, markets are pricing in just a 10% chance of a rate cut, according to Kalshi. But if the market continues to slide, Navarro and Trump may dial up pressure on the Fed to act. A rate cut in early May could mark the market bottom—just like Powell’s dovish pivot did in early 2019.
If the 2018 blueprint holds, we’re in the middle innings. Tariffs are broadening, the market is reacting, and the Fed is being boxed in. The coming weeks may test the 0.618 Fib level on the S&P 500. If Powell pivots and rhetoric softens, we may find a low—and history will have rhymed, if not outright repeated. If Powell stays strong, then Trump and Navarro may publicly pull back and take negotiations behind closed doors.
I don’t see this is being just being coincidental. This seems to be following a very familiar playbook.

here is my Idea I believe the price is still going down. Everything has a 2 way which depends on the probability. Good luck and thank you

Noise, S&P Scenario, Gold BubbleThank you to the tradingview community for engaging and supporting my content.
After another rough start to the week, we have a bit of a crossroads ahead for the S&P
1) We revisit the April 7 lows and poke lower with bear trap opportunities
2) We hold Monday April 21 lows and grind back up to gap fill and revisit 5400-5500 resistance
3) We go nowhere with a lot of intraday volatility and noise (between the April 7 low and the April 9 high)
The markets are on high alert
DXY
Gold
Bitcoin
US Bonds vs Treasuries (yields rising)
Trump is more vocal about threatening the FED or firing Powell and the concern is truly unprecedented
Trade War pause is still ongoing, China is being vocal as well to make sure countries don't simply line up to support the US. For all of this to calm down, US and China have to play nice. China is likely able to hold the line longer than the US in the near-term
Thanks for watching!!!

Global Supply Chains being Undone could be the cause of a (IV)I have been discussing the potential for a Super-Cycle wave (III) top in the US markets for the last couple years. To experience a wave (IV) of SUPERCYCLE PREPORTION, would be a consolidation of price action back to the 1929 stock market crash. The byproduct of this type of price action would be a decline of 50% or more (likely more) in the value of global stock markets. This type of asset price deflation would make anyone who watches the markets be inquisitive as to what would or even COULD cause such an event.
Would the dismantling of global supply chains, that have been in place since the early 1990’s, be the culprit?
I am starting to think the answer to that question is yes. This is not an indictment of the policy, but more an acknowledgement of the disruption and the possible aftermath.
The obvious concern is how do businesses plan? I would venture a guess business leaders will be challenged, and many may not survive. The cost equation becomes so skewed…how does one make money without passing the costs on to the consumer? That means higher inflation.
If this is the case, it’s possible digital assets become more of a safe haven which would be counter intuitive to hard asset value. This would mean that we will have endure a cycle of higher inflation, higher interest rates, and higher unemployment, coupled with lower economic growth. I cannot say this is how the forecasted price action is justified in the future. What I can say is the resulting price action will look very similar to the below.

S&P500 - The Correction Is Over Now!S&P500 ( TVC:SPX ) is retesting massive support:
Click chart above to see the detailed analysis👆🏻
Over the past couple of days, we have been seeing a quite harsh stock market "crash" with an overall correction of about -20%. However, as we are speaking the S&P500 is already retesting a major confluence of support and if we see bullish confirmation, this drop might be over soon.
Levels to watch: $4.900
Keep your long term vision,
Philip (BasicTrading)

S&P500: Bottomed on an Inverse Head and Shoulders.The S&P500 index is bearish on its 1D technical outlook (RSI = 36.973, MACD = -126.240, ADX = 31.007) but long term appears to have bottomed on an Inverse Head and Shoulders pattern. In fact, the Head made a low on the Double Bottom and the bearish outlook is currently due to the Right Shoulder formation. A crossing over the dashed LH trendline and even better the 4H MA200, would aim for the 2.0 Fibonacci extension (TP = 6,280).
## If you like our free content follow our profile to get more daily ideas. ##
## Comments and likes are greatly appreciated. ##

The creeping marketWe are still at support as of now, and the VIX looks like it may be a false breakout. It will be particularly interesting to see if we can hold this level into the close.

I am CALLING A BOTTOM TODAY I MOVED95% long 5109/5079 today The chart posted is the sp 500 I called for a sharp decline back to 5100 it has formed a ABC down I look for a sharp rally back to 5644/5669 Now before the next leg down today is wave Blow ,Best of trades WAVETIMER
now or nevermarket is at secondary support and is now down more than 3 percent. If we are going to bounce, this is the level that should hold.

S&P500The S&P 500 is exhibiting strong bullish momentum, as reflected in the recent price action. Notably, the H4 (4-hour) timeframe indicates sustained upward strength, signaling a continuation of the current bullish trend.

Long-Term Trend Still Intact for S&P 500The S&P 500 is falling, but despite the sharp negative moves in recent weeks, the longer-term trend remains positive.
The uptrend that began with the 2020 dip is still intact, and it appears the market has used this trend as an opportunity to buy the dips in the last two weeks.
If you zoom out from the current economic turmoil, the broader positive outlook for the U.S. market remains. U.S. stocks have become slightly more affordable following the recent selloff. If the U.S. manages to avoid a deep recession, this market pullback could create a huge opportunity for those who missed out on the 2023–2024 rally.
However, risks are notably higher now, especially with the introduction of new tariffs that are likely to weigh on growth.
As long as the long-term trend holds, downward moves into the 4600–4800 zone could offer compelling long-term buying opportunities.

Sideways for nowA rally today to test the previous highs is possible, but be aware that in this sideways range, what comes up then goes down and vice versa.

Post-Easter Drift: Markets Hit the Snooze ButtonMonday will be the first proper day back in the saddle after a long Easter weekend.
The chocolate coma has almost worn off. Markets will be waking up. Kind of.
These post-holiday opens are notoriously sluggish. Volume’s light. Direction takes a while to reveal itself. And everyone’s pretending to care about macro while waiting for real price action to show up.
But we’ve already got our map.
And the Wolfe Wave that paid us last week? Still unfolding.
I’m sitting tight with a fresh cup of caffeine, watching the 5400 level as our bull/bear toggle… and waiting to see if Trump rage-tweets another black swan into existence before the bell rings.
We’re not here to chase headlines.
We follow the system that pays.
--
SPX analysis 22 April 2025
The Wolfe Wave setup we traded last week hasn’t invalidated and still has room to run. The projected target near 5000 remains in play, and we’re well within the structure for a continued grind lower.
The swing income trade is live. And because this is options – not directional heroism – we don’t need the full drop to get paid. But a fast tag of 5000 will certainly do us a favour on timing.
On the GEX front, things remain bearish:
5400 = resistance + gamma flip level
5250 = highest negative gamma magnet this week
No bullish flips yet, and no major hedging pressure being relieved
That leaves our plan unchanged:
Bear bias holds under 5400
Swings remain on
Be ready to reassess if we bounce or overshoot key levels
Business as usual. Let price confirm. Let the system trigger.
Patience to profits.
---
Expert Insights: (Trading Mindset for Today)
The strategy is simple:
Wait for the setup. Place the trade. Walk away.
The temptation today will be to force something just because it’s the first day back.
Don’t. You’re not paid to predict. You’re paid to follow the rules.
A calm trader with a plan outperforms a hyper trader with opinions.
Common Trading Mistake & How to Avoid It
❌ Confusing movement with opportunity
Just because the market opens doesn’t mean it’s ready to trade.
✅ Let the setup come to you
Rule-based trading means you wait for confirmation – not caffeine.
Fun Market Fact – When Gamma Gets Negative…
Did you know that negative gamma magnifies market moves?
Here’s how it works:
Dealers hedge in the same direction as price
That creates more volatility, not less
Which means… wild swings are more likely when GEX is negative
This is why we’re watching 5250 this week – it’s where gamma says “this way, please” (and dealers cry quietly behind the screens).
---
Rumour Has It…
Trump’s latest tweet simply read: “ SP:SPX = Sad. Bears win.” Futures dipped 0.3% before recovering.
5400 is now being described as “psychological resistance” – which means nobody has a clue but it sounds clever.
GEX models reportedly enrolled in therapy after being ignored all weekend.
(This section is entirely made-up satire. Probably.)

S&P500SPX showing strong bullish momentum after confirming a double bottom. Last week’s COT report showed increased institutional longs. Add in a dovish Fed, solid earnings, and low VIX — the setup looks strong. Watching for continuation above key resistance.
