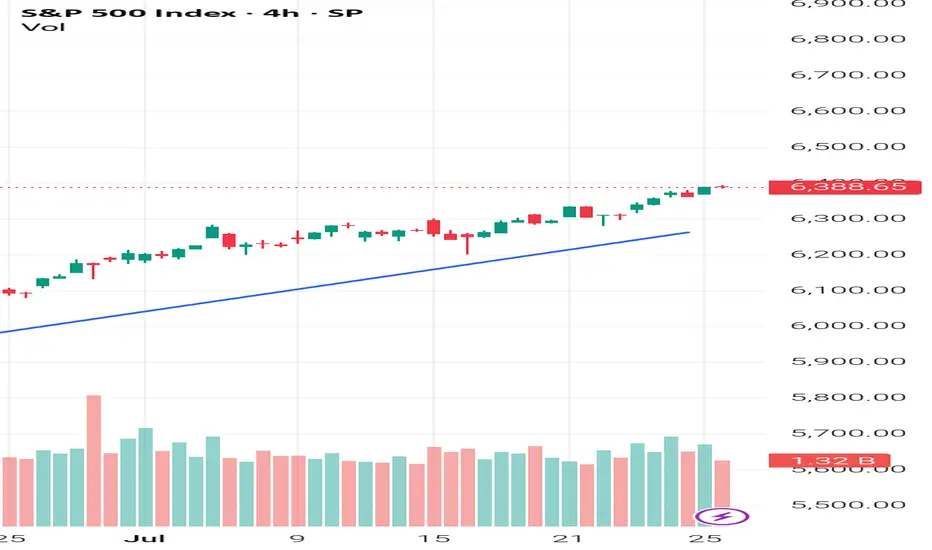
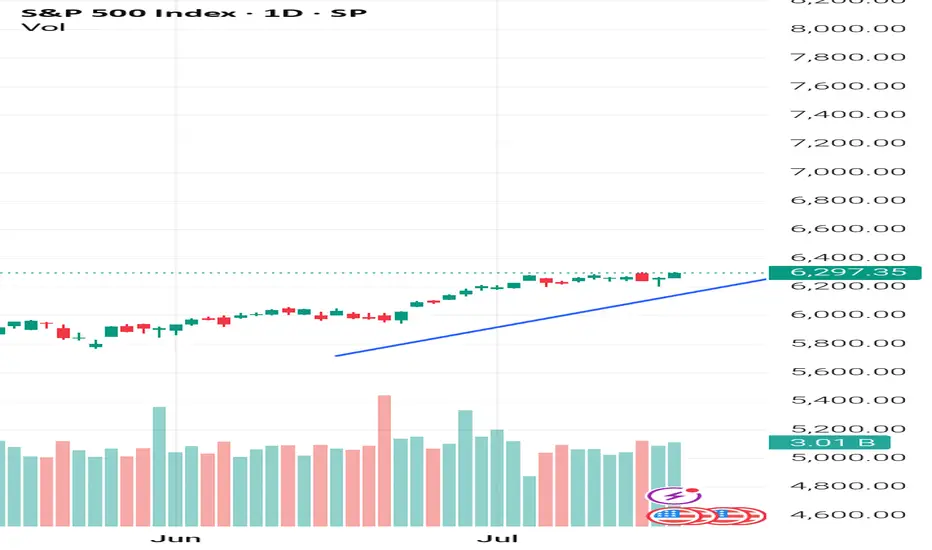
SPX to 6600+ by Aug 5This leg up in SPX is not over yet. Target at upper bound of the channel around 6.6K+ by Aug 5.
US500FU trade ideas

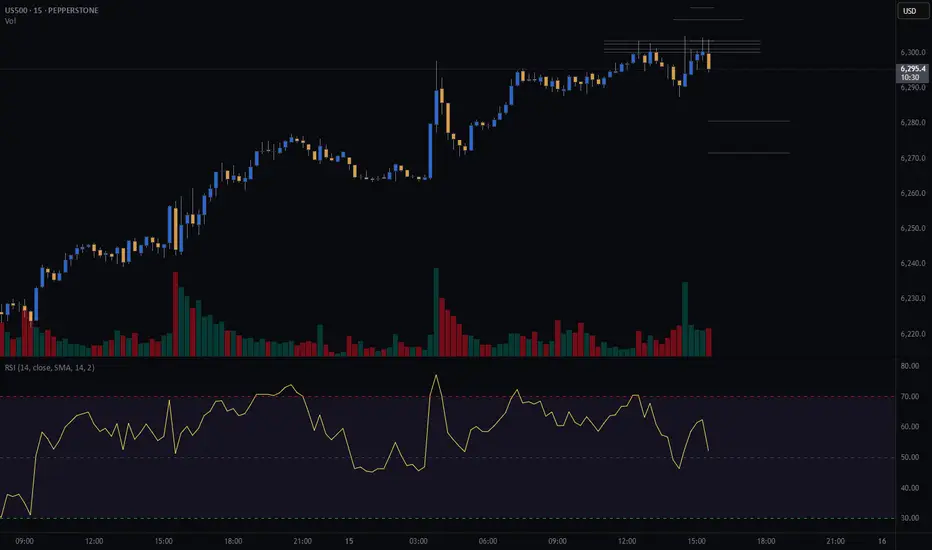
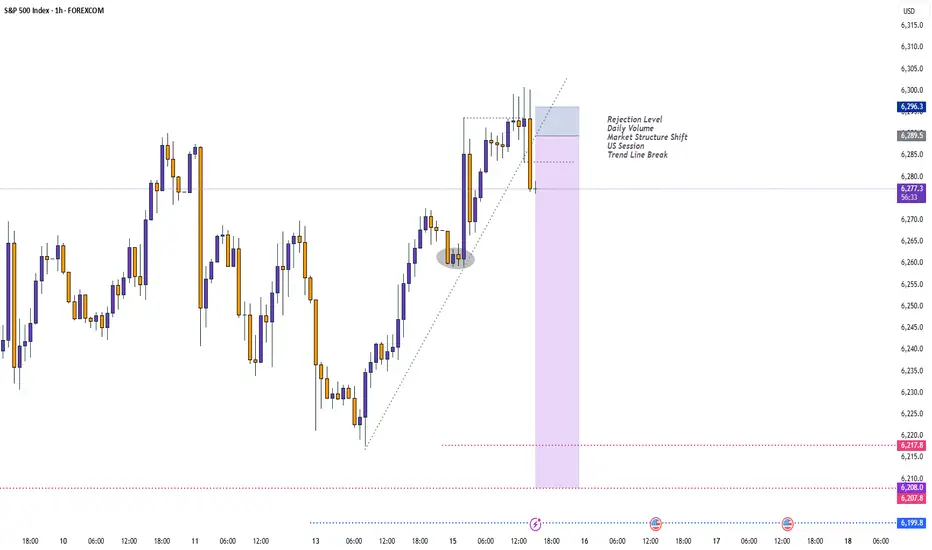
S&P500 (CASh500) Short - double top 15minEntry = 6303.4
SL = 6312.8
Take profit level 1 = 6280.7
Take profit level 2 = 6271.6
S&P 500 H4 | Approaching a multi-swing-low supportThe S&P 500 (SPX500) is falling towards multi-swing-low support and could potentially bounce off this level to climb higher.
Buy entry is at 6,220.89 which is multi-swing-low support that aligns with the 23.6% Fibonacci retracement.
Stop loss is at 6,170.00 which is a level that lies underneath a multi-swing-low support.
Take profit is at 6,299.72 which is a swing-high resistance.
High Risk Investment Warning
Trading Forex/CFDs on margin carries a high level of risk and may not be suitable for all investors. Leverage can work against you.
Stratos Markets Limited (tradu.com ):
CFDs are complex instruments and come with a high risk of losing money rapidly due to leverage. 63% of retail investor accounts lose money when trading CFDs with this provider. You should consider whether you understand how CFDs work and whether you can afford to take the high risk of losing your money.
Stratos Europe Ltd (tradu.com ):
CFDs are complex instruments and come with a high risk of losing money rapidly due to leverage. 63% of retail investor accounts lose money when trading CFDs with this provider. You should consider whether you understand how CFDs work and whether you can afford to take the high risk of losing your money.
Stratos Global LLC (tradu.com ):
Losses can exceed deposits.
Please be advised that the information presented on TradingView is provided to Tradu (‘Company’, ‘we’) by a third-party provider (‘TFA Global Pte Ltd’). Please be reminded that you are solely responsible for the trading decisions on your account. There is a very high degree of risk involved in trading. Any information and/or content is intended entirely for research, educational and informational purposes only and does not constitute investment or consultation advice or investment strategy. The information is not tailored to the investment needs of any specific person and therefore does not involve a consideration of any of the investment objectives, financial situation or needs of any viewer that may receive it. Kindly also note that past performance is not a reliable indicator of future results. Actual results may differ materially from those anticipated in forward-looking or past performance statements. We assume no liability as to the accuracy or completeness of any of the information and/or content provided herein and the Company cannot be held responsible for any omission, mistake nor for any loss or damage including without limitation to any loss of profit which may arise from reliance on any information supplied by TFA Global Pte Ltd.
The speaker(s) is neither an employee, agent nor representative of Tradu and is therefore acting independently. The opinions given are their own, constitute general market commentary, and do not constitute the opinion or advice of Tradu or any form of personal or investment advice. Tradu neither endorses nor guarantees offerings of third-party speakers, nor is Tradu responsible for the content, veracity or opinions of third-party speakers, presenters or participants.

S&P 500 consolidating at all-time highsOf late, we have seen price action on the S&P 500 consolidate around all-time highs of 6,290 and is on track to form a small ascending triangle. The nearest support to note resides at the 1W level of 6,121, closely shadowed by a 1M support from 6,040.
Based on the current technical picture, this clearly remains a buyers’ market.
- FP Markets Research Team
Tuesday 29 July: Forex Market thoughts The EUR has begun the week under pressure following the US / EUR trade deal.
EUR weakness could be out down to what they call 'sell the fact', meaning buy last week's deal rumours / sell (take profit) on the announcement. Or, more likely, it could be because it appears the US has the better side of the deal. Either way, all of lat week's EUR positivity has dissipated.
I didn't get involved in a EUR short trade yesterday, but there is a case to say it was viable.
The USD and JPY begin the week on the front foot. Possibly benefitting from 'EUR liquidity', or possibly due to 'positioning' ahead of this week's FOMC and BOJ meetings.
As things stand, with the VIX below 15 and the S&P still riding high, I maintain my view that according to market fundamentals, 'risk on' trades 'should' be viable. Which means staying patient and waiting for a turnaround, particularly on the JPY charts.
If that turnaround doesn't come, I could be forced to change my view.
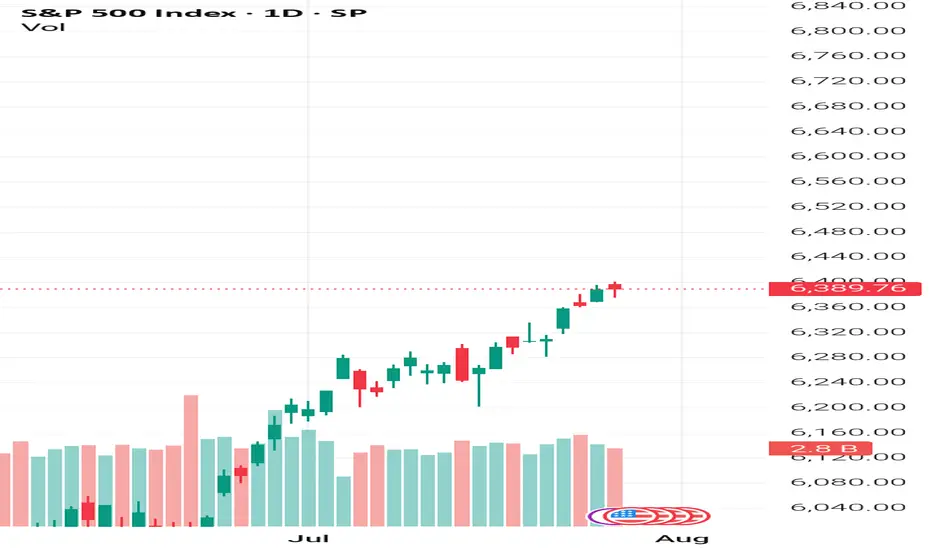
S&P500 uptrend pause supported at 6355US equities were largely subdued, with the S&P 500 inching up +0.02%, marking its sixth straight record high, the longest streak since July 2023. Despite the headline gain, over 70% of S&P 500 stocks declined, revealing weak breadth and suggesting index gains are being driven by a narrow group of large-cap tech names.
Tech led the way, with the information technology sector +0.77% and the Mag-7 rising +0.79%.
Semiconductors outperformed, as the Philadelphia Semiconductor Index climbed +1.62%, driven by AMD’s +4.32% surge.
Momentum is building ahead of key Big Tech earnings: Microsoft and Meta report tomorrow; Apple and Amazon follow Thursday.
Meanwhile, traders are staying cautious ahead of a busy macro week:
FOMC decision (Wednesday),
Core PCE, Q2 GDP, ISM, and nonfarm payrolls still to come.
Geopolitical developments include a possible 90-day US-China trade truce extension and Taiwan cancelling overseas travel, which may help de-escalate tensions.
On the corporate front:
Apple's India strategy sees it surpass China as the top smartphone source for US buyers.
Harley-Davidson may sell its finance unit in a $5B deal with Pimco and KKR.
Vitol rewarded top staff with $10.6B in share buybacks—a record.
Conclusion for S&P 500 Trading
The S&P 500 continues to post record highs, but narrow leadership and weak breadth raise red flags. With tech doing the heavy lifting, near-term direction hinges on earnings from Microsoft, Meta, Apple, and Amazon. Broader market upside looks fragile ahead of critical Fed and economic data, suggesting that any disappointment could trigger a pullback. Stay cautious and watch for rotation or retracement if macro or earnings catalysts falter.
Key Support and Resistance Levels
Resistance Level 1: 6430
Resistance Level 2: 6470
Resistance Level 3: 6500
Support Level 1: 6355
Support Level 2: 6315
Support Level 3: 6280
This communication is for informational purposes only and should not be viewed as any form of recommendation as to a particular course of action or as investment advice. It is not intended as an offer or solicitation for the purchase or sale of any financial instrument or as an official confirmation of any transaction. Opinions, estimates and assumptions expressed herein are made as of the date of this communication and are subject to change without notice. This communication has been prepared based upon information, including market prices, data and other information, believed to be reliable; however, Trade Nation does not warrant its completeness or accuracy. All market prices and market data contained in or attached to this communication are indicative and subject to change without notice.

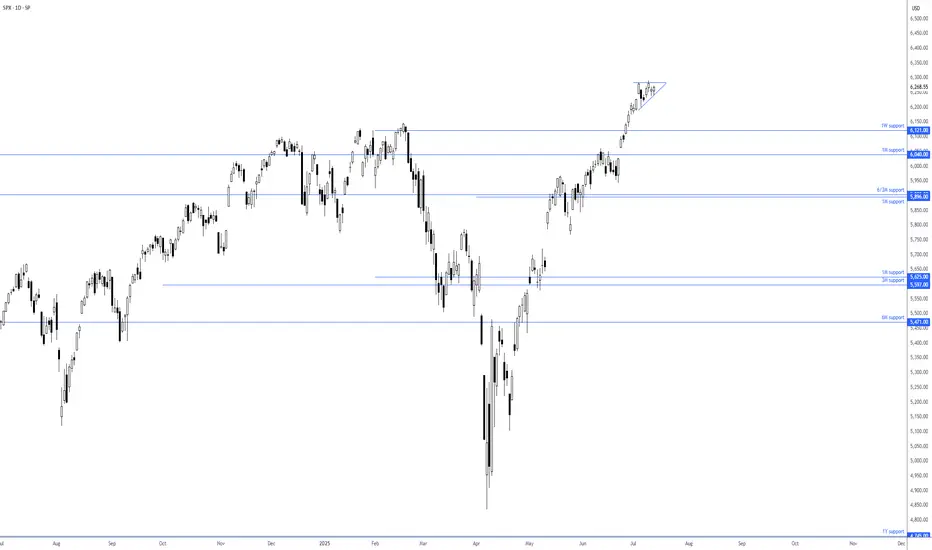
A pullback planThe upper trendline starts from Jan 2022 peak. It was broken on normal scale but still holds on log scale. The price may top here or may go higher. In a very bullish scenario the price may bounce much higher from an upper 1W FVG, but I think it will be broken soon. In any case I see a strong support at 6050-6150 area - a horizontal support and 1M/1W FVG are there. The price should return there sooner or later. No negative daily RSI divergence at the moment, but the price can make 4% correction on 2-4h divergence, which will appear at any new ATH. I gonna hold and increase my short position with low leverage untill the price makes a pullback into this area.

Bulls and Bears zone for 07-28-2025Last week 4 out of 5 sessions S&P 500 made new ATH. However they were all trading within a tight range.
Level to watch: 6434---6436

Weekly Review: Forex fundamental analysis The week starting Monday 21 July was another week of positive sentiment, the S&P continues to hit all time highs and the VIX remains anchored below 17.
The upbeat mood was propelled by an announcement of a tariff deal between the US and Japan. The market now thinks it's likely deals with EUROPE and CHINA will soon follow. All the while, earnings season continues to quietly slip under the radar (it's worth noting the upcoming week does have a plethora of huge companies reporting).
An election in JAPAN caused uncertainty, giving the JPY a bout of strength at the beginning of the week. I then found it difficult to decide if the US / JAPAN trade deal would be positive or negative for the JPY, ultimately the overall positive risk tone prevailed and the JPY ended the week softly.
It was also a week of two halves for the USD, the interest rate battle between the president and chair Powell continues to cause uncertainty. The FOMC meeting and the upcoming slue of reg flag US data will be very interesting. And could determine the underlying bias for the USD for the rest of the summer.
The EUR and GBP were prominent throughout the week, a 'hawkish hold' from the ECB, combined with positive PMI data and hopes of a trade deal, all contributed to positive sentiment for the EUR.
On the opposite end of the scale, the GBP ended the week bruised, weakened by another bout of 'soft data'. Which opened the door to potential 'relative fundamental' GBP short trades.
Finally, 'fairly hawkish' comments from the RBA'S BULLOCK keeps the AUD high on my to long list.
On a personal note, it was a week of two trades. I perhaps was a little bold in thinking the JPY post election strength was overdone, entering an AUD JPY long which stopped out. You might often think it's frustrating when a trade stops out, but then eventually hits the original profit target. Personally, I take the positive view that at least my original bias was proved correct.
The week was saved on Friday with a EUR GBP long, post GBP retail sales data and trying to take advantage of the positive EUR sentiment.
*As I write, it appears a US /EUR tariff deal is very close, which backs up thoughts of 'risk on' trades to begin the new week.
Trade 1: AUD JPY -1
Trade 2: EUR GBP +1.5
Total = +0.5%
SPX500 NEARING AN IMPORTANT FIB. EXTENSION RESISTANCEIn this weekend's analysis I find the SPX500 to remain BULLISH for next few days as we have strong closings outside the upper KC band and also touching the upper Bollinger band on the higher time frames from Daily to Monthly charts. It's also important to note that declining volume bars is NOT supporting the monthly rally, while MACD, RSI divergences are also sounding warning sirens that it's near a major correction territory which I have measure as the fib extension 0.618 from the October, 2022 base or support on the monthly chart. As signaled last week that we could be getting a capitulation candle soon to the fib target. Once we get a reversal candle on the 4 Hours it will confirm that the intermediate tops is achieved on the SPX500 and a correction is highly probable. So our trade thesis is Bullish until we get a confirmed bearish signal on either the 4H or 1D timeframe with Stop loss at 6377 level. Thanks for visiting my publication and trade idea on the SPX500. Cheers and happy trading to everyone.

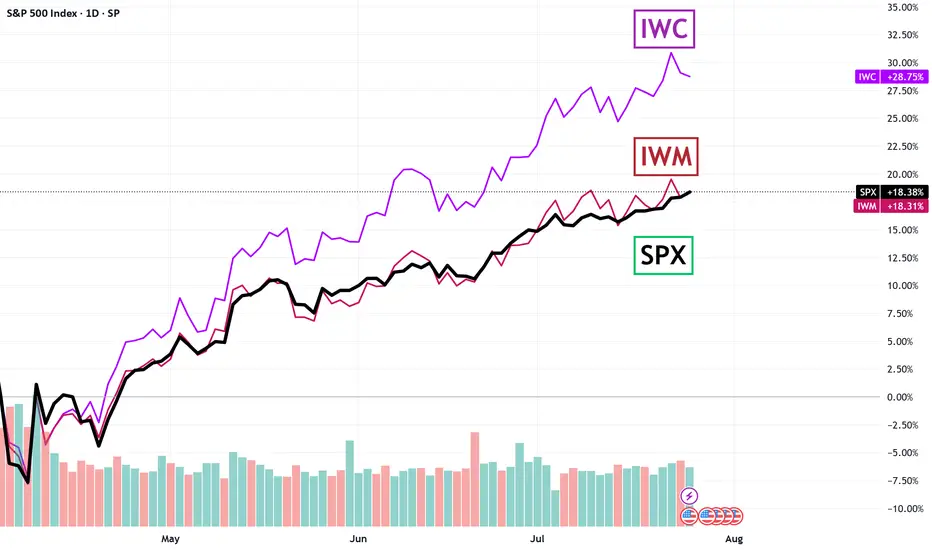
Where is the opportunity now?Small and microcap stocks have that reputation for being "icky" but they are currently looking like anything but that!
Position builders?📈 This One Daily Signal Ignited a 1,000+ Point Rally
While everyone else panicked during that April drop…
The ELFIEDT RSI + Reversion system quietly printed one word:
UP.
💹 That one green tag at the bottom?
It wasn’t just a bounce.
It was the start of a full-blown trend reversal.
⸻
🟢 Why Long-Term Traders Love This System:
✅ Signals only appear at extreme structure zones
✅ RSI was buried in oversold with clean divergence
✅ Daily timeframe = position-size confidence
✅ No need to overtrade — just buy the dip and hold
✅ Over 1,000+ points and still running…
⸻
This is what we call “High Conviction Buying.”
You didn’t need to time the top.
You just needed to trust a clean, unemotional signal at the bottom.
⸻
💬 DM “SP500 LONG” to see how this could’ve been on your chart
📲 Follow for more real, repeatable swing & position trade setups
🔒 Daily edge. Weekly confirmation. Monthly rewards.
Because sometimes…
📉 The scariest candles…
🔥 Become the most profitable trades.

Third quarter and something we didn’t expectso I’ve been watching the markets for a while and honestly this new admin is doing something that many didn’t saw coming.
it's not even a full year yet, we’re still on Q3, but the impact on the economy is starting to show. what really gets my attention is the tariff collection, it’s been really high and from what I see it’s even generating some kind of surplus in certain areas.
at first I thought this was going to slow down the market or create pressure, but the opposite happened, the stock market has been hitting all time highs, especially in tech and defense sectors.
inflation didn’t spike like people was saying, that calmed down many investors and the flow of money is pretty obvious.
i’m not an expert or nothing but this first months looks like there’s a real direction and the money is moving in a positive way. still need to see how this year closes but if it stays like this, could be one of the strongest starts for a president in a long time.
just wanted to share my thoughts, what you guys think?

ECB on the agenda: The ECB is on the agenda today. I don't envision a particularly volatile event, although a continuation of the 'limited further cuts narrative' should see the EUR supported, particularly given growing thoughts of a US / EUR trade deal.
All in all, with the S&P still climbing, I continue to hold the view that 'risk on' trades are viable, especially since the announcement of the US / JAPAN trade deal. It's just a case of choosing whether to short the JPY or USD.
In other news, 'soft' SERVICE PMI data from the UK puts a little more pressure on the BOE to cut rates, arguably creating a GBP short 'catalyst' trade for anyone at the charts in that moment.
Also, a relatively hawkish speech from the RBA'S BULLOCK, keeps the AUD high on my 'to long list'.
Wall Street takes off: 5 secret growth engines for #S&P500 Record closes for the indices on July 21 came from a powerful combo: a surge in #Google , a strong start to the earnings season, gains in #Apple (+0.6%), #Amazon (+1.4%), plus #Microsoft, #Meta Platforms, and #Nvidia . This momentum, coupled with market bets on imminent Fed rate cuts and hopes for a softening US-EU tariff conflict, pushed #S&P500 and #NQ100 to new all-time highs.
5 mega drivers that could keep #S&P500 and #NQ100 on the runway through 2025:
• AI capex and monetization: Top cloud providers are ramping up spending in computing clusters and generative AI solutions. The growing lineup of paid AI products (Google Gemini, Microsoft Copilot+ Apps, Amazon Bedrock) is starting to generate significant revenue, boosting profit estimates for the “Magnificent 7.”
• Fed policy easing: If inflation keeps drifting towards 2%, we may see the first rate cut of the cycle between July and September. Historically, every 25 bps drop in 10-year UST yields adds ~2% to the #NQ100 ’s valuation multiple.
• Record buybacks and dividends: #S&P500 companies hold $3.5 trillion in cash. After tax relief on repatriated foreign earnings earlier this year, several megacap boards approved accelerated buybacks — mechanically supporting stock prices.
• Easing tariff risks: Potential trade deals between the US and EU, and the US and Mexico, would remove the threat of 20–50% tariffs priced into valuations, unlocking CAPEX in manufacturing and semiconductors — sectors with a heavy #NQ100 weight.
• Resilient consumers and services: Unemployment remains near 4%, and household spending is growing 2–3% YoY. This supports e-commerce, streaming, and platform advertising — together making up ~40% of #NQ100 and ~28% of #S&P500 .
The current highs of #S&P500 and #NQ100 aren’t a random spike — they result from strong corporate earnings, expectations of Fed cuts, and hopes of trade détente. If even some of these five drivers materialize, the indices have a strong chance to stay elevated and set new records by year-end. FreshForex analysts believe current prices could spark a new rally, with today’s market conditions offering plenty of entry points in both indices and stock CFDs.

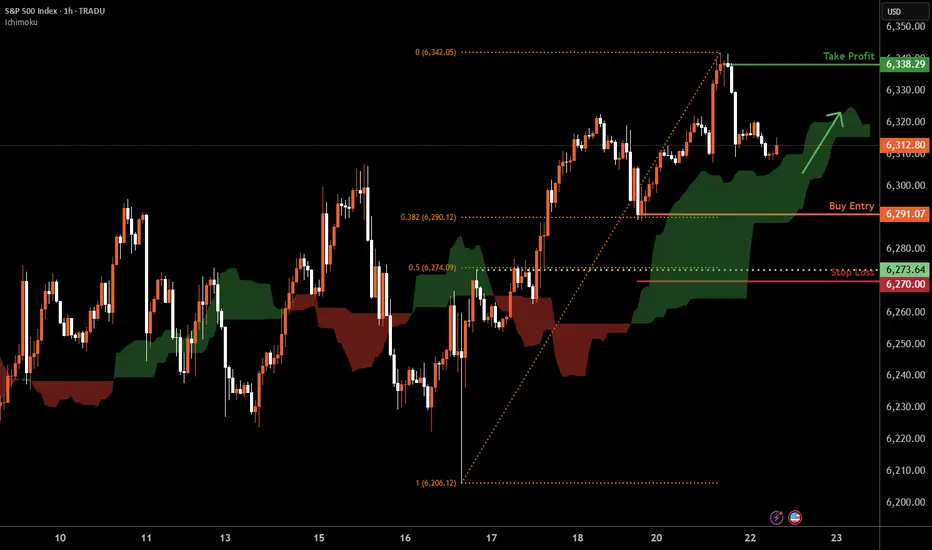
S&P 500 H1 | Swing-low support at 38.2% Fibonacci retracementThe S&P 500 (SPX500) is falling towards a swing-low support and could potentially bounce off this level to climb higher.
Buy entry is at 6,291.07 which is a swing-low support that aligns with the 38.2% Fibonacci retracement.
Stop loss is at 6,270.00 which is a level that lies underneath a pullback support and the 50% Fibonacci retracement.
Take profit is at 6,338.29 which is a swing-high resistance.
High Risk Investment Warning
Trading Forex/CFDs on margin carries a high level of risk and may not be suitable for all investors. Leverage can work against you.
Stratos Markets Limited (tradu.com ):
CFDs are complex instruments and come with a high risk of losing money rapidly due to leverage. 66% of retail investor accounts lose money when trading CFDs with this provider. You should consider whether you understand how CFDs work and whether you can afford to take the high risk of losing your money.
Stratos Europe Ltd (tradu.com ):
CFDs are complex instruments and come with a high risk of losing money rapidly due to leverage. 66% of retail investor accounts lose money when trading CFDs with this provider. You should consider whether you understand how CFDs work and whether you can afford to take the high risk of losing your money.
Stratos Global LLC (tradu.com ):
Losses can exceed deposits.
Please be advised that the information presented on TradingView is provided to Tradu (‘Company’, ‘we’) by a third-party provider (‘TFA Global Pte Ltd’). Please be reminded that you are solely responsible for the trading decisions on your account. There is a very high degree of risk involved in trading. Any information and/or content is intended entirely for research, educational and informational purposes only and does not constitute investment or consultation advice or investment strategy. The information is not tailored to the investment needs of any specific person and therefore does not involve a consideration of any of the investment objectives, financial situation or needs of any viewer that may receive it. Kindly also note that past performance is not a reliable indicator of future results. Actual results may differ materially from those anticipated in forward-looking or past performance statements. We assume no liability as to the accuracy or completeness of any of the information and/or content provided herein and the Company cannot be held responsible for any omission, mistake nor for any loss or damage including without limitation to any loss of profit which may arise from reliance on any information supplied by TFA Global Pte Ltd.
The speaker(s) is neither an employee, agent nor representative of Tradu and is therefore acting independently. The opinions given are their own, constitute general market commentary, and do not constitute the opinion or advice of Tradu or any form of personal or investment advice. Tradu neither endorses nor guarantees offerings of third-party speakers, nor is Tradu responsible for the content, veracity or opinions of third-party speakers, presenters or participants.
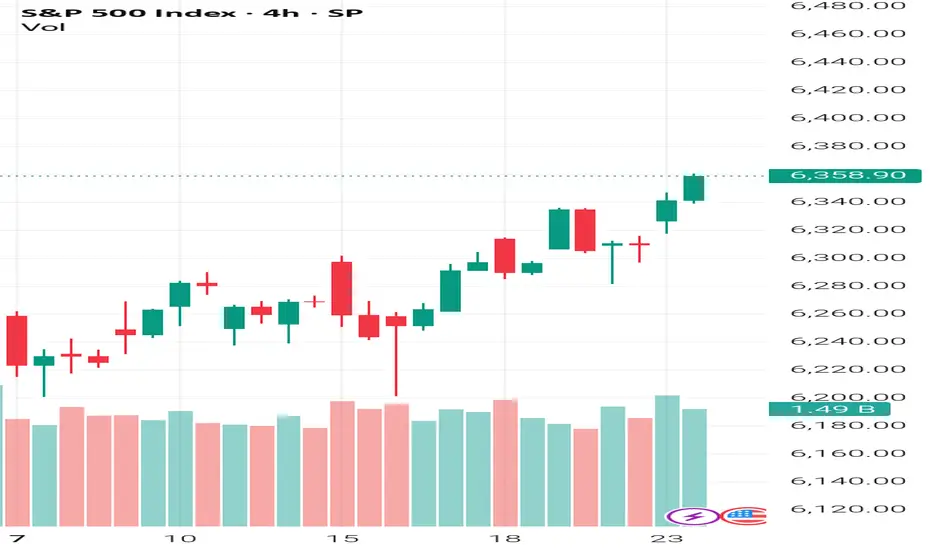
LAST WEEK TO GET BIDSSo as earnings push higher, it is expected that indices will try to push as there are no major news events however as this overbought Sp500 is due for correction if it taps the 6330 threshold to get to 6400.

Weekly Review: The S&P and NASDAQ once again hit all time highs during the week starting Monday 14 July. Which is a sign of confidence despite the ongoing external threats (tariffs / Middle East). I've noticed the current earnings season wasn't approached with as much trepidation as recent earnings seasons have been. Of course, that could come crashing down as companies continue to report over the next couple of weeks.
Once again, the currencies didn't quite react in accordance with the overall 'positive risk environment'. As each of the 'risk off currencies' offers their own separate challenges:
Ever since the recent NFP data, the USD had been strong, the FED continues to maintain a view for a 'slow pace of rate cuts' and US data backs up that view. Particularly this week's retail sales data, even CPI, although relatively benign, wasn't soft enough to warrant a 'FED pivot' towards a more dovish stance. The USD spent most of the week on the front foot, although the 'higher for longer' narrative was put to the test when the president once again offered his views on Mr Powell. Also FED board member WALLER chipped in with some dovish comments. Currently, it's up in the air as to how many more rate cut the FED will implement before year end (if any). The narrative at the July FOMC meeting could go a long way to determine the dollar's direction for the rest of the summer. But ultimately, it'll be the data that decides.
Recently, I've been encouraged by the re-emergence of JPY weakness. This past week, I put any periods of JPY strength down to profit taking before this weekends election. I need to do some reading regarding the implications of the result. But I'm 'hopeful' that over the coming weeks and months the 'old fashioned, JPY short 'risk on trade', will be prevalent.
The CHF continues to have a mind of it's own. It could be tracking EUR strength, it could be the article I read about gold, it could be SNB intervention, It could be random, or something I'm not aware of. Ultimately, until I'm comfortable the CHF is back in correlation with the risk environment, my preference is to short the JPY instead.
In other news, disappointing AUD data took the shine off the hawkish RBA. But I still view the AUD as a good 'risk on' long.
I'll begin the new week with an open mind. My preference remains for 'risk on' trades. But it's a case of keeping up to date with all of the narratives, if momentum aligns with logic and a narrative. And you feel comfortable with a stop loss and profit target, place the trade. But, be aware that the narrative the market is focused on can change from day to day.
On a personal note, it was a week of two trades. A post US CPI 'risk on' AUD JPY long. The trade stopped out. And as discussed during the week, it was one of those situations where if I would have been at the charts and hour later, I would have traded a different pair. That's life.
The second trade was AUD USD long. Post WALLER'S dovish comments, I felt the USD short momentum could continue. On my account the trade hit profit by the skin of its teeth before reversing. Again, that's life. Sometimes you get good luck, sometimes you get bad luck. I feel it's important to acknowledge good luck, as we often only focus on the bad luck we have.
The USD is finely poised and I'm intrigued to see where the data and rate cut narrative takes it over the coming weeks.
Results:
Trade 1: AUD JPY -1
Trade 2: AUD USD +1.2
Total = +0.2%

Miss This Watchlist, Miss Next Week’s OpportunitiesHey friends,it’s Skeptic 🩵 hope you’re having a great weekend!I know it’s the weekend, so a lot of you are probably chilling away from the charts, but for some, trading’s such an addiction that even weekends can’t keep you away. In this video, I’m gonna break down my weekly watchlist for you. Knowing it will help you miss fewer good opportunities, avoid FOMO, and have a plan ready for different scenarios and events.
Don’t forget money management , and stay clear of FOMO. & if it helped smash that boost bottom and follow for more !

Risk environment to remain positive? S&P continuation?Despite all the recent tariff concerns, inflation concerns and Middle East worries. The S&P continues to push all tine highs. And 'risk surprises' not withstanding, is likely to do so. Backed up by a solid start to ratings season, especially from Netflix.
In the currency space, that should mean the JPY remains weak. And I'm cutoutting recent JPY strength due to profit taking ahead of weekend elections. But moving into the new week, i'll be looking for JPY short opportunities.

SPX500 LongThere is a lot of support at this level
There is a shark pattern on M15 and M30
All timeframes are oversold and there are multiple bottoms with divergence
This trade is with the trend
25 Pip stop loss
