SPX GEO+ Cycle Update: "SPX: April Low Called, Target 8000+"SPX GEO+ Cycle Update: April Low Called Precisely (Next Target: 8000)
On January 5th, 2025, when SPX was trading at 5942, I published an analysis in Italian using my GEO+ Cycle methodology that made two specific projections:
📉 A low around 5000 in April 2025
📈 Then an advance targeting 8000 by 2026
Update: April delivered exactly as projected.
The geometric patterns suggested April would mark a significant turning point, and the market found strong support right in the anticipated zone and timeframe.
About GEO+ Cycles:
After 15 years studying market geometry, I've developed a framework that identifies multi-decade structural patterns. These aren't traditional technical indicators—they're mathematical relationships that help project major turning points with remarkable precision.
Current Phase:
We're now in the advancing phase of this cycle. Based on geometric projections, the target window for 8000 remains January 2026.
Important Context:
This represents cycle analysis for educational purposes, not trading advice. The methodology focuses on identifying major structural turning points rather than short-term movements.
What's Next:
I'll continue tracking this cycle's development and provide updates as we approach key geometric levels.
For those interested in learning more about geometric market analysis, feel free to follow for updates on this and other cycle progressions.
The mathematics of market geometry continue to unfold...
Note: Originally published in Italian, now sharing these insights with the global TradingView community.
USA500 trade ideas

Macroeconomic analysis of the American marketHello investor friends,
today I bring an update on the macro economic state of the American economy which generally moves markets around the world.
From the graph we can see the S&P 500 index on which 4 lines have been superimposed which coincide with:
- FED interest rate
- FED balance sheet
- US inflation rate
- US unemployment rate
The vertical line on the graph coincides with the date of the last update I made 5 months ago.
The central bank decides interest rates and the injection of money with the aim of keeping inflation low and avoiding too much unemployment.
At the moment we have:
- Unemployment rate at 4% (remained unchanged)
- Inflation at 2.4% (decreased compared to 5 months ago)
- The balance / release of printed money (continues to fall)
- The interest rate remained unchanged (current 4.33%)
Compared to 5 months ago the situation seems to have improved and is quite stable. The FED has decided to keep rates unchanged due to political issues as it would like to see clearly before making cuts.
In general we can say that the situation seems quite good as, unemployment is low, inflation is at optimal levels, we see that the budget/money injection is decreasing and therefore leads to maintaining regular inflation and finally the interest rates being stable maintain a low level of unemployment.
Given these factors we see that since the last update 5 months ago (i.e. in February), in the following weeks there was a collapse due to Trump's policies but that it was certainly an excellent opportunity to increase positions given that the macroeconomic situation was positive as it currently is.
From today we could certainly expect further declines due to other monetary policies or other news, but as long as the macro situation is positive we have no reason to worry.
👍 Like if you want more macro updates in the future
🙋♂️ Follow me so you don't miss my future analyses
⚠️ Disclaimer: This post is for informational purposes only and does not constitute financial advice. Always do your research before making investment decisions.
SP:SPX FRED:SP500 VANTAGE:SP500 AMEX:SPY VANTAGE:DJ30 AMEX:DIA CME_MINI:NQ1! FX:NAS100 NASDAQ:QQQ FX:EUSTX50 FOREXCOM:GER40 FX:AUS200

Possible Wyckoff top on US500I'll be looking for this wyckoff formation on US500.
Of a new ATH is forming in the next few days and we have a stong sell off, I'll be taking the short on the Test of the Spring.

SP500 TECHNICAL ANALYSIS 30 MINUTE TIME FRAME 📊 Technical Analysis – SP500 CFD (30-Minute Chart)
✅ 1. Overall Market Trend:
The market is currently in a range-bound structure after a sharp upward move toward the 6,296 level.
Price entered a clear supply zone and reversed sharply.
Multiple BOS (Break of Structure) and CHoCH (Change of Character) events indicate clear shifts in price behavior.
📌 2. Key Structure Zones:
🟩 Demand Zones:
6,240–6,250: First active demand zone — could trigger bullish reactions.
6,180–6,200: Deeper liquidity zone within the Discount area, ideal for long setups if tested.
Price is approaching equilibrium and preparing for a potential reaction.
🟥 Supply Zones:
6,290–6,300: This premium zone caused the recent rejection and is currently acting as short-term resistance.
📈 3. Price Action & Candles:
Price created a rising wedge near the highs, which broke down.
Strong bearish candles followed, breaking key short-term structure levels.
Price is now heading into the equilibrium zone and testing demand.
📌 4. Possible Scenarios:
🔻 If Price Falls:
Watch for a reaction at the 6,240–6,250 demand zone.
If this area breaks, the next downside target is 6,180–6,200 — a high-probability liquidity zone.
🔺 If Price Rebounds:
A bullish reaction from the current zone could send price back toward 6,270+.
A confirmed break of 6,296 would open the door to higher highs.
🧠 Summary Table:
Condition Analysis
Current Status In corrective phase after bullish impulse
Short-Term Trend Bearish structure active (BOS, CHoCH present)
Key Support 6,245 → 6,180
Key Resistance 6,290–6,300
Buy Opportunity Bullish confirmation at demand zones
Sell Opportunity Weak reactions or breakdowns below BOS
⚠️ Disclaimer:
This analysis is for educational purposes only and does not constitute financial advice or a buy/sell signal.
Always trade based on your personal strategy and risk management plan.
VANTAGE:SP500

SPX500 RallyThe SPX500 price will drastically grow in the coming days. Price has broken out a bullish flag pattern. We may anticipate and enter on the retest around 6230

SPX500SPX500: Bullish Momentum Builds – 6500 in Sight?
📍 Current Price: 5977.00
📈 Bias: Strongly Bullish
🎯 Target: 6500+
📉 Invalidation Level: 5850 (Short-term support)
📊 Technical Outlook:
The SPX500 continues to show strong bullish momentum as it trades at all-time highs near 5977.00. With persistent buying pressure and supportive macro tailwinds, the index looks poised for further upside.
Key observations:
✅ Price Action: Clean breakout and consolidation above recent highs. No signs of exhaustion yet.
📈 Trend: Clearly up across all major timeframes (Daily, 4H, 1H).
🧠 Psychological Level: 6000 is within reach, and a break above could open the path toward 6500 as the next major round number and Fibonacci extension level.
💡 Market Sentiment: Risk-on tone prevails; tech and mega caps continue to lead.
🔍 Support & Resistance Levels:
Resistance: 6000 → 6150 → 6500
Support: 5900 → 5850 → 5735
⚠️ Risk Management:
While the setup remains bullish, traders should watch for:
Surprise macro headlines (Fed speeches, inflation data, geopolitical risks)
Pullbacks toward support for potential re-entries
📝 Conclusion:
SPX500 remains in a powerful uptrend. As long as price holds above key short-term support at 5850, bulls retain full control. A breakout above 6000 could trigger a fresh wave of institutional buying, driving price toward 6500 in the coming weeks.
📢 Let me know your thoughts — are we heading for 6500 next?
👍 Like & follow for more real-time market insights!

S&P 500 H1 | Falling toward an overlap supportThe S&P 500 (SPX500) is falling towards an overlap support and could potentially bounce off this level to climb higher.
Buy entry is at 6,186.42 which is an overlap support that aligns with the 23.6% Fibonacci retracement.
Stop loss is at 6,130.00 which is a level that lies underneath a swing-low support and the 38.2% Fibonacci retracement.
Take profit is at 6,268.39 which is a swing-high resistance.
High Risk Investment Warning
Trading Forex/CFDs on margin carries a high level of risk and may not be suitable for all investors. Leverage can work against you.
Stratos Markets Limited (tradu.com ):
CFDs are complex instruments and come with a high risk of losing money rapidly due to leverage. 63% of retail investor accounts lose money when trading CFDs with this provider. You should consider whether you understand how CFDs work and whether you can afford to take the high risk of losing your money.
Stratos Europe Ltd (tradu.com ):
CFDs are complex instruments and come with a high risk of losing money rapidly due to leverage. 63% of retail investor accounts lose money when trading CFDs with this provider. You should consider whether you understand how CFDs work and whether you can afford to take the high risk of losing your money.
Stratos Global LLC (tradu.com ):
Losses can exceed deposits.
Please be advised that the information presented on TradingView is provided to Tradu (‘Company’, ‘we’) by a third-party provider (‘TFA Global Pte Ltd’). Please be reminded that you are solely responsible for the trading decisions on your account. There is a very high degree of risk involved in trading. Any information and/or content is intended entirely for research, educational and informational purposes only and does not constitute investment or consultation advice or investment strategy. The information is not tailored to the investment needs of any specific person and therefore does not involve a consideration of any of the investment objectives, financial situation or needs of any viewer that may receive it. Kindly also note that past performance is not a reliable indicator of future results. Actual results may differ materially from those anticipated in forward-looking or past performance statements. We assume no liability as to the accuracy or completeness of any of the information and/or content provided herein and the Company cannot be held responsible for any omission, mistake nor for any loss or damage including without limitation to any loss of profit which may arise from reliance on any information supplied by TFA Global Pte Ltd.
The speaker(s) is neither an employee, agent nor representative of Tradu and is therefore acting independently. The opinions given are their own, constitute general market commentary, and do not constitute the opinion or advice of Tradu or any form of personal or investment advice. Tradu neither endorses nor guarantees offerings of third-party speakers, nor is Tradu responsible for the content, veracity or opinions of third-party speakers, presenters or participants.

BuyHigher Time Frame Reject Level
Bullish Previous Week
Market Structure Shift Bullish
Asian Session
Trade
Manage
Smile

Logarithmic channelsThe price has reached a support area at the bottom of the long-term logarithmic channel. If this area will not hold the price I see a possible spike to 5330 level which is 1.618 retracement of March 13 bottom - March 25 top. The price did the same retracement in October 2023. Pay attention that we have 1d positive divergence forming on RSI. We are bottoming, a crash is unlikely right now. The reversal will most likely happen this week.

SPX500 Holding Bullish Structure – Eyes on 6287 BreakoutSPX500
The price maintains bullish momentum as long as it remains above 6225 and 6246.
Currently, the market is approaching the 6287 resistance level. A confirmed 4H candle close above 6287 is required to validate continuation of the bullish trend toward 6325.
However, a rejection from 6287 may trigger a short-term bearish correction, with potential pullbacks toward 6246 and 6225.
A sustained break below 6225 would shift the momentum to the downside, targeting the 6143 support level.
Pivot Level: 6264
Resistance: 6287 – 6325
Support: 6246 – 6225 – 6143

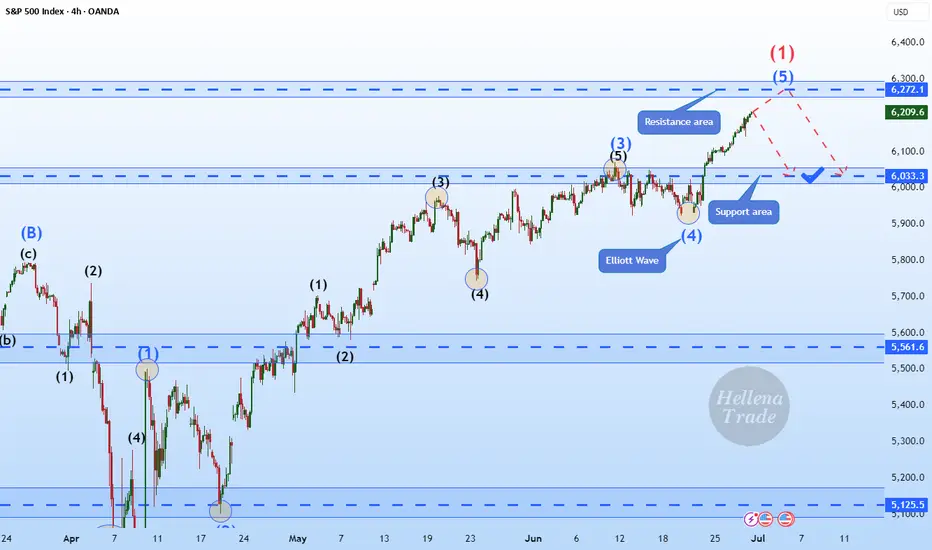
Hellena | SPX500 (4H): SHORT to support area of 6033.Colleagues, I assume that wave “1” completes the upward movement and somewhere around here a major correction ‘2’ should begin, which will consist of waves “ABC” and may continue to the level of 5700. But for now, I think we need to focus on the nearest targets.
I see the support area of 6033 as the first target.
Manage your capital correctly and competently! Only enter trades based on reliable patterns!
Bullish continuation?S&P500 (US500) is falling towards the pivot which acts as a pullback support and could bounce to the 1st resistance, which aligns with the 161.8% Fibonacci extension.
Pivot: 6,127.80
1st Support: 5,785.00
1st Resistance: 6,428.64
Risk Warning:
Trading Forex and CFDs carries a high level of risk to your capital and you should only trade with money you can afford to lose. Trading Forex and CFDs may not be suitable for all investors, so please ensure that you fully understand the risks involved and seek independent advice if necessary.
Disclaimer:
The above opinions given constitute general market commentary, and do not constitute the opinion or advice of IC Markets or any form of personal or investment advice.
Any opinions, news, research, analyses, prices, other information, or links to third-party sites contained on this website are provided on an "as-is" basis, are intended only to be informative, is not an advice nor a recommendation, nor research, or a record of our trading prices, or an offer of, or solicitation for a transaction in any financial instrument and thus should not be treated as such. The information provided does not involve any specific investment objectives, financial situation and needs of any specific person who may receive it. Please be aware, that past performance is not a reliable indicator of future performance and/or results. Past Performance or Forward-looking scenarios based upon the reasonable beliefs of the third-party provider are not a guarantee of future performance. Actual results may differ materially from those anticipated in forward-looking or past performance statements. IC Markets makes no representation or warranty and assumes no liability as to the accuracy or completeness of the information provided, nor any loss arising from any investment based on a recommendation, forecast or any information supplied by any third-party.

Little more upside for SPX500USDHi traders,
Last week SPX500USD went higher then expected (wavecount updated).
If this is correct, then next week we could see a little more upside for this pair.
Let's see what the market does and react.
Trade idea: Wait for price come into the Daily bullish FVG's to trade longs again. At the moment price is too high to trade.
If you want to learn more about trading FVG's & liquidity sweeps with Wave analysis, then please make sure to follow me.
This shared post is only my point of view on what could be the next move in this pair based on my technical analysis.
Don't be emotional, just trade your plan!
Eduwave

S&P 500 and the Elliott Wave TheoryAnalysis shows that the Wave 3(Black) correction is a Flat because Wave 2(Black) was a Zigzag. From the ending of Wave 3(Black), we see a shallow Wave A(Blue) forming. This is our first Wave of the 3 move correction. From A(Blue), another 3 wave move MUST occur and must go beyond the ending of Wave 3(Black) as seen. The correction of Wave A(Blue) is marked by an unfolding 3 wave move shown in Green. Waves A and B are formed after Wave A(Blue) completes. For the last 'leg' of the 3 Wave correction, we find a 5 Wave move shown in Red and this should contain all properties of a normal 5 wave move. Wave 1(Red) is followed by a Zigzag correction and we should expect a Flat correction at Wave 3(Red). Indeed a Flat is formed and is highlighted in Purple. Wave 4(Red) is complete. This sets in motion a last wave that upon completion would be the end of Wave C(Green) hence the end of Wave B(Blue) and would trigger the start of Wave 4(Black). Follow for breakdown of the same chart in the Daily time frame.

SPX Expansion with Historical DataGood morning everyone!
This week I wanted to elaborate more on my previous idea of SPX with the historical data that led to this analysis. This is almost all fundamental analysis adding in the retracement percentages which can also be evaluated through some technical instruments.
Unemployment rate is currently at 4.1%, with inflation at 2.4%. Based on the data, it is evident the market is currently in an expansion period which is why the narrative that we will see 2 interest rate drops by the end of year continues to diminish. I think we will probably see 1 before the year ends and that would just fuel the market and gain momentum to the upside.
If we were to measure the expansion of SPX going back to the 2000's, we get an extension of at least 75%. If we were to extend 75% based on the previous swing high (6,147) we could see future SPX price at 8,500. Now, do your own research, but the data is here. I expect the market to possibly retest previous high, but if you did not enter during the dip, no worries. There is still plenty of upside potential and better late than never.
Remember... CASH FLOW IS KING!
Avoid all the noise and distractions. The job of many platforms out there is to have something to put out for the public EVERYDAY! A good amount of that is noise. Look for macroeconomic news and let that be your indicator.
Historical Data:
(1) .com Bubble (2000 - 2002) We had a 50% drop of SPX. This lasted for almost 2 years before recovery.
(2) Housing Market (2007 - 2009) The SPX dropped 57% due to the collapse of subprime lenders collapsing. Housing prices decline drastically leaving people with high mortgage payments than what their homes are actually worth leading to a wave of foreclosures.
(3) Covid (2020) This was a global event with government mandated shutdowns causing the entire financial markets to come to a halt. Many business closures that led to jobs loss with an unemployment rate of approximately 15%.
(4) Inflation & Rate Hikes (2022) When Covid happened, upon recovery market expanded way too fast causing inflation to rise and the Feds to increase interest rates to slow down the economy.
(5) Tariffs (2025) Will stay away from politics on this one, however, a rebalancing of trade has taken place with some countries still working on tariff deals with the U.S. This has caused huge uncertainty for companies and corporation. VIX (fear index) reached 60.13.
Hope you enjoyed this post. Have a great rest of your week, don't forget to like and follow and Happy Trading!

Gold Bullish for 2 months followed by 3 months of Bearish?An interesting pattern developed on Gold for the monthly that could indicate 2 months of Bullish order flow to 3600 - 3800 area followed by 3 months of bearishness to 3000 - 3100 area.

Let’s talk about technical analysis & stops.Technical analysis is not your decision-making process — it’s a tool to help you structure better trading decisions by studying past price movements to anticipate likely future moves.
👉 Every time you look at a chart, you should decide:
✅ Do I want to trade at all?
✅ What’s my entry?
✅ Where’s my stop (when does my thesis fail)?
✅ What’s my target (where will I take profits)?
________________________________________
🛑 Where to put your stop?
Take the S&P 500 daily chart. It’s been trending up strongly. Many traders use an exponential moving average (EMA) as a dynamic stop.
But:
• A 9 EMA often stops you out too early on strong trends.
• Adjusting to a 15 or 16 EMA could keep you in the trade longer, letting your winners run.
In tools like TradingView, you can visually adjust the EMA and see in real time how it would have kept you in or taken you out.
________________________________________
💡 Key takeaway:
When price closes below your EMA stop — that’s your signal to exit and lock in profits.
Use TA to structure your trades, not just spot pretty patterns.
________________________________________
💬 What’s your favourite method for setting stops?
Disclaimer:
The information posted on Trading View is for informative purposes and is not intended to constitute advice in any form, including but not limited to investment, accounting, tax, legal or regulatory advice. The information therefore has no regard to the specific investment objectives, financial situation or particular needs of any specific recipient. Opinions expressed are our current opinions as of the date appearing on Trading View only. All illustrations, forecasts or hypothetical data are for illustrative purposes only. The Society of Technical Analysts Ltd does not make representation that the information provided is appropriate for use in all jurisdictions or by all Investors or other potential Investors. Parties are therefore responsible for compliance with applicable local laws and regulations. The Society of Technical Analysts will not be held liable for any loss or damage resulting directly or indirectly from the use of any information on this site.

SPX: highly optimisticThe US market celebrated on Friday the US Independence Day, after highly optimistic last two weeks. Almost every day, the S&P 500 was reaching new all time highest levels, finishing Thursday trading session at 6.279. At this moment this is officially treated as a new ATH for the index. The optimism was supported by better than expected US jobs data posted during the previous week. The NFP added 147K new jobs in June, which beated market expectations. The strong US payrolls reinforced market confidence despite concerns over trade tariffs. With inflation remaining sticky and solid jobs growth, markets have increased expectations of the Fed's rate cut in September. Currently, there is relatively low odds that the next rate cut might occur at the Julys FOMC meeting.
Tech companies were again those who led the index to the upside. The leader was for one more time Nvidia, with a weekly surge of 9,7%. AMZN was traded higher by 6,3%, MSFT by 3,9%. TSLA was struggling a bit, ending the week 0,33% higher from the week before.
Weekly news regarding trade tariffs include a US-Vietnam trade deal of 20% tariffs on imports from Vietnam. At the same time, the US exports to Vietnam will be tariffs-free. However, markets are still concerned regarding the final resolution of imposed 90-days delay of implemented tariffs for almost 180 countries around the world, a period which expires in July. On the other hand, Trump's tax mega bill was passed by the US Senate on Tuesday, and is currently awaiting final approval from the House. There were many discussions during the previous period that this tax mega bill might further increase US debt levels, which will be negatively reflected in the economy.

Dummy ideaFastest Way to Create an Idea on TradingView
Here’s a step-by-step guide to quickly publish an idea (analysis, chart, or setup) on TradingView:
1. Prepare Your Chart
• Open TradingView and set up your chart with all desired indicators, drawings, and timeframes.
2. Open the Publish Idea Window
• Shortcut: Press `Alt + P` on your keyboard to instantly open the “Publish Idea” window.
• Or: Click the Publish button at the top-right corner of your chart.
3. Fill Out the Required Fields
• Title: Enter a clear, descriptive title for your idea.
• Description: Write a brief explanation of your analysis or setup.
• Category: Select the appropriate category (e.g., Analysis, Tutorial).
• Direction: Mark your idea as Long, Short, or Neutral.
• Privacy: Choose Public or Private.
• (Optional) Add tags and related ideas for better visibility.
4. Publish
• Confirm you agree to the House Rules.
• Click Publish Idea.

SPX to 7450?Looking at the long term chart starting from the covid crash we can see 2 impulse of average 2650 pts and two retracement, so from the trump crash to 4800 we could see one last bullish impulse of around 2650 pts to target 7450 in autumn.
Now I expect a retracement to 5965-5970 area before last bullish impule

S&P 500 Daily Chart Analysis For Week of July 3, 2025Technical Analysis and Outlook:
During this abbreviated trading week, the S&P 500 Index has primarily shown an upward course, hitting and surpassing our target for the Outer Index Rally of 6235. Currently, the index demonstrates a consistent bullish trend, with the following objective for the Outer Index Rally set at 6420, followed by forthcoming targets of 6620 and 6768. Nevertheless, it is crucial to acknowledge the current price action may cause prices to retrace from their current fluctuation to test the Mean Support at 6200 before resuming their upward movement.

SPX : Next Stop @ 6800 :-)Since we are now expecting a delay in the FED cutting, there will be plenty of liquidity to spice things up.
The 'D' @ yellow had worked once before and since it has been 'used up' , its potency had been somewhat reduced.
But have no fear/worry, there would always be more 'D' ahead. The next one at 6,800
Good luck.

SPX500 Holds Above 6,225 – Bullish Trend Intact for NowSPX500 Update – Bullish Pressure Holds Above Pivot
SPX500 continues to show bullish momentum, as highlighted in our previous analysis. The price remains supported by strong buying volume above the key pivot zone at 6,225.
As long as the price stays above this level, a retest toward 6,225 remains possible before another leg higher.
However, a confirmed break below 6,225 would signal potential bearish momentum and shift the short-term structure.
Key Levels:
• Pivot Line: 6,246
• Resistance: 6,265 / 6,287 / 6,325
• Support: 6,225 / 6,191 / 6,143
