July Doesn't Disappoint - S&P Nasdaq Dow Russell All RunningS&P All Time Highs
Nasdaq All Time Highs
Dow Jones closing in on All-Time Highs (and outperforming both S&P and Nasdaq recently)
Russell 2000 playing catch up and moving higher
This is melt-up at its finest
Since US/China Trade Agreement and Middle East Ceasefire Agreement, markets have used
these two events as further catalysts to continue the upside runs
Stochastic Cycle with 9 candles suggesting a brief pause or pullback in the near-term, but
a 3-5-10% pullback is still an opportunity to position bullish for these markets
I'm only bearish if the markets show that they care with price action. The US Consumer isn't breaking. Corporate Profits aren't breaking. Guidance remains upbeat. Trump is Pro Growth and trolling Powell on the regular to run this economy and market HOT demanding cuts (history says that's a BUBBLE in the making if it's the case)
Like many, I wish I was more aggressive into this June/July run thus far, but I'm doing just fine with steady gains and income trades to move the needle and still having plenty of dry powder
on the sidelines for pullbacks
Markets close @ 1pm ET Thursday / Closed Friday for 4th of July
Enjoy the nice long weekend - back at it next week - thanks for watching!!!
USA500 trade ideas

Acorn's Smart Money S&P SignalJuly 2, 2025 - S&P broke to the upside confirming a bullish S&P signal. If correct, the bullish S&P indicator suggests the S&P will close above 6177.97 on July 17. Let’s see if the market can continue to the upside!

S&P500 bullish ahead of US employment- NFP numbersHouse Republicans moved Trump’s major tax and spending bill closer to a final vote, which could happen before his July 4 deadline. The package includes tax cuts, immigration funding, and the rollback of green energy incentives. Gamblers are raising concerns about a tax increase in the bill that could affect them.
In trade news, the US eased export rules on chip design software to China as part of an ongoing deal. China’s tone has shifted more positively, with a top official saying he’s hopeful about US-China relations and that conflict between the two is “unimaginable.”
At the Fed, Chair Jerome Powell hasn’t said if he’ll step down when his term ends in May, adding uncertainty. Trump, who wants a loyal replacement, has called for his resignation after a federal agency accused Powell of giving misleading testimony about expensive Fed building renovations.
On Wall Street, value investing made a comeback last quarter. Over 60% of active value fund managers beat their benchmarks by buying cheap industrial stocks and avoiding underperforming sectors like utilities and consumer staples.
Conclusion:
US equities are steady but cautious. Uncertainty around Fed leadership and Trump’s economic plans is keeping markets in check, while improving US-China trade relations and a shift toward value stocks are offering support.
Key Support and Resistance Levels
Resistance Level 1: 6260
Resistance Level 2: 6307
Resistance Level 3: 6355
Support Level 1: 6130
Support Level 2: 6090
Support Level 3: 6055
This communication is for informational purposes only and should not be viewed as any form of recommendation as to a particular course of action or as investment advice. It is not intended as an offer or solicitation for the purchase or sale of any financial instrument or as an official confirmation of any transaction. Opinions, estimates and assumptions expressed herein are made as of the date of this communication and are subject to change without notice. This communication has been prepared based upon information, including market prices, data and other information, believed to be reliable; however, Trade Nation does not warrant its completeness or accuracy. All market prices and market data contained in or attached to this communication are indicative and subject to change without notice.

SPX VS OILHello there.
30 years low cycle is coming to end for OIL and energy.
Every 30 years, market of energy bottom against SPX.
When buy SPX AND NAS ? Each 30 years.
1920->1950->1980->2010->2040
When Sell SPX AND NAS ? Each 25-30 years
19401->970-2000->2025-30->2055-60
Sell SPX WHEN atm ? Well.. follow the last uptrend (blackline), sell when break
Recession always come when Energy > SPX
So.. keep an Eyes on Energy.

$SPX500 Most Hated Rally to Continue?FOREXCOM:SPX500 continues into price discovery suggesting a wave (3) is still underway but nearing a its minimum target of the 1.618 Fibonacci extension target $6310. Overextension of this target will demonstrate an even stronger bullish outlook.
Long term terminal targets remains above $7000 for me.
A short term pull back is a high probability but markets can stay irrational longer than participants can stay liquid.
Safe trading

Biggest What-Ifs in Stocks (or How Investors Live with Regret)You think you’ve got regrets because you didn’t buy Nvidia NASDAQ:NVDA at $50 or sold Tesla NASDAQ:TSLA at $420? Join the club.
The stock market’s history is littered with “almost” trades, missed deals, and facepalm-worthy decisions that turned out to be trillion-dollar pivots.
This is the hall of fame for what didn’t happen — and what those stories teach us about how markets (and human nature) actually work. Call it a free masterclass in greed, fear, FOMO, and the priceless value of just sitting tight sometimes.
Take it easy today, grab your cold brew and read up on the biggest what-ifs in stock market history.
🍏 Ronald Wayne: The Patron Saint of “Oops”
Our first inductee needs no introduction. But let’s do it anyway. Ronald Wayne, the third Apple NASDAQ:AAPL co-founder, sold his 10% stake back in 1976 for the princely sum of $800. He wanted to avoid any debts if things went south. Sensible, right?
That $800 stake today would be worth more than $300 billion. That’s more than the GDP of Finland — and about 1.2 million new iPhones every single day for pretty much the rest of his life. Wayne has since said he doesn’t regret it. Which is probably the biggest lie he’s ever told.
🍿 Blockbuster’s Netflix “Pass”
In 2000, Netflix NASDAQ:NFLX was a DVD-by-mail startup with spotty profits. Reed Hastings, Netflix’s founder, knocked on Blockbuster’s door and offered to sell the whole thing for $50 million — about the price of a Hollywood production.
Blockbuster’s execs reportedly laughed him out of the room. “People will always want to drive to a store to rent a VHS,” they said, basically. Fast forward: Netflix is worth around $560 billion, and Blockbuster is down to one store that’s mostly a selfie museum for millennials who miss rewinding tapes.
💻 Microsoft’s Lifeline That Saved Apple
In 1997, Apple NASDAQ:AAPL was broke. Steve Jobs had returned but was days away from the company flat-lining for good. Enter Bill Gates.
Microsoft NASDAQ:MSFT wrote Apple a $150 million check, partly to keep antitrust regulators off its back. Jobs even appeared on stage with Gates beaming in on a giant screen like Big Brother — a moment that made every Apple fan cringe.
But that deal saved Apple’s hide. The iMac was born. The iPod followed. Then the iPhone. That $150 million is now a rounding error on Apple’s $3 trillion valuation. Sometimes your greatest rival is also your best frenemy.
🔍 Google: The $750K “Meh”
Before “Google it” became a verb, Larry Page and Sergey Brin tried to sell their little search engine to Excite — the Yahoo-lite portal that dominated the ‘90s web. The price? $750,000.
Excite’s CEO said search “wasn’t that important” — one of the worst calls in tech history. Today, Alphabet NASDAQ:GOOGL is worth over $2.1 trillion and always flashing bright on the Stock Heatmap , and Excite is a footnote in a forgotten Web 1.0 graveyard.
The lesson? Never dismiss a side project just because it doesn’t fit the spreadsheet.
💸 Masayoshi Son’s $200 Billion Slip
SoftBank’s Masayoshi Son is known for his giant, risky bets . And in 2017, he made a pretty good one: his Vision Fund scooped up a 5% chunk of Nvidia stock worth about $4 billion. He called GPUs the backbone of the AI revolution. He was right.
But by 2019, SoftBank was under pressure to tidy up its books. So Son sold the whole position for a tidy short-term profit. That stake today would be worth nearly $200 billion, given Nvidia’s rocket-fuel AI rally .
“We can cry together,” CEO Jensen Huang told Masa Son at an AI Summit in Tokyo last year. Early doesn’t always mean patient. And being “kind of right” can be the most painful lesson of all.
📊 Berkshire Hathaway: A Textile Mill’s Rebirth
Think of Berkshire Hathaway NYSE:BRK.A now — a $1 trillion behemoth. Insurance, utilities, railroads, huge piles of Apple shares . But back when Warren Buffett bought it, Berkshire was a dying textile business in New England.
Buffett only bought control because he was annoyed at the CEO’s lowball tender offer. It turned into his permanent holding company. The textile side eventually went extinct — but the insurance side became the cash-printing machine Buffett used to buy everything else.
Sometimes your best trade starts with pure pettiness.
🚀 Tesla: The Short Sellers’ Pain Cave
Here’s a more recent tale. Tesla was not long ago the most shorted stock on Earth. Everyone from hedge funds to your uncle at Thanksgiving was betting on Elon’s dream to fail.
Every now and then, the short-sellers get slapped with billions of dollars in losses, because the stock shoots up out of nowhere. The most recent example? November 12, when those naysayers nursed $7 billion in wiped out cash . Bears have been torched so many times, they might as well switch sides and sell Tesla hoodies instead.
🌌 Yahoo’s Double Miss: Google and Facebook
If you think blowing one chance is bad, try blowing two. Yahoo turned down the chance to buy Google for less than a million bucks. Then years later, they offered $1 billion for Facebook (now META NASDAQ:META ) — but bungled the negotiations and tried to lower the price. Zuck said “nope.”
But back to Google, because the story didn’t end there. In 2002, Yahoo said it wanted to buy Google for $3 billion. Brin and Page said $5 billion and Yahoo said no. Then Microsoft was ready to pay $40 billion to acquire Yahoo in 2008. But Yahoo said no.
Today, Google, Microsoft, and Meta are trillion-dollar titans. Yahoo? Sold itself for $4.5 billion, mostly for its patents, in 2016 to Verizon. Talk about slipping on the same banana peel more than once.
🧃 Apple: The Splits that Keep Giving
Want a reason to love boring old “buy and hold”? Apple NASDAQ:AAPL has split its stock five times since its 1980 IPO. If you’d bought 100 shares back then, you’d now have over 56,000 shares, plus mountains of dividends.
Next time you want to swing trade every squiggle, remember: sometimes the slowest route is the sweetest.
📝 Regret: The Only Universal Asset Class
Every trader has a “coulda, shoulda, woulda.” It’s the cost of doing business in a market that only makes sense in hindsight. Even the pros — billionaires, boards, hedge funds — have stories that make yours look tame.
Ronald Wayne reminds you that selling too soon can cost you your own island. Masayoshi Son proves being right but impatient is still being wrong. Yahoo shows that “almost” is worth exactly zero on a balance sheet.
What these stories prove is that the market’s biggest edge isn’t necessarily timing, genius, or inside scoops — it’s discipline, resilience, and sometimes a stubborn refusal to touch the sell button.
🤗 Bonus Story: Ballmer Regrets Nothing
But not every story has to be a regret story. Just look at Steve Ballmer, Microsoft ‘s former CEO. Since the early 2000s, he’s been holding his 4% stake in the software maker and that’s now worth more than $130 billion. No regrets found.
👉 What’s Your “One That Got Away”?
Now your turn : What’s your personal what-if story? Which ticker haunts you in your sleep? Drop your best missed trade or worst sell in the comments — we promise to laugh with you, not at you. Probably. Stay sharp. Stay patient!

Top fundamentals that will shape the S&P 500 this summer 2025The summer of 2025 is characterized by a combination of macroeconomic and microeconomic factors that will shape the trajectory of the US equity market. While the S&P 500 is trading close to its all-time highs and at a valuation comparable to that at the end of 2021, the strength of the upward momentum will depend on the conjunction of several key variables. Understanding these fundamentals is crucial to grasping the potential and risks awaiting investors over the coming months.
1) The trade war and economic diplomacy, the main source of uncertainty
The trade issue remains the most unpredictable at the start of the summer. The July 9 deadline for the conclusion or failure of tariff negotiations is crystallizing tensions between the United States and its main partners. The prospect of a new wave of tariffs could have a direct impact on production costs, inflation and business confidence. Trade diplomacy is thus the variable most likely to provoke volatility jolts and challenge positive earnings growth expectations. If trade agreements are signed, then this will help to sustain the S&P 500's uptrend.
2) US fiscal policy: the “One Big, Beautiful Bill”
The Trump administration's major tax bill is another hotspot. This piece of legislation calls for an extension of the tax cuts initiated in 2017 and a dramatic increase in the public debt ceiling, to the tune of $5,000 billion. While these measures potentially support consumption and private investment, their medium-term impact on public finances is uncertain. The real issue for the equity market is to assess whether these decisions will lead to a surge in long-term US bond yields. A slippage in US Treasury yields would increase corporate financing costs and undermine currently high valuation multiples. Conversely, if yields remain contained, the equity market's upward momentum could continue.
3) Inflation and the Fed's monetary policy: a delicate balance
The trajectory of inflation, in particular that of the PCE index, will be a major determinant. US inflation is currently slightly below the Fed's target. Several components, notably the services sector, which accounts for almost two-thirds of the PCE basket, are proving relatively stable. Inflationary risks are more likely to come from commodities, particularly if trade tensions reignite. Oil, which accounts for around 11% of the PCE basket, is currently showing no major warning signs, benefiting from a geopolitical calm. Real estate and healthcare are also showing reassuring indicators. Against this backdrop, the Federal Reserve is adopting a cautious stance: while several major Western central banks are moving towards a neutral rate, the Fed is stalling and conditioning its monetary pivot on visibility regarding tariffs and corporate behavior.
The timing of rate cuts is one of the biggest sticking points. According to recent signals, the first rate cut could take place as early as September. However, influential members of the FOMC, appointed by the Trump administration, are arguing for earlier easing. The political pressure is strong: Trump is calling for immediate cuts, but Chairman Powell remains in control of the agenda, taking care to preserve a consensus within the committee.
4) The job market and the likelihood of a recession
The US employment situation is an advanced barometer of the economic cycle. Weekly jobless claims and the aggregate unemployment rate are closely monitored. Historically, a significant rise in unemployment signals that the economic slowdown is already underway. For the time being, the labor market is proving resilient, but the slightest deterioration could alter investors' central scenario and reinforce recessionary expectations. This risk is one of the potential dampeners to the prevailing optimism, unless it were to accelerate the timetable for resuming the cut in the federal funds rate.
5) Second-quarter results and earnings outlook
The second-quarter earnings season is of particular importance. US companies must demonstrate their ability to deliver earnings growth in line with forecasts, even as valuation multiples remain stretched. Maintaining high price levels on the S&P 500 assumes robust earnings growth and confident guidance from management. Failing this, the risk of a correction would be high, especially as the market has already incorporated many positive factors. The weakness of the US dollar and the price of oil, as well as the current momentum in AI, could hold out some pleasant surprises for second-quarter results.
6) Geopolitics and oil, potential sources of volatility
Finally, global geopolitics is a second-order variable, but one that could suddenly become a priority. A rapid deterioration in the international situation, particularly in the Middle East or the China Sea, could affect trade flows and oil prices, fuelling renewed inflation and financial volatility.
Conclusion :
The summer of 2025 promises to be a period of strategic transition for the US equity market. Between trade diplomacy, fiscal policy, inflation, the trajectory of interest rates and earnings momentum, investors will have to deal with an accumulation of uncertain factors. If these uncertainties gradually dissipate, the uptrend could continue. Conversely, the combination of a geopolitical shock, a rebound in inflation and a political stalemate over the federal budget would have the potential to weaken the current rally.
DISCLAIMER:
This content is intended for individuals who are familiar with financial markets and instruments and is for information purposes only. The presented idea (including market commentary, market data and observations) is not a work product of any research department of Swissquote or its affiliates. This material is intended to highlight market action and does not constitute investment, legal or tax advice. If you are a retail investor or lack experience in trading complex financial products, it is advisable to seek professional advice from licensed advisor before making any financial decisions.
This content is not intended to manipulate the market or encourage any specific financial behavior.
Swissquote makes no representation or warranty as to the quality, completeness, accuracy, comprehensiveness or non-infringement of such content. The views expressed are those of the consultant and are provided for educational purposes only. Any information provided relating to a product or market should not be construed as recommending an investment strategy or transaction. Past performance is not a guarantee of future results.
Swissquote and its employees and representatives shall in no event be held liable for any damages or losses arising directly or indirectly from decisions made on the basis of this content.
The use of any third-party brands or trademarks is for information only and does not imply endorsement by Swissquote, or that the trademark owner has authorised Swissquote to promote its products or services.
Swissquote is the marketing brand for the activities of Swissquote Bank Ltd (Switzerland) regulated by FINMA, Swissquote Capital Markets Limited regulated by CySEC (Cyprus), Swissquote Bank Europe SA (Luxembourg) regulated by the CSSF, Swissquote Ltd (UK) regulated by the FCA, Swissquote Financial Services (Malta) Ltd regulated by the Malta Financial Services Authority, Swissquote MEA Ltd. (UAE) regulated by the Dubai Financial Services Authority, Swissquote Pte Ltd (Singapore) regulated by the Monetary Authority of Singapore, Swissquote Asia Limited (Hong Kong) licensed by the Hong Kong Securities and Futures Commission (SFC) and Swissquote South Africa (Pty) Ltd supervised by the FSCA.
Products and services of Swissquote are only intended for those permitted to receive them under local law.
All investments carry a degree of risk. The risk of loss in trading or holding financial instruments can be substantial. The value of financial instruments, including but not limited to stocks, bonds, cryptocurrencies, and other assets, can fluctuate both upwards and downwards. There is a significant risk of financial loss when buying, selling, holding, staking, or investing in these instruments. SQBE makes no recommendations regarding any specific investment, transaction, or the use of any particular investment strategy.
CFDs are complex instruments and come with a high risk of losing money rapidly due to leverage. The vast majority of retail client accounts suffer capital losses when trading in CFDs. You should consider whether you understand how CFDs work and whether you can afford to take the high risk of losing your money.
Digital Assets are unregulated in most countries and consumer protection rules may not apply. As highly volatile speculative investments, Digital Assets are not suitable for investors without a high-risk tolerance. Make sure you understand each Digital Asset before you trade.
Cryptocurrencies are not considered legal tender in some jurisdictions and are subject to regulatory uncertainties.
The use of Internet-based systems can involve high risks, including, but not limited to, fraud, cyber-attacks, network and communication failures, as well as identity theft and phishing attacks related to crypto-assets.

How High is High Enough - welcome to the Void & VanityUS500 | ATH Extension and Rebalancing Outlook
What is going on beyond the surface? – Here is how I will anticipate next move.
Today , price carved a new All-Time High (ATH) , extending beyond Monday’s peak and breaching the previously defined Sell Limit Bound at 6173 .
6173 level capped prior upside and served as the structural ceiling on the weekly timeframe – would demand balance.
While price has cleared 6173 , failure to retain acceptance above it raises the possibility of a rebalancing phase —necessary before any sustainable bullish expansion. This retracement, if triggered, would offer clarity on whether this breakout is a continuation or merely a premature exploration into thin liquidity.
📌 Key Observations:
• 6173 – Breached, but yet to prove retention. A weekly close and reaccumulation above here is required to maintain bullish momentum.
• 6577–6408 – Marked as a hidden liquidity pool and potential upside target zone. Price may hunt for this range, but only if it holds structurally above 6173.
• Below 6173 – Failure to anchor here may trigger a rebalance into prior value areas before any serious upside projection takes form.
Price must find equilibrium before the next leg. Any upside without that balance risks collapsing under its own weight.

#SPX500 Buy 6205.8#SPX500 Buy 6205.8
SL 6145.8
TP 6225.8
TP 6305.8
TP 6445.8
Trade at your own risk
Protect your capital
The Wizard 🧙♂️ SWFX

Bearish Outlook on the S&P 500: Time to Get ReadyFrom a long-term perspective, I see a short setup building on the S&P 500 index. The anticipated rate cuts in the U.S. — which I believe are coming soon — have historically led to market declines, despite the common perception that lower rates are bullish for equities.
Additionally, the market appears overheated: P/E ratios are at extreme highs, more than 50% above historical averages.
Given this, I expect we’ll see a downside move soon.
Since markets tend to rise slowly but fall quickly, I’m beginning to build a short position in advance. Stops may get hit, and re-entries might be necessary, but overall I see more reasons supporting this thesis than contradicting it.

Bulls and Bears Zone for 07-02-2025S&P keeps going higher after new ATH high earlier this week. Markets could go higher for a while if we see any pullback.
Level to watch: 6232 ---6234

US500 Eyes 6317 and 6510 After Historic BreakoutUS500 Eyes 6317 and 6510 After Historic Breakout
The US500 has broken out above its previous all-time high near 6147, following news of a ceasefire agreement between the U.S., Israel, and Iran.
Since then, equity markets have surged, with indices leading the rally.
US500 has now reached a fresh all-time high at 6220, confirmed by a strong weekly candle close above the former peak, adding technical value to the breakout.
Looking ahead, the US500 appears poised to extend its gains toward the 6317 and 6510 levels on the daily chart.
A stronger-than-expected Non-Farm Payroll (NFP) report could further fuel this bullish momentum.
You may find more details in the chart!
Thank you and Good Luck!
PS: Please support with a like or comment if you find this analysis useful for your trading day

Wind of Change - VOO ETFPlease watch this interesting article and feel the cool nice breeze blowing along...........
Nice , isn't it ?
As I read this article, I can't help as if a REAL giant fan was blowing at me although I know it is not REAL, just an image in my mind, magnified by the LED image and the sound as well.
And for a moment, I allowed it to play with my mind and instantly, I felt cooler.........
It is the same for reporters/journalists worldwide who made a living covering news and writing sensational news headlines to capture your eyeballs. Although we are not in Israel/Iran war, we too feel the pain and tragedy suffered by the innocent people.
How about the numerous floods happening in China ? I can't help but feel a sense of gratitude for where I am born - Singapore , free from natural disasters.
It is the same as INVESTING/TRADING. If you look at your P&L statement on a daily/hourly basis, it somehow spurs you to take an impulsive action. This is especially if you have lost some money and you wanted to quickly recover your losses. On one hand , you wanted it to go along but afraid the pullback may be too strong and your profits turn to losses again.
I remembered the book I read about - it says yesterday result was history. Whatever had happened , leave it there. Today is a fresh start and if you want to trade, you must have a brave heart and start afresh , look at your available capital (not including what you had lost) and do what you are supposed to do in the moment.
Social media is a double edge sword and every day, there are doomsday porns including marketing gurus telling you that the stock market is overvalued, tariffs this , tariffs that and you should sell. Did you ?
And there are also Asia bulls or rather China bulls that claims US funds are shifting to China and the price is going to the moon. I have often said treat this as entertainment , as reference but do your own due diligence.
A safer and lower risk is to get exposed to the VOO ETF where it is more diversified and you need not worry about a single company performance dragging the rest down.
Position sizing is also important - just because you had made some money (could be luck), it does not mean you should increase your position size (increase in risk) due to your greed. Consistency is the game in trading not BIG IN BIG OUT.

S&P500 Bullish Leg not over yet.The S&P500 index (SPX) has been trading within a Channel Up since the May 07 Low and is currently unfolding the latest Bullish Leg.
As you can see, it is far from having topped, not just by a plain trend-line (Higher Highs) perspective but also based on the Fibonacci and % rise terms relative to the previous Bullish Leg.
That peaked after a +7.10% rise, a little above the 3.0 Fibonacci extension. As a result, a 6330 Target on the short-term is more than fitting.
-------------------------------------------------------------------------------
** Please LIKE 👍, FOLLOW ✅, SHARE 🙌 and COMMENT ✍ if you enjoy this idea! Also share your ideas and charts in the comments section below! This is best way to keep it relevant, support us, keep the content here free and allow the idea to reach as many people as possible. **
-------------------------------------------------------------------------------
Disclosure: I am part of Trade Nation's Influencer program and receive a monthly fee for using their TradingView charts in my analysis.
💸💸💸💸💸💸
👇 👇 👇 👇 👇 👇

The market bias stays up, MJ stocks may be a buy here. The market continues to be biased up, and the target is likely the weekly B. MJ stocks are showing technical signs that a reversal may come. There may be other sectors similar as I think the summer bottom gamblers will start appearing now that everything else is at the highs. Gold looks like it will eventually go lower. Nat gas lost support and is likely to go lower. USOIL is bear flagging.

S&P500 key trading level at 6130Trade Tensions:
Trump has threatened higher tariffs on Japan, criticising its refusal to import U.S. rice.
The EU is open to a trade deal with the U.S. involving a 10% universal tariff on many exports, but seeks lower rates for key sectors like pharmaceuticals and semiconductors.
Markets:
U.S. equity futures are steady after the S&P 500 posted its best quarter since 2023.
Focus remains on trade developments and ongoing disputes in Washington over a major $3.3 trillion tax bill.
Canadian stocks are outperforming, led by gold miners, as investors seek safe-haven hedges amid tariff risks.
U.S. Tax Bill:
Republican leaders are struggling to secure votes.
A controversial AI regulation amendment was rejected.
Yale economists estimate the bill would cost the bottom 20% of earners $560/year, while the top 20% gain $6,055/year on average.
Corporate News:
Apple may use OpenAI or Anthropic’s AI to upgrade Siri, potentially sidelining its own AI models.
Key Support and Resistance Levels
Resistance Level 1: 6260
Resistance Level 2: 6310
Resistance Level 3: 6350
Support Level 1: 6130
Support Level 2: 6090
Support Level 3: 6055
This communication is for informational purposes only and should not be viewed as any form of recommendation as to a particular course of action or as investment advice. It is not intended as an offer or solicitation for the purchase or sale of any financial instrument or as an official confirmation of any transaction. Opinions, estimates and assumptions expressed herein are made as of the date of this communication and are subject to change without notice. This communication has been prepared based upon information, including market prices, data and other information, believed to be reliable; however, Trade Nation does not warrant its completeness or accuracy. All market prices and market data contained in or attached to this communication are indicative and subject to change without notice.

SPX partial profit pivot approaching Looks like we are entering a choppy 4-5, 4-5 topping pattern will likely take 1-2 week to play out to a point where we can see the waves more clearly. This is slightly more bullish option.

$SPX Made new ATH’s
Yesterday’s price action was flat near previous ATH’s for the first part of the day and then the second part of the day we had some nice volatility that tapped the top of the implied move at 6215 and made new ATH’s just above that at 6215.08 and then pulled back. It’s worth knowing where the top of the implied move is.

SPX500 | Bulls Need Break Above 6225 to Regain ControlSPX500 | Market Overview
The price has reached the previously mentioned resistance level at 6225.
As long as it trades below 6225, a technical correction is likely, with downside targets at 6161 and 6143. From there, the index would need to stabilize above 6143 to resume a bullish structure.
However, a 1H candle close below 6143 would confirm a deeper bearish move toward 6098.
On the upside, a 1H close above 6225 would reinforce bullish momentum, with potential to reach 6250 and 6287.
Key Technical Levels
Pivot Level: 6191
Support: 6161 / 6143 / 6098
Resistance: 6225 / 6250 / 6287

S&P 500 Outlook. Best Quarter Since 2023… But What Next?The S&P 500 just logged its best quarterly performance since Q4 2023 , surging on optimism around global trade negotiations and growing expectations that the Fed may begin cutting rates as early as September. US futures are green this morning, thanks to developments like Canada backing off digital taxes, ongoing dialogues with China ahead of the July 9 deadline, and risk-on sentiment is pushing yields and the dollar lower.
But as traders, we need to ask:
Are we witnessing a genuine economic inflection point? Or is this just a liquidity-driven rally that’s pricing in a best-case scenario?
Technical View
Support Zone: 6,150 was just broken through. And 6000, the round number level, coinciding with the 20-day EMA and previous swing level.
Resistance Levels: 6,235 is the next critical ceiling, a clean breakout could see price reach the extension level of 6,415.
Momentum Indicators: RSI remains elevated and is creeping toward the overbought. While momentum is strong, watch out for the possible development of a divergence.
Possible Scenarios
The 'Soft Landing’ Is Now the Base Case
Markets are trading as if the Fed has successfully engineered a soft landing. But that’s now fully priced in, and historically, the most dangerous trades are the ones everyone agrees on. If trade talks stall, inflation re-accelerates, or earnings disappoint, the reversal could be brutal and fast.
Risk-on Sentiment Without Volume Is a Yellow Flag
Despite the price strength, volume has been tapering off. The S&P’s recent leg up occurred on lighter-than-average participation, suggesting institutions may be watching, not chasing. That’s often the case in low-volatility summers, but it also implies that any negative catalyst could cause outsized downside moves.
Macro-Fundamentals May Not Justify Valuation Expansion
Yes, inflation is slowing, and the Fed might cut. But if they do, it’s likely because growth is weakening, not because the economy is roaring. So the very condition that triggers rate cuts could also cap earnings growth!
Projection
Bullish Scenario: A confirmed breakout above 6,280 could carry us toward 6,400–6,500 by mid-Q3, especially if the trade deals progress, July inflation comes in soft, and the Fed signals accommodation.
Bearish Risk: If price fails to hold above 6,120, especially if trade optimism fades, or inflation growth spikes or Fed rhetoric shifts hawkish again, this could then open a quick pullback toward 6,000 or lower, which also aligns with the 50-day SMA.
Key Events to Watch
July 9 Trade Talks Deadline: Any sign of stalling could bring volatility back fast.
June CPI Print (July 10): Crucial for confirming the Fed's next move.
Earnings Season Kickoff (mid-July): Tech-heavy expectations may not be easy to beat after such a strong run.
Conclusion
A record-setting quarter is impressive but not necessarily predictive. This quarter’s rally has been built more on relief and expectations than hard data. When expectations (not earnings) are doing the heavy lifting, any misstep from central banks or geopolitics could unravel gains rapidly.
A rate cut might be delayed, or inflation re-accelerates, or trade talks stall; any of these could leave equities hanging. Remember: the higher the climb without real earnings growth, the harder the fall when sentiment shifts. It's not just about the chart. It is about the narrative behind the price.
What’s your bias for Q3?
Are you buying this breakout or fading the optimism? Drop your thoughts below.

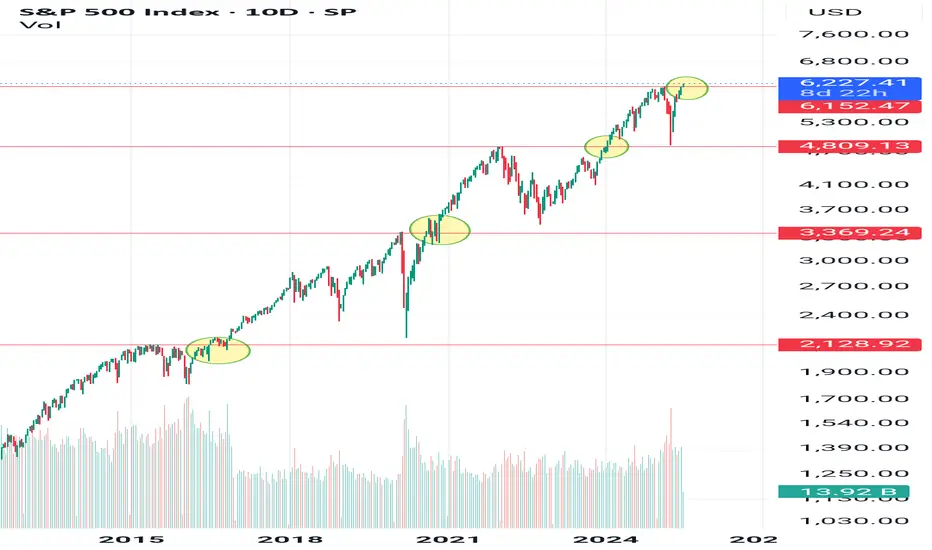
Possible "DIP" into Monday July 7 Tarrif DeadlineHello everyone,
Well we made it. ATH! Well all things must eventually dip. I see a good possibility into next Monday July 7 Tarif deadline plus we are hitting the ATH's prior tops trendline (Red Line)....
I highlight with colored boxes 3 different price targets I think it could dip to before resuming its march higher.
Let's see what happens!

SPX nearing profit pivotSeems SPX is nearing profit pivot. expect a few more waves higher. Then a larger 8%-10% correction. will likely hold through or with some profit around 6350-ish. This expected wave-02 correction will likely be the last real opportunity to close any remaining short positions.
