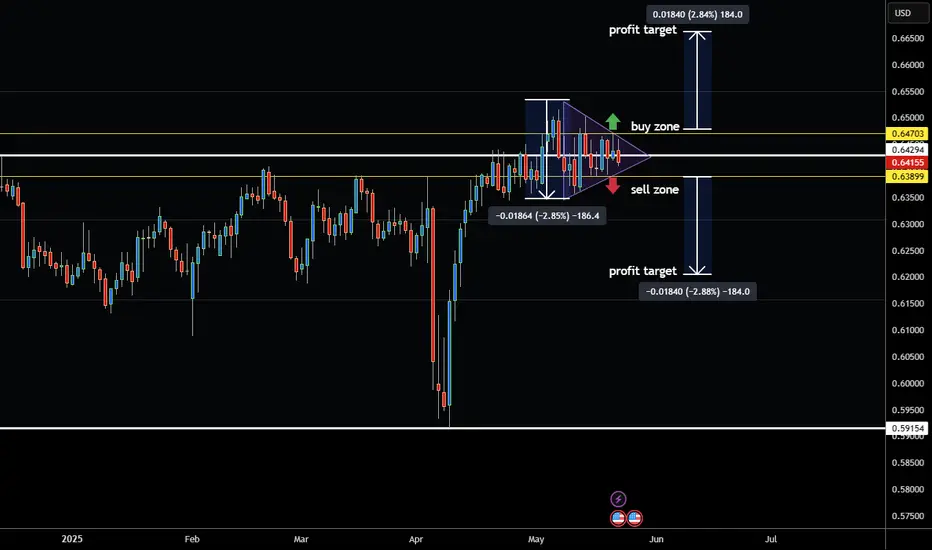
Australian Dollar Consolidation Which Way From Here?Hey traders so today we are going to look at the Austrailian Dollar which is now in chart pattern called a Symetrical Triangle.
So how do we know which way to trade the market right now?
We don't so why guess when instead we can wait for the market to confirm which way it wants to go.
These are normally known as a consolidation patterns, and normally they can break out in the direction of the prevailing trend which appears to be bullish. However they can also break against the trend so the best way to trade it is watch which side it breaks then place an order to enter on the side that market breaks out of. The the other side can then become your stop loss because most likely the market won't go to the other side.
For profit target you can measure the distance of the triangle from top to bottom so in this example 183 pips or ticks.
Always use Risk Management! (just in case your wrong in your analysis)
Hope This Helps Your Trading
Clifford
USDAUD trade ideas
AUDUSD SETUPWe will enter the given setup .
Watch for market shift on LTF for confirmation entry .
Please follow to support me !
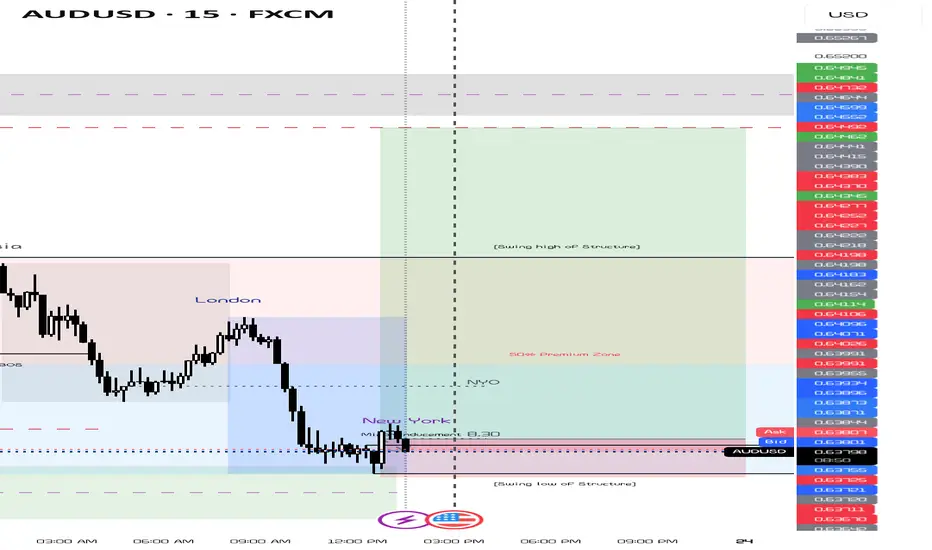
Very Great Short!Hello All. As I told you before( in very Higher TF analysis) market would collapse soon. Now it is time to go to a lower time frame and catch the market with 30 R:R ratio. and I wanna tell you after ending the war between Israel and Iran (and Victory of Iran for sure), Market will be accelerate falling. be happy and have a great time(wink)

AUDUSD likely to reach level 0.64267AUDUSD is in uptrend and might have a pullback. AUDUSD likely to reach level 0.64267
This analysis is for educational purpose only. Not an investment or financial advise.

AUD/USD SELLERS WILL DOMINATE THE MARKET|SHORT
Hello, Friends!
AUD/USD pair is trading in a local uptrend which we know by looking at the previous 1W candle which is green. On the 1D timeframe the pair is going up too. The pair is overbought because the price is close to the upper band of the BB indicator. So we are looking to sell the pair with the upper BB line acting as resistance. The next target is 0.636 area.
Disclosure: I am part of Trade Nation's Influencer program and receive a monthly fee for using their TradingView charts in my analysis.
✅LIKE AND COMMENT MY IDEAS✅

AUDUSD Analysis – Falling from the Rising WedgeAUDUSD pair broke below an ascending wedge, a bearish reversal pattern.
Clean rejection from 0.6518, with lower highs and new lower lows confirming bearish momentum.
Price is now sitting below former trendline support, retested and respected as resistance.
Bearish target points toward 0.6400–0.6380 zone, aligning with recent swing lows.
Risk invalidation sits above 0.6520, where structure fails.
Technical Bias: Bearish
Target: 0.6400
Stop-loss zone: Above 0.6520
📊 Current Bias: Bearish
🔍 Key Fundamentals Driving AUDUSD
AUD Fundamentals (Weakening):
Australian jobs data was mixed, and wage growth has plateaued.
RBA remains cautious, with expectations for rate cuts later in 2025.
AUD pressured by China growth risks and weak commodity demand.
Geopolitical drag: Australia-China tensions and weak Chinese retail data from 618 Festival dampen AUD outlook.
USD Fundamentals (Resilient):
USD remains bid on risk-off flows, especially after weak global data and ongoing Middle East tensions.
Fed remains reluctant to cut fast despite disinflation signs – supports the USD.
US data is mixed, but rate cut odds are declining (only one expected in 2025 now per dot plot).
⚠️ Risks to This Bearish View
If China announces new stimulus, AUD could rebound sharply.
A dovish surprise from the Fed (e.g. Powell softening in speeches).
Sharp rebound in risk appetite (e.g. tech-led equity rally).
🗓️ Important Events to Watch
🇨🇳 China industrial profits & PMIs
🇦🇺 RBA Meeting Minutes (July preview hints)
🇺🇸 US Core PCE (June 28)
Global risk tone: watch metals, equities, and geopolitical headlines.
🚀 Which Asset Leads?
AUDUSD is lagging other USD pairs, but will likely lead commodity FX downside if China or metals weaken further.
Watch AUDJPY and EURAUD for further confirmation of risk-off flows and Aussie weakness.


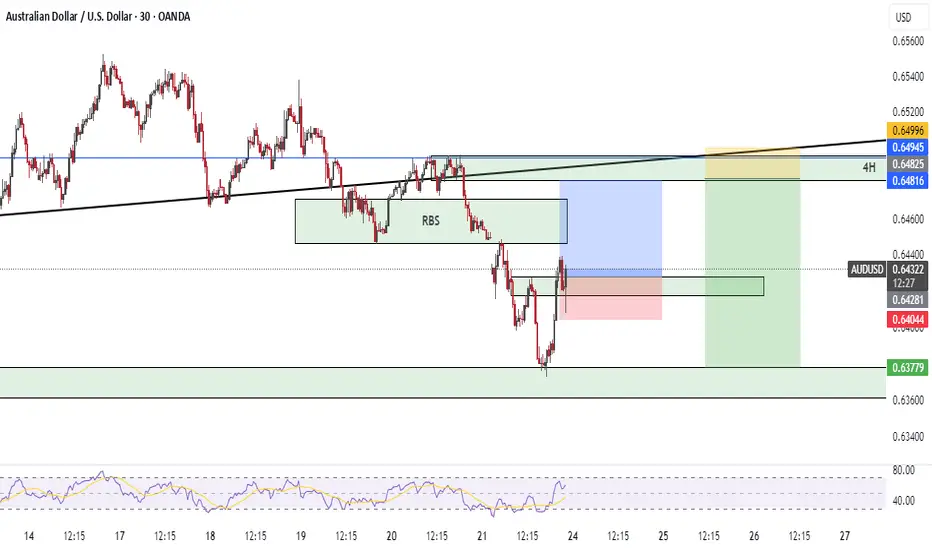
Looking To Sell AUD/USD Into 4h Supply ZoneThe market structure on AUD/USD shifted bearish last week as it created successive lower lows ah lower highs, from the 4H timeframe, we see price headed towards an area of supply.
PLAN
1. Wait for retest of Friday's lower high with candlestick confirmation to short into supply
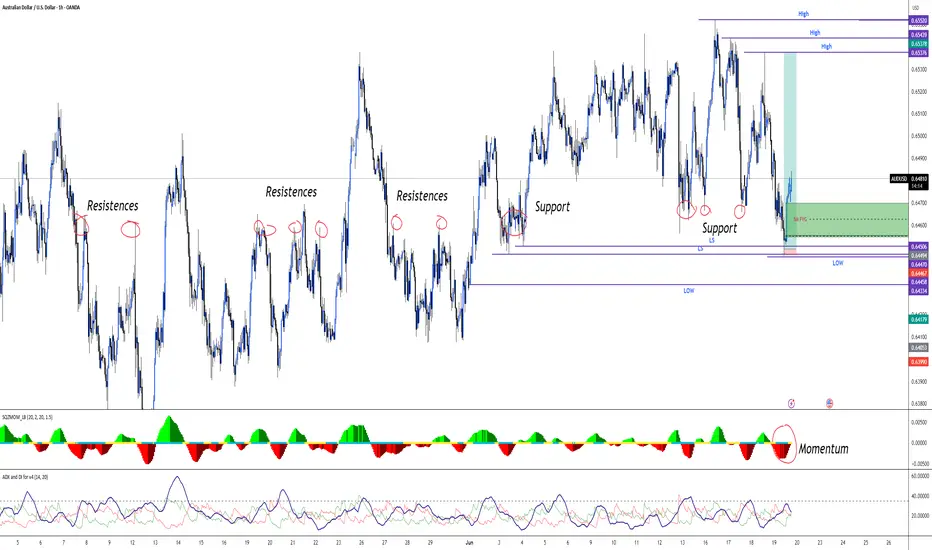
Institutional Manipulation or Perfect Setup? | AUDUSD🎯 This is a 🔥 setup no one’s talking about...
AUDUSD is quietly setting up for something big, and if we apply the VEP Trader – Liquidity Option Strategy, it could deliver a clean high-probability entry.
📍 Trend Overview (1D)
On the daily timeframe, AUDUSD shows a weak bullish trend, but here's what stands out...
The candle on June 18 swept liquidity from 5 previous days:
📅 June 3
📅 June 4
📅 June 13
📅 June 17
📅 June 18
This is a textbook case of institutional liquidity grab. 😮
💧 What Does VEP Trader Tell Us?
When price clears multiple daily lows/highs in a single candle, our strategy flags it as a potential reversal zone.
📸 If you switch to the 1-hour timeframe, you’ll notice something massive:
A huge institutional gap from 0.64554 to 0.64700, exactly where price left behind liquidity.
🚨 What Are We Watching For?
We’re looking for a potential pullback into that gap, alongside:
A bullish divergence on momentum
Support zones holding from previous reactions
Confirmation via Squeeze Momentum
If these align... the opportunity is 🔥.
🎯 Do You See What I See?
👉 Was this manipulation, or just clean price action?
Drop your thoughts in the comments.
Setups like this don’t show up every day — but when they do, you better be ready.
#AUDUSD
#VEPTrader
#LiquiditySweep
#FairValueGap
#SmartMoneyConcepts
#ForexSetup
#PriceActionTrading
#InstitutionalTrading
#CleanStructure
#ForexWatchlist
#GapTrading
#TradingBreakdown
#MomentumDivergence
#RiskRewardRatio
#TradeWhatYouSee
#LiquidityZones
#ForexReversal
#SqueezeMomentum
#TechnicalAnalysis
#ForexOpportunities
#ReversalTrade
#ScalpingSetup
#DayTradingForex
#ForexStrategy
#ForexTraderLife
The US dollar decline is a massive opportunity Hey all,
just a thesis i've had for a while now and there is many charts and data points ive used to get confidence in this. Short term I see the AUD decreasing on the lower demand for out exports (iron, coal, copper), Also house I see an economic contraction likely as house prices have already priced out many and borrowing cost are still elevated from the pandemic lows. With the uncertainty of a possible trade wars, military wars and energy prices i dont see the RBA or Fed lowering rates to what the market is expecting. This will also help the short term decline of the AUD. But once more clarity, economic activity picks up and stimulus either from the fed lowering rates and/or government spending more to keep voters this will fundamentally show the over supply of USD. After all recessions and then subsequent stimulus the USD rises for the crisis and then declines for the next 2 years on Average I see the same playing out but most likely to an even greater scale given the major over supply and focus on the USD.

AUD/USD: The Clearest Short Opportunity This WeekThis week, the macro and market landscape provides a rare alignment across all major models—making AUD/USD the standout short opportunity among G10 FX pairs.
Key Reasons for the Bearish AUD/USD Bias:
1. Commitment of Traders (COT):
Institutional positioning has turned decisively bearish on the Australian dollar, with net shorts increasing and sentiment remaining negative.
2. Z-Score & Positioning Extremes:
Z-Score indicators confirm a below-average long bias for AUD, highlighting that recent speculative flows are heavily skewed to the short side.
3. EXO/Score Model:
Our EXO (macro scoring) model gives AUD/USD a clear SHORT rating, with no offsetting bullish factors in the “core” or “risk/reward” signals.
4. Commodity Edge – Iron Ore:
Iron ore prices, a crucial driver for AUD, have sharply declined in recent weeks. This is a classic “canary in the coal mine” for AUD weakness historically, persistent iron ore declines precede broader AUD selloffs.
5. Sentiment & Risk Environment:
Despite global “risk-on” sentiment, AUD is unable to benefit, as both macro and market participants rotate away from commodity FX and into USD strength.
6. Endo (Fundamental) Model:
While Australia’s macro data still looks solid on a lagging basis, all faster models (positioning, flows, sentiment, commodities) point to an imminent shift typically, ENDO lags in catching turning points.
Conclusion & Tactical View:
SHORT AUD/USD is the highest conviction trade for this week, backed by full alignment of macro, positioning, sentiment, and real-economy factors.
Expect continued downside pressure while commodity markets and COT data remain bearish.
For active traders, the first 3–7 days following this setup historically provide the highest reward-to-risk moves.

Could the Aussie bounce from here?The price is falling towards the pivot and could bounce to the 1st resistance.
Pivot: 0.6410
1st Support: 0.6344
1st Resistance: 0.6539
Risk Warning:
Trading Forex and CFDs carries a high level of risk to your capital and you should only trade with money you can afford to lose. Trading Forex and CFDs may not be suitable for all investors, so please ensure that you fully understand the risks involved and seek independent advice if necessary.
Disclaimer:
The above opinions given constitute general market commentary, and do not constitute the opinion or advice of IC Markets or any form of personal or investment advice.
Any opinions, news, research, analyses, prices, other information, or links to third-party sites contained on this website are provided on an "as-is" basis, are intended only to be informative, is not an advice nor a recommendation, nor research, or a record of our trading prices, or an offer of, or solicitation for a transaction in any financial instrument and thus should not be treated as such. The information provided does not involve any specific investment objectives, financial situation and needs of any specific person who may receive it. Please be aware, that past performance is not a reliable indicator of future performance and/or results. Past Performance or Forward-looking scenarios based upon the reasonable beliefs of the third-party provider are not a guarantee of future performance. Actual results may differ materially from those anticipated in forward-looking or past performance statements. IC Markets makes no representation or warranty and assumes no liability as to the accuracy or completeness of the information provided, nor any loss arising from any investment based on a recommendation, forecast or any information supplied by any third-party.

AUDUSD H4 AnalysisAUDUSD Showing a Bearish Flag. If it breaks this zone above, Most probably can fly up to 0.65018 and higher to 0.65379. If no, Can rally between 0.64068 or even lower to 0.63878. Trading Analysis from 23-06-25 to 27-06-25. Take your risk under control and wait for market to break support or resistance on smaller time frame. Best of luck everyone and happy trading.🤗

AUDUSDAUD/USD: 10-Year Bond Yields, Interest Rate Differential, UIP, and Carry Trade
1. Current Rates and Yield Differential
Metric Australia (AUD) United States (USD) Differential (AUD - USD)
10-Year Bond Yield 4.21% 4.38% -0.17% (-17 bps)
Policy Interest Rate 3.85% 4.25%–4.50% -0.40% to -0.65%
Australia's 10-year yield eased to 4.21% on June 20, 2025, after RBA rate cuts.
The US 10-year yield held at 4.38% amid Fed policy stability.
The negative yield spread (-17 bps) reflects Australia's lower long-term rates relative to the US.
2. Uncovered Interest Rate Parity (UIP)
UIP Theory: Predicts that currency exchange rates should adjust to offset interest rate differentials. For AUD/USD:
This implies the AUD should depreciate against the USD to neutralize the rate advantage.
Empirical Reality: UIP often fails short-term. Since 2008, higher-yield currencies (like USD) frequently appreciate, contradicting UIP.
3. Carry Trade Dynamics
Strategy: Borrow AUD at 3.85% and invest in USD at 4.38% for a positive carry of +0.53%.
Risks:
AUD appreciation risk: Economists forecast AUD/USD rising to 0.65–0.67 by end-2025, potentially eroding gains.
Volatility: US tariff policies and global trade uncertainty amplify currency swings.
4. Market Outlook
AUD Drivers: RBA rate cuts (3.85%) and commodity dependence may limit AUD strength despite forecasts.
USD Drivers: Fed's "higher for longer" stance (4.25%–4.50%) supports USD yield appeal.
Carry Viability: The USD-funded carry (borrow AUD → invest USD) offers modest gains but requires hedging against AUD appreciation risks.
Key Relationships Summary
Concept AUD/USD Implication Current Status
Yield Spread Negative (-17 bps) → USD yield advantage Favors USD investments
UIP Condition AUD should depreciate; often fails AUD appreciation likely
Carry Trade +0.53% carry (USD-funded) Profitable if AUD stable/weak
Primary Risk AUD appreciation erodes carry returns Forecast: AUD ↑ to 0.67
Conclusion
The negative yield spread (-17 bps) and interest rate differential (-0.40% to -0.65%) favor USD investments over AUD.
UIP predicts AUD depreciation but historically fails; AUD is instead projected to appreciate to 0.67 in 2025.
Carry trades borrowing AUD to invest in USD offer a +0.53% yield pickup but face significant risk from forecasted AUD strength.
Investors should monitor RBA/Fed policy shifts and global trade tensions for carry trade adjustments.
#AUDUSD

AUDUSD Technical & Order Flow AnalysisOur analysis is based on a multi-timeframe top-down approach and fundamental analysis.
Based on our assessment, the price is expected to return to the monthly level.
DISCLAIMER: This analysis may change at any time without notice and is solely intended to assist traders in making independent investment decisions. Please note that this is a prediction, and I have no obligation to act on it, nor should you.
Please support our analysis with a boost or comment!

AUDUSD TRADE SETUPWait for retest the entry level and bearish momentum then take a trade for Sell othewise skip this setup


AUDUSD Potential Long - Dependent on PA Market openAUD/USD Long Setup – 15M Chart Analysis
Looking at a potential long on AUD/USD after price tapped into demand and swept liquidity. The area aligns with a fair value gap and previous order block, suggesting interest from larger players.
Two Entry Options:
1. Aggressive: Buy limit at the order block (riskier, no confirmation).
2. Conservative: Wait for break of structure, then retest into FVG with bullish price action for confirmation.
Targets:
Target 1: 0.6470
Target 2: 0.6480
Target 3: 0.6490
Extended Target: 0.6530 (only if 0.6490 is breached and price holds above)
Important Notes:
This setup is forecast-based and depends on how price opens and reacts.
Entry should follow a clear confirmation, especially after a liquidity sweep.
Ideal confirmation: Break of structure followed by a retest with bullish PA on lower timeframes (M5/M1).
Invalidation: A clean break and close below 0.6430 would invalidate this idea.
Stay disciplined. Trade the plan, not the prediction.

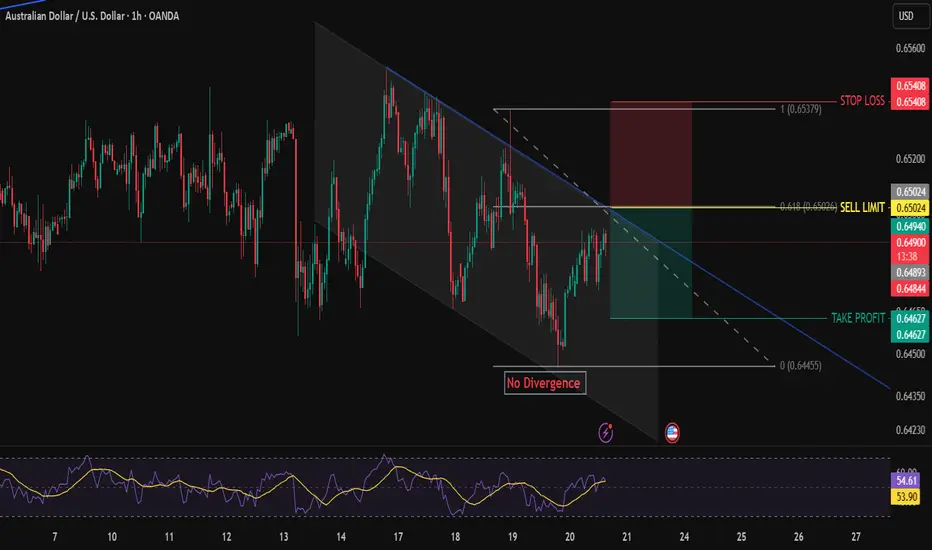
AUDUSD BEARISH SETUP AUDUSD price is moving in down trend.
At rsi no divergence no any reversal pattern.
I will take entry at fib level 0.618 , also here is the bearish trend line.
Sell limit order with SL is previous LH.
Manage your trade accordingly.

AUDUSD Trading Opportunity! BUY!
My dear subscribers,
This is my opinion on the AUDUSD next move:
The instrument tests an important psychological level 0.6464
Bias - Bullish
Technical Indicators: Supper Trend gives a precise Bullish signal, while Pivot Point HL predicts price changes and potential reversals in the market.
Target - 0.6495
About Used Indicators:
On the subsequent day, trading above the pivot point is thought to indicate ongoing bullish sentiment, while trading below the pivot point indicates bearish sentiment.
Disclosure: I am part of Trade Nation's Influencer program and receive a monthly fee for using their TradingView charts in my analysis.
———————————
WISH YOU ALL LUCK

Long trade
🟢 Trade Journal Entry – Buyside Trade
📍 Pair: AUDUSD
📅 Date: Tuesday, June 17, 2025
🕒 Time: 3:00 PM (NY Session PM)
⏱ Time Frame: 1 Hour
📈 Direction: Buyside
📊 Trade Breakdown:
Entry Price 0.64738
Profit Level 0.65380 (+0.99%)
Stop Loss 0.64639 (−0.15%)
Risk-Reward
Ratio 6.48 : 1
🧠 Context / Trade Notes:
1HR TF Execution:
Entry aligned with bullish OB on the 1hr chart following a clean mitigation and rejection candle.
Stacked Confluences:
Liquidity sweep, OB retest, and session timing aligned for a high-conviction buyside setup.
