AUDUSD Breakout and Potential RetraceHey Traders, in today's trading session we are monitoring AUDUSD for a buying opportunity around 0.64900 zone, AUDUSD was trading in a downtrend and successfully managed to break it out. Currently is in a correction phase in which it is approaching the retrace area at 0.64900 support and resistance zone.
Trade safe, Joe.
USDAUD trade ideas

AUD/USD Poised for Breakout ahead of NFPsThe Australian Dollar broke back above the 200-day moving average this week with AUD/USD testing resistance at the 65-handle today. Its decision time for the Aussie as the bulls threaten to breakout of a multi-month range in price.
Aussie is testing resistance today at the 2025 high-close / 61.8% extension of the Friday rally at 6495-6504 with key resistance seen just higher at 63540/50- a region defined by the 61.8% retracement of the September decline and the 100% extension. Note that the upper parallel converges on this threshold into the close of the week and a breach / close above would be needed to fuel the next major leg of the Aussie advance. Initial breakout objectives eyed at the September low at 6622 and the November high-day close (HDC) at 6680.
Initial support rests with monthly open / 200-day moving average at 6432/43 and is backed closely by the May open at 6402. Ultimately, a break / close below the April / August lows at 6348/62 would be needed to suggest a more significant high is in place / a larger correction is underway towards broader bullish invalidation at 6300- look for larger reaction there IF reached.
Bottom line: Aussie is attempting to mark a fresh yearly high-close today but still shy of uptrend resistance just higher. The immediate focus is on a breakout of the weekly opening-range for guidance with the long-bias vulnerable into the upper parallel. From at trading standpoint, losses would need to be limited to 6400 IF price is heading higher on this stretch with a close above the 6550 needed to fuel the next major leg of the April advance.
-MB


Evening Forecast on AUDUSD 4/06/2025Hello this is my Evening Forecast on AUDUSD 4/06/2025. Curious for your comments and guidance.

AUDUSD A Fall Expected! SELL!
My dear followers,
I analysed this chart on AUDUSD and concluded the following:
The market is trading on 0.6494 pivot level.
Bias - Bearish
Technical Indicators: Both Super Trend & Pivot HL indicate a highly probable Bearish continuation.
Target - 0.6464
Safe Stop Loss - 0.6512
About Used Indicators:
A super-trend indicator is plotted on either above or below the closing price to signal a buy or sell. The indicator changes color, based on whether or not you should be buying. If the super-trend indicator moves below the closing price, the indicator turns green, and it signals an entry point or points to buy.
Disclosure: I am part of Trade Nation's Influencer program and receive a monthly fee for using their TradingView charts in my analysis.
———————————
WISH YOU ALL LUCK

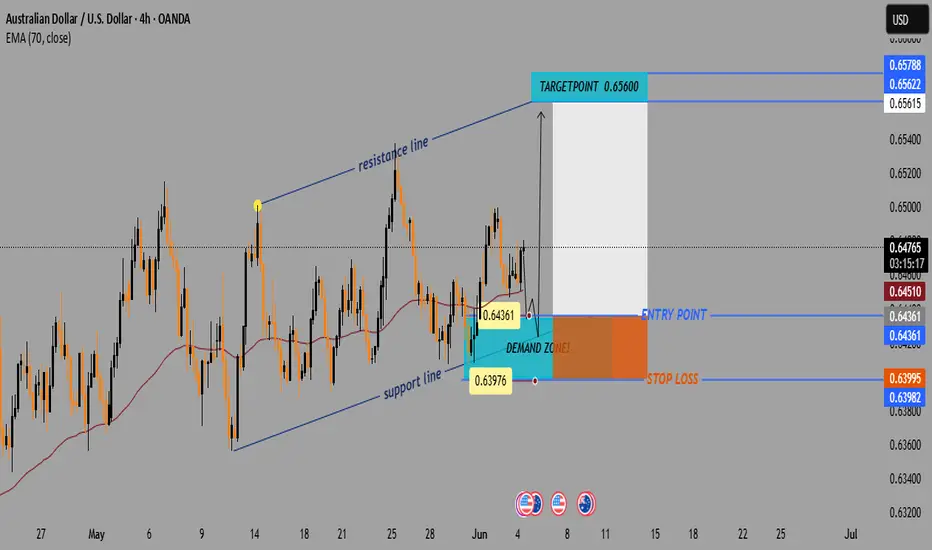
AUD/USD Bullish Setup: Demand Zone Bounce Toward 0.65600📈 Price Channel Analysis
🔼 The pair is moving within an ascending channel: • Support Line 🟦 – lower trendline showing bullish structure
* Resistance Line 🟥 – upper boundary acting as potential target
💡 This suggests bullish momentum is intact unless the price breaks below support.
📌 Key Trade Levels
🔵 Entry Point: 0.64361
* 👇 Positioned just above the DEMAND ZONE
* 📍Near the 70 EMA — a key dynamic support
🟨 Demand Zone: Area between 0.6400 – 0.6436
* 🧲 Buyers are expected here
* Good spot for a bullish entry
🔴 Stop Loss: 0.63995
* 🚨 Below the demand zone = limited risk
🟢 Target Point: 0.65600
* 🎯 Aligned with the upper resistance line
* Nice upside potential
⚙️ Technical Indicator
📉 EMA 70 (red line) = 0.64510
* Price is bouncing near it
* 📊 Acts as trend support — confirming buy idea
📊 Risk-to-Reward Ratio
🔻 Risk: ~36 pips (Entry → Stop Loss)
🔺 Reward: ~124 pips (Entry → Target)
✅ R:R Ratio ≈ 3.4:1 👍
🧠 Trade Idea Summary
📘 Trade Type 🔼 Buy (Long)
💰 Entry 0.64361
🛑 Stop Loss 0.63995
🎯 Target 0.65600
🌟 Bias Bullish
🔍 Final Thoughts
✅ Strong setup within a bullish channel
📉 EMA support + 🟦 Demand zone = Good confluence
📅 Watch out for USD news (see icons below chart)
AUD/USD BEARISH BIAS RIGHT NOW| SHORT
Hello, Friends!
Previous week’s green candle means that for us the AUD/USD pair is in the uptrend. And the current movement leg was also up but the resistance line will be hit soon and upper BB band proximity will signal an overbought condition so we will go for a counter-trend short trade with the target being at 0.643.
Disclosure: I am part of Trade Nation's Influencer program and receive a monthly fee for using their TradingView charts in my analysis.
✅LIKE AND COMMENT MY IDEAS✅

AUDUSD.I am lokking for buys and you can look aslos if yo u like the idea... fand tdo trade managament


AUDUSD potential buyHigher timefeames price is bullish and internally we have broke to the upside. Price came down to supply/demand zone and given a reaction. During Sydney its a possibility it can continue upward.

Bearish reversal off 61.8% Fibonacci resistance?AUD/USD is rising towards the resistance level which is a pullback resistance that lines up with the 61.8% Fibonacci retracement and could reverse from this level to our take profit.
Entry: 0.6477
Why we like it:
There is a pullback resistance level that aligns with the 61.8% Fibonacci retracement.
Stop loss: 0.6496
Why we like it:
There is a pullback resistance level.
Take profit: 0.6450
Why we like it:
There is an overlap support level.
Enjoying your TradingView experience? Review us!
Please be advised that the information presented on TradingView is provided to Vantage (‘Vantage Global Limited’, ‘we’) by a third-party provider (‘Everest Fortune Group’). Please be reminded that you are solely responsible for the trading decisions on your account. There is a very high degree of risk involved in trading. Any information and/or content is intended entirely for research, educational and informational purposes only and does not constitute investment or consultation advice or investment strategy. The information is not tailored to the investment needs of any specific person and therefore does not involve a consideration of any of the investment objectives, financial situation or needs of any viewer that may receive it. Kindly also note that past performance is not a reliable indicator of future results. Actual results may differ materially from those anticipated in forward-looking or past performance statements. We assume no liability as to the accuracy or completeness of any of the information and/or content provided herein and the Company cannot be held responsible for any omission, mistake nor for any loss or damage including without limitation to any loss of profit which may arise from reliance on any information supplied by Everest Fortune Group.

03.06.25 AUDUSD Trade Recap (Breakeven Manual Close)A long position taken on AUDUSD for a breakeven manual close, full explanation as to why I made this decision in the recap and my current thoughts on this pairs next move

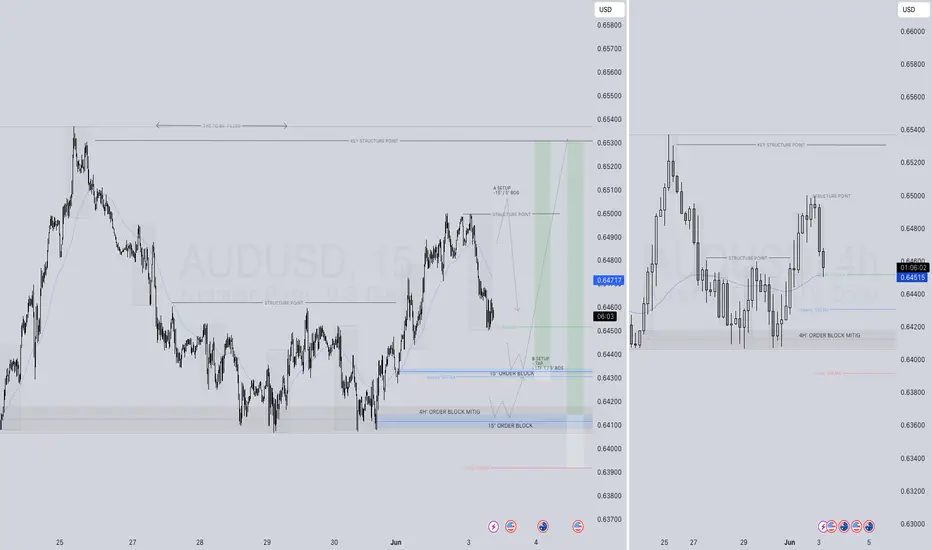
AUDUSD LONG FORECAST Q2 W23 D3 Y25👀 AUDUSD LONG FORECAST Q2 W23 D3 Y25
Professional Risk Managers👋
Welcome back to another FRGNT chart update📈
Diving into some Forex setups using predominantly higher time frame order blocks alongside intraday confirmation & breaks of structure.
Let’s see what price action is telling us today! 🔥
💡Here are some trade confluences📝
✅Weekly 50 EMA
✅Daily 50 EMA
✅15’ order block
✅Intraday bullish breaks of structure
🔑 Remember, to participate in trading comes always with a degree of risk, therefore as professional risk managers it remains vital that we stick to our risk management plan as well as our trading strategies.
📈The rest, we leave to the balance of probabilities.
💡Fail to plan. Plan to fail.
🏆It has always been that simple.
❤️Good luck with your trading journey, I shall see you at the very top.
🎯Trade consistent, FRGNT X
AUDUSD Asia SessionWe could see bullish momentum during the Asian session pushing price into the upper supply zone around 0.65200. From there, we’ll be monitoring for bearish price action (PA) to potentially confirm a short setup.
If confirmation aligns, the short idea targets the demand zone between 0.64600–0.64500.
This is a forecast — not a signal. Trade execution will depend on what price does upon reaching the supply. We’ll drop to the H1 or M15 to refine entries if bearish confirmations present themselves.
Higher Timeframe Context: clearly marked HTF supply. Price has made a corrective leg up into this zone.
Liquidity & Reaction Area: There's likely resting liquidity above the most recent highs before the 0.65200 zone — perfect for a sweep.
Entry Plan: Smart to wait for CHoCH or BOS on LTF once we enter the supply zone. Avoid rushing — let the zone prove itself.
Target Area: The 0.64600–0.64500 zone aligns with previous structure and a minor FVG — solid short-term TP.

02.06.25 Morning ForecastPairs on Watch -
FX:AUDUSD
FX:USDJPY
FX:EURGBP
A short overview of the instruments I am looking at for today, multi-timeframe analysis down to what I will be looking at for an entry. Enjoy!

audusd sell signal. Don't forget about stop-loss.
Write in the comments all your questions and instruments analysis of which you want to see.
Friends, push the like button, write a comment, and share with your mates - that would be the best THANK YOU.
P.S. I personally will open entry if the price will show it according to my strategy.
Always make your analysis before a trade

AUD/USD Coiling for Breakout as Wedge Tightens Below 200-day SMAAUD/USD is threatening a breakout from a bullish ascending triangle pattern after weeks of tight consolidation:
Triangle Pattern: The pair has carved out a clear ascending triangle, marked by higher lows and resistance near 0.6500. Today's breakout attempt is the most convincing yet.
Key Levels in Play: 0.6500 remains the neckline to beat, while the 200-day SMA (currently near 0.6446) has served as a gravity line for weeks. A daily close above both would mark a significant technical shift.
Momentum Gauges: RSI is lifting off the 50 level, hinting at building bullish momentum. MACD is attempting to cross above the zero line but still lacks follow-through.
Targets: A confirmed breakout opens the door toward the 0.6558 Fibonacci level, with 0.6730 a stretch target if momentum builds.
Failure to break higher from here could bring a sharp drop back toward support near 0.6360. Keep an eye on volume and closing strength.
-MW

AUD/USD - Triangle Breakout (02.06.2025)The AUD/USD pair on the M30 timeframe presents a Potential Buying Opportunity due to a recent Formation of a Triangle Pattern. This suggests a shift in momentum towards the upside and a higher likelihood of further advances in the coming hours.
Possible Long Trade:
Entry: Consider Entering A Long Position around Trendline Of The Pattern.
Target Levels:
1st Resistance – 0.6490
2nd Resistance – 0.6512
🎁 Please hit the like button and
🎁 Leave a comment to support for My Post !
Your likes and comments are incredibly motivating and will encourage me to share more analysis with you.
Best Regards, KABHI_TA_TRADING
Thank you.
Disclosure: I am part of Trade Nation's Influencer program and receive a monthly fee for using their TradingView charts in my analysis.

AUDUSD The Target Is DOWN! SELL!
My dear friends,
My technical analysis for AUDUSD is below:
The market is trading on 0.6477 pivot level.
Bias - Bearish
Technical Indicators: Both Super Trend & Pivot HL indicate a highly probable Bearish continuation.
Target - 0.6446
Recommended Stop Loss - 0.6495
About Used Indicators:
A pivot point is a technical analysis indicator, or calculations, used to determine the overall trend of the market over different time frames.
Disclosure: I am part of Trade Nation's Influencer program and receive a monthly fee for using their TradingView charts in my analysis.
———————————
WISH YOU ALL LUCK
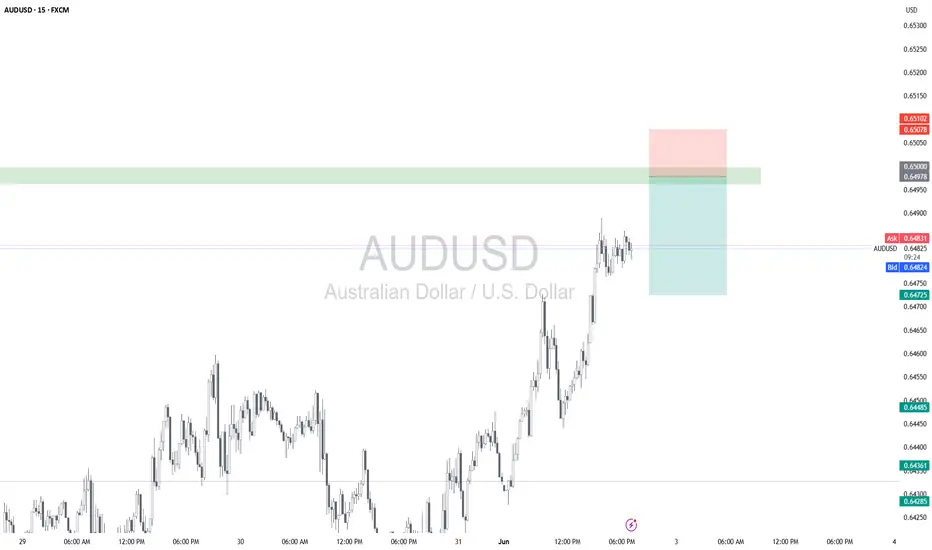
AUDUSD SELLAUD/USD – Short Setup Alert
🔹 Entry: 0.64978
🔹 SL: 0.65078 (🔴 10 pips)
🔹 TP: 0.64725 (✅ 25.3 pips)
🔹 RR: 1:2.5
📊 Reason:
🔸 Previous bearish structure intact
🔸 Clean downside inefficiency toward 0.6472
🕐 15M Chart Bias
Be alert for signs of reversal or early wick rejections near SL.
AUDUSD Will Move Lower! Sell!
Please, check our technical outlook for AUDUSD.
Time Frame: 9h
Current Trend: Bearish
Sentiment: Overbought (based on 7-period RSI)
Forecast: Bearish
The market is approaching a key horizontal level 0.648.
Considering the today's price action, probabilities will be high to see a movement to 0.644.
P.S
Overbought describes a period of time where there has been a significant and consistent upward move in price over a period of time without much pullback.
Disclosure: I am part of Trade Nation's Influencer program and receive a monthly fee for using their TradingView charts in my analysis.
Like and subscribe and comment my ideas if you enjoy them!

SELL AUDUSDAfter a strong bullish surge at market open, USD pairs' momentum has slowed. We can expect a reversal from here to establish support at 0,6444

AUD/USD – Rejection at Major Supply | Downside Move Incoming? AUD/USD is dancing around the 0.6477 zone, right inside a well-respected supply area that has held since March. Each touch here has resulted in a strong bearish reaction. Is history about to repeat itself again?
🔵 Key Levels:
Supply Zone: 0.64500 – 0.64900 (Current rejection area)
Mid-level Support: 0.62422
Demand Zone: 0.59688 – 0.60000
⚠️ Price Action Insights:
Rejection from the top supply zone after repeated tests — suggesting supply is still strong.
Bearish pressure could send the pair back down to 0.6242 and potentially even lower to 0.5968 if sellers dominate.
Recent price behavior shows lower highs, and failure to break resistance = potential distribution phase.
🔻 Bearish Outlook:
Watch for bearish confirmation candles or break of intraday trendline support.
Target 1: 0.62422
Target 2: 0.59688
🧠 Pro Tip:
Look for divergence, volume spikes, or structure breaks around this area to catch a high-RR short entry. 📉
---
💬 What’s your take? Are you shorting AUD/USD here or expecting a breakout this time?
Let’s hear your strategy 👇👇
#AUDUSD #Forex #PriceAction #SupplyAndDemand #LuxAlgo #4HChart #TechnicalAnalysis #SmartMoney #TradingView #DollarIndex
