AU BULLISH TREND Looking for support on daily bullish trendline, looking to see price respect the TL and for price to start looking for higher levels.
USDAUD trade ideas

AUDUSD InsightHello to all our subscribers!
Please share your personal opinions in the comments. Don’t forget to like and subscribe!
Key Points
- U.S. President Trump stated that “he received reports that the EU has reached out to quickly schedule talks,” calling it “a positive development.”
- The Japanese yen strengthened as speculation grows that the Ministry of Finance may reduce the issuance of long-term government bonds.
- The U.S. CB Consumer Confidence Index came in at 98, significantly beating market expectations of 87.1.
Major Economic Events This Week
+ May 28: FOMC Meeting Minutes
+ May 29: U.S. Q1 GDP
+ May 30: U.S. April Core PCE Price Index
AUDUSD Chart Analysis
The pair is currently showing limited movement between the 0.64000–0.65000 range, suggesting a wait-and-see market stance. However, as higher lows are being formed, a potential upward trend appears likely. The projected resistance level is around 0.69000. Unless the price breaks below the support line at 0.63000, we will continue to view the outlook as bullish.

AUDUSD Daily Squeeze – Breakout LoadingAUDUSD is pressing against descending trendline resistance, forming a bullish continuation wedge just above the 0.6420–0.6450 support zone (50% Fib level). Price has been consolidating tightly, suggesting a potential breakout setup is developing.
Key Levels:
Resistance: 0.6500 – 0.6547 (wedge top and 61.8% Fib)
Support: 0.6420 (local structure), 0.6300 (deeper demand zone)
Bullish Target: 0.6718 → 0.6900 → 0.6950
Invalidation: Daily close below 0.6410
Scenarios:
🔹 Bullish Breakout
Clean break above wedge resistance
Momentum push toward 0.6700–0.6900 zone
Confirmation = daily close above 0.6547 (Fib confluence)
🔹 Fakeout + Pullback
Temporary rejection leads to retest of 0.6420–0.6400
Holds support = high-probability long setup for second wave up
Outlook:
Bias: Bullish
AUDUSD is building bullish pressure after defending key support. Wedge structure favors breakout continuation, especially if global risk sentiment remains firm and USD softens.

AUD_USD LONG FROM RISING SUPPORT|
✅AUD_USD is trading along
The rising support line
And as the pair will soon retest it
I am expecting the price to go up
To retest the supply levels above 0.6460
LONG🚀
✅Like and subscribe to never miss a new idea!✅
Disclosure: I am part of Trade Nation's Influencer program and receive a monthly fee for using their TradingView charts in my analysis.

Time to buy some Aussie Dollars The weekly chart shows that the worst may be over for the Aussie dollars after suffering a huge sell down on 31/03/25, going down below 0.60, revisiting the low of 20/4/20 candle.
I am more in favour of catching the up or downtrend but not necessarily the beginning of it since that is more of a luck than skill, imo. So, with a good risk/reward ratio, the US dollar losing its value , people are dumping US bonds , spiking yields to 5% and possibly higher , it is ripe to go LONG on the Aussie dollars.
Best of luck and see you at 0.67 level.
As usual, please DYODD

Ready to buy AUDUSDTrade Screenshot Buy
Setup : TBO Buy
Pair : AUDUSD
CS Date : 27 may 25
CS TIME : 20:00 MY
Ready To Buy
1. TBO
2. CSR Bullish Engulfing
3. Entry Half candle Price
Following DXY continues bearish

The blue Monday signal update The market went as anticipated..but it takes years of practice to understand price action..you can not just trade with basic knowledge

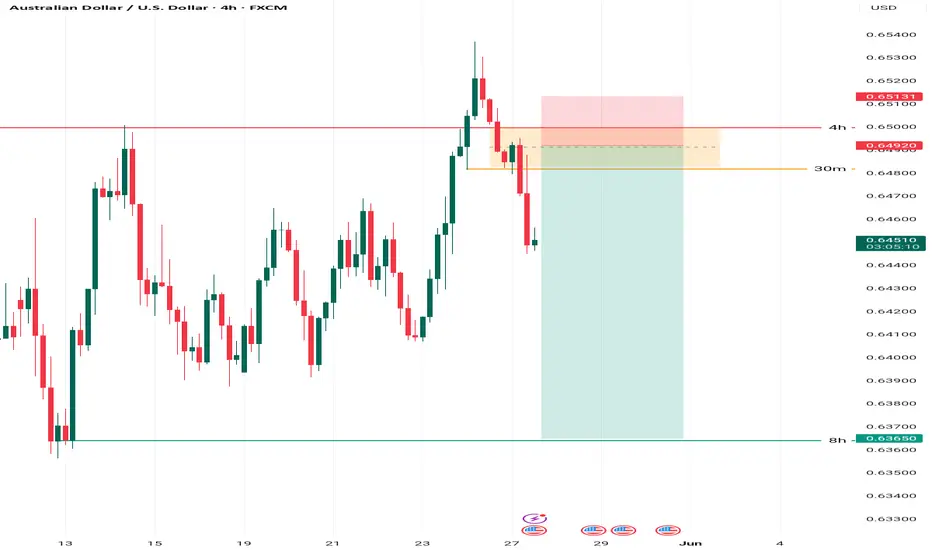
AUDUSD has experienced a failed breakout on the 4-hourConsidering the price's attempt to break the 4-hour resistance and its failure, along with confirmation of a decline on the 30-minute timeframe, we expect the price to drop to the 8-hour low.
The risk-to-reward ratio will be around 1:6. However, please ensure to maintain a 2% risk of your account balance and do not risk more than that. Always take responsibility for your trades.
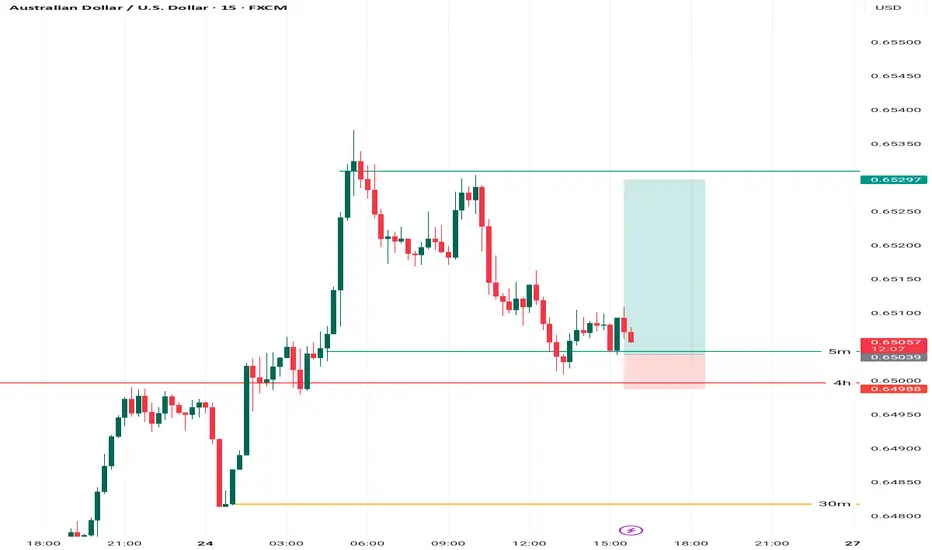
AUDUSD pullback on the m15AUDUSD - with a pullback on the M15 timeframe, and confirmation on the 1-minute timeframe, we expect it to rise to its previous high. This setup offers a very good risk/reward ratio of 1:5.
Please note in the description that you should not risk more than 2% of your account and take full responsibility for your trades."
Aussie H4 | Potential bullish bounceThe Aussie (AUD/USD) is falling towards a pullback support and could potentially bounce off this level to climb higher.
Buy entry is at 0.6464 which is a pullback support.
Stop loss is at 0.6377 which is a level that lies underneath a multi-swing-low support and the 23.6% Fibonacci retracement.
Take profit is at 0.6556 which is a resistance that aligns with the 127.2% Fibonacci extension.
High Risk Investment Warning
Trading Forex/CFDs on margin carries a high level of risk and may not be suitable for all investors. Leverage can work against you.
Stratos Markets Limited (tradu.com ):
CFDs are complex instruments and come with a high risk of losing money rapidly due to leverage. 63% of retail investor accounts lose money when trading CFDs with this provider. You should consider whether you understand how CFDs work and whether you can afford to take the high risk of losing your money.
Stratos Europe Ltd (tradu.com ):
CFDs are complex instruments and come with a high risk of losing money rapidly due to leverage. 63% of retail investor accounts lose money when trading CFDs with this provider. You should consider whether you understand how CFDs work and whether you can afford to take the high risk of losing your money.
Stratos Global LLC (tradu.com ):
Losses can exceed deposits.
Please be advised that the information presented on TradingView is provided to Tradu (‘Company’, ‘we’) by a third-party provider (‘TFA Global Pte Ltd’). Please be reminded that you are solely responsible for the trading decisions on your account. There is a very high degree of risk involved in trading. Any information and/or content is intended entirely for research, educational and informational purposes only and does not constitute investment or consultation advice or investment strategy. The information is not tailored to the investment needs of any specific person and therefore does not involve a consideration of any of the investment objectives, financial situation or needs of any viewer that may receive it. Kindly also note that past performance is not a reliable indicator of future results. Actual results may differ materially from those anticipated in forward-looking or past performance statements. We assume no liability as to the accuracy or completeness of any of the information and/or content provided herein and the Company cannot be held responsible for any omission, mistake nor for any loss or damage including without limitation to any loss of profit which may arise from reliance on any information supplied by TFA Global Pte Ltd.
The speaker(s) is neither an employee, agent nor representative of Tradu and is therefore acting independently. The opinions given are their own, constitute general market commentary, and do not constitute the opinion or advice of Tradu or any form of personal or investment advice. Tradu neither endorses nor guarantees offerings of third-party speakers, nor is Tradu responsible for the content, veracity or opinions of third-party speakers, presenters or participants.

Very Long time Short!Hello all. as you see market was going up because of American Election and Tariffs, but it was just an exciting, it was from no where. then market will go down as sharply as it go up. be happy(wink)

Looking forward to entry confirmation on this setup 📉 AUD/USD Short Setup in Focus
Currently watching AUD/USD as price approaches a key resistance zone. Momentum looks stretched, and I’m looking for confirmation to enter a short position. Waiting for a clear signal before jumping in — patience is part of the plan. 👀✍️ #AUDUSD #ForexSetup #ShortTrade #PriceAction

AUDUSD Is Very Bullish! Long!
Please, check our technical outlook for AUDUSD.
Time Frame: 1h
Current Trend: Bullish
Sentiment: Oversold (based on 7-period RSI)
Forecast: Bullish
The market is approaching a key horizontal level 0.650.
Considering the today's price action, probabilities will be high to see a movement to 0.653.
P.S
The term oversold refers to a condition where an asset has traded lower in price and has the potential for a price bounce.
Overbought refers to market scenarios where the instrument is traded considerably higher than its fair value. Overvaluation is caused by market sentiments when there is positive news.
Disclosure: I am part of Trade Nation's Influencer program and receive a monthly fee for using their TradingView charts in my analysis.
Like and subscribe and comment my ideas if you enjoy them!

AU Bulls Make A Break For Higher Prices! Time To Long??OANDA:AUDUSD has practically been caught in an Ascending Channel for most of this year but that might not be for "Long"!
A few key things to point out:
- Early April delivered a False Breakout where Price reached the Previous 5 Year Low @ .5980 and was immediately sent back up into the Channel! (Liquidity Sweep??)
- Most of the Price Action that's occurred in this range has been contained to the Upper Chamber of the Channel between the Rising Resistance and Linear Regression.
- Price Consolidated tightly into a Pennant Pattern underneath the Rising Resistance for the past few weeks before delivering a Bullish Break just earlier this evening.
If Bulls are able to sustain Price outside the Channel, this could generate potential Long Opportunities on the Retest of the Break of the Ascending Channel!
Once a Breakout is validated and Retest is successful, the Price Target would be the Next Swing High @ .66875 where Bears were able to push Price down last.
Fundamentally, RBA will be releasing CPI y/y numbers on Tuesday, May 27th with analysts forecasting a .1% Decrease in Inflation from 2.4% to 2.3% after last week having made a 25 basis point rate cut from 4.1% to 3.85%.

uptrendThe price is expected to consolidate above the support area and continue the upward trend. A break above the 161.8% level can be a confirmation of the continuation of the upward trend.

🇦🇺 AUDUSD 4H Technical & Fundamental Analysis🇦🇺 AUDUSD 4H Technical & Fundamental Analysis
The Australian dollar continues to show strength, On the 4H chart, AUDUSD has confirmed a bullish market structure. We observed a breakout above the previous major resistance at 0.63500, which now serves as a key support level.
After this breakout, a Change of Character (CHOCH) was confirmed, followed by multiple retests of the 0.63500 level and a clean rally toward the minor resistance at 0.65200.
We’re currently monitoring for accumulation and a possible liquidity sweep below the minor key zone. This is a typical setup for institutions to trigger stop losses before the next move higher.
📊 Trade Setup
📍 Area of Interest (AOI): 0.65290
🛡 Stop-Loss (Risk Perspective): 0.64770 (just below liquidity zone)
🎯 Target Profit (Structure-Based): 0.66900 (next minor resistance zone)
Meanwhile, Australia’s resilience, rising commodity prices, and a hawkish central bank continue to support the AUD’s bullish outlook.
Fundamental Outlook:
Labor Market Strength
Australia’s employment data remains solid, with consistent job gains and low unemployment, reinforcing confidence in the country’s economic stability.
RBA Hawkish Tone
The Reserve Bank of Australia has maintained a firm stance on inflation, leaving the door open for possible rate hikes. This hawkish outlook adds upward pressure on AUD.
Commodity Price Recovery
As a key exporter, Australia benefits from rising prices in gold, iron ore, and copper—particularly driven by China’s demand recovery.
Weakening USD
The U.S. dollar is under pressure due to dovish Fed expectations, fiscal uncertainty, and a rise in speculative short positions, boosting AUD/USD.
(Source: Bloomberg, Reuters)
📌 Disclaimer:
This is not financial advice. Always wait for proper confirmation before executing trades. Manage risk wisely and trade what you see—not what you feel.

AUD/USD H4 AnalysisPrice reached H4 resistance at the close of last weeks trading.
Now it's maybe time to sit out of any new trades until the market shows its hand.
Rejection and sell setup or breakout and buy setup?
Always trade with a profitable strategy and good risk management.

Week of 5/25/25: AU AnalysisBullish previous week leads for my bias being bullish this week as well until price reaches the next Daily supply zone which we will look to trade the pullback.
Thanks for stopping by goodluck this week!
Major news:
PMI - Thursday


AUDUSD TRADE SETUPWait for retest the entry level then take a trade for Buy otherwise skip this setup

AUDUSD - Structure Trading Using Candlestick CluesWHAT I'M LOOKING FOR
Price action has broken out to the upside & is currently holding at a previous level of structure resistance here on the $AUDUSD.
MY PREDICTION
Based on the candlesticks that have been produced at this level I'm predicting a brief period of relief which opens up the opportunity for a bearish counter-trend structure trade. If we do reverse at this level I would predict price to retest the previous (inside) level of structure resistance that should now act as potential support
HOW TO GET INVOLVED
Price has currently put in 2 Doji candles followed by a lower low & a lower close candle. This in itself is a good (and aggressive) reason for entry. The only concern that I have (in my personal trading) is that I am unable to get a quality risk reward.
If you have any questions, comments, or just want to share your views, please do so below!
Akil

AU longs I see price is now showing potential bullish evidence after a strong run down. Now creating HH's and HL's, I see a opportunity to enter after this consolidation on a break or break/retest. Nothing complicated.

AUD-USD Free Signal For Monday! Sell!
Hello,Traders!
AUD-USD keep growing in
An uptrend an we are bullish
Biased mid-term, however
The pair is locally overbought
So after the pair enters the
Resistance area around 0.6510
On Monday we will be able
To go short on the pair
With the Take Profit of 0.6480
And the Stop Loss of 0.6516
Sell!
Comment and subscribe to help us grow!
Check out other forecasts below too!
Disclosure: I am part of Trade Nation's Influencer program and receive a monthly fee for using their TradingView charts in my analysis.
