AUDUSD Bullish Breakout!
HI,Traders !
#AUDUSD is trading in a strong
Uptrend and the price made a
Bullish breakout of the key
Horizontal level of 0.65829
So we are bullish biased
And we will be expecting a
Further bullish move up !
Comment and subscribe to help us grow !
USDAUD trade ideas

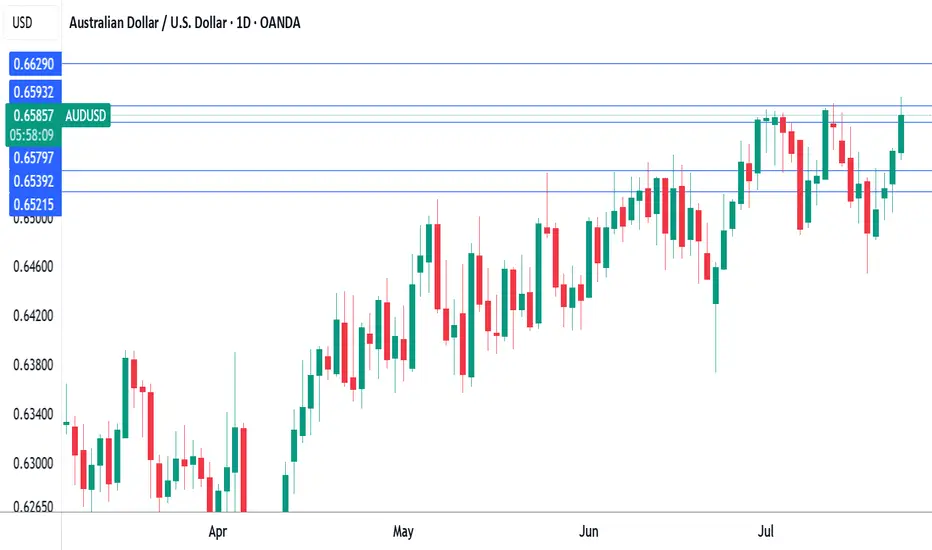
AUD/USD Bulls Eye BreakoutThe Australian Dollar surged more than 1.8% this week with AUD/USD now testing multi-month uptrend resistance at fresh yearly highs. A four-day rally takes price into confluent resistance at the September low / upper parallel at 6622- The focus is on today’s close with the immediate advance vulnerable while below this key slope. Subsequent resistance objectives eyed at the 2019 low at 6671 and the 78.6% retracement of the broader 2024 decline at 6723.
Initial support rests with the July open at 6581 and is backed by the May high-day close (HDC) / weekly open at 6486-6506. Losses would need to be limited to this region for the late-June advance to remain viable (near-term bullish invalidation). Subsequent support seen at the June low-day close (LDC) at 6458 with a break below 6350 ultimately needed to suggest a more significant high is in place / larger reversal is underway.
Bottom line: A breakout of the July opening-range takes AUD/USD into confluent uptrend resistance- risk for topside exhaustion / price inflection here. From a trading standpoint, a good zone to reduce portions of long-exposure / raise protective stops – losses shudl be limited to 6486 IF price is heading higher on this stretch with a close above this slope needed to fuel the next leg of the advance.
Keep in mind the FOMC interest rate decision is on tap next week with Core Personal Consumption Expenditures (PCE) and Non-Farm Payrolls (NFPs) slated into the monthly cross. Stay nimble into the releases and watch the weekly closes here.
-MB

SELL AUDUSD IF DAILY CANDLE ENDS AS BEARISH ON IDC(THIS CHART)sell AUDUSD and buy USDCAD as the dollar is gaining strength
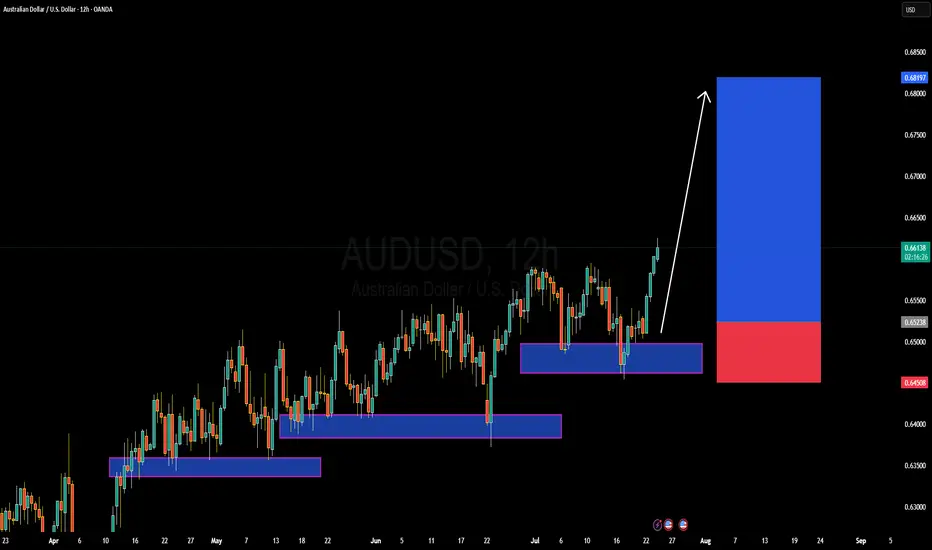
AUDUSD Forming Strong Bullish MomentumAUDUSD is currently showing strong bullish momentum, confirming a key breakout from recent consolidation. After multiple rejections at support zones, price action has now surged through previous resistance levels around 0.6600, signaling a bullish trend continuation. As seen on the 12H chart, the pair is respecting a series of higher lows and forming a clean ascending structure, with a fresh impulse wave now aiming toward the 0.6800–0.6820 target zone.
On the fundamental front, the Australian dollar is gaining strength as recent macro data supports a more optimistic economic outlook. Australia’s labor market remains tight, and inflation prints have come in hotter than expected, increasing speculation that the RBA may maintain a hawkish tone. Meanwhile, the US dollar is under pressure as markets continue to price in a potential Fed rate cut in the coming months, especially amid signs of slowing economic momentum and easing CPI. This divergence is helping AUDUSD push higher.
Technically, buyers are clearly in control. Each dip into demand zones has been aggressively bought, and the current price action confirms continuation. The recent break above 0.6600 is a significant technical development, and as long as price holds above the 0.6520–0.6500 support zone, I expect the pair to grind higher toward 0.6819 and beyond. Risk-reward remains favorable for buyers with a clear bullish structure intact.
With strong bullish confluence both fundamentally and technically, AUDUSD offers a high-probability long opportunity. I’ll be looking for continuation setups on lower timeframes while managing risk below key support. The trend is your friend here—stay with the bulls as the market positions ahead of upcoming US economic releases.
AUDUSDafter trap sellers came in range again on mtf. it show bull strength and a liquidity sweep on seller side. we can see a good movemntum on the upside.
make your own analysis before taking trade.

AUS/USD Long/Buy setting upLooking at AUS/USD for a potential Buy setting up on the Daily and 4 hr.
EMA has lined up in the correct stacking order.
An upward trend can be observed. The 20 has crossed over the 50.
We are starting a new Cycle 1 on the upward so I will wait for the pull back to the 20MA which will form the Cycle 2 then wait for the new Cycle 1 on the upward to start again before I buy in.

AUDUSD Q3 | D24 | W30 | Y25📊AUDUSD Q3 | D24 | W30 | Y25
Daily Forecast🔍📅
Here’s a short diagnosis of the current chart setup 🧠📈
Higher time frame order blocks have been identified — these are our patient points of interest 🎯🧭.
It’s crucial to wait for a confirmed break of structure 🧱✅ before forming a directional bias.
This keeps us disciplined and aligned with what price action is truly telling us.
📈 Risk Management Protocols
🔑 Core principles:
Max 1% risk per trade
Only execute at pre-identified levels
Use alerts, not emotion
Stick to your RR plan — minimum 1:2
🧠 You’re not paid for how many trades you take, you’re paid for how well you manage risk.
🧠 Weekly FRGNT Insight
"Trade what the market gives, not what your ego wants."
Stay mechanical. Stay focused. Let the probabilities work.
FRGNT

AUDUSD Will Go Up From Support! Long!
Here is our detailed technical review for AUDUSD.
Time Frame: 4h
Current Trend: Bullish
Sentiment: Oversold (based on 7-period RSI)
Forecast: Bullish
The market is on a crucial zone of demand 0.661.
The oversold market condition in a combination with key structure gives us a relatively strong bullish signal with goal 0.665 level.
P.S
Please, note that an oversold/overbought condition can last for a long time, and therefore being oversold/overbought doesn't mean a price rally will come soon, or at all.
Disclosure: I am part of Trade Nation's Influencer program and receive a monthly fee for using their TradingView charts in my analysis.
Like and subscribe and comment my ideas if you enjoy them!

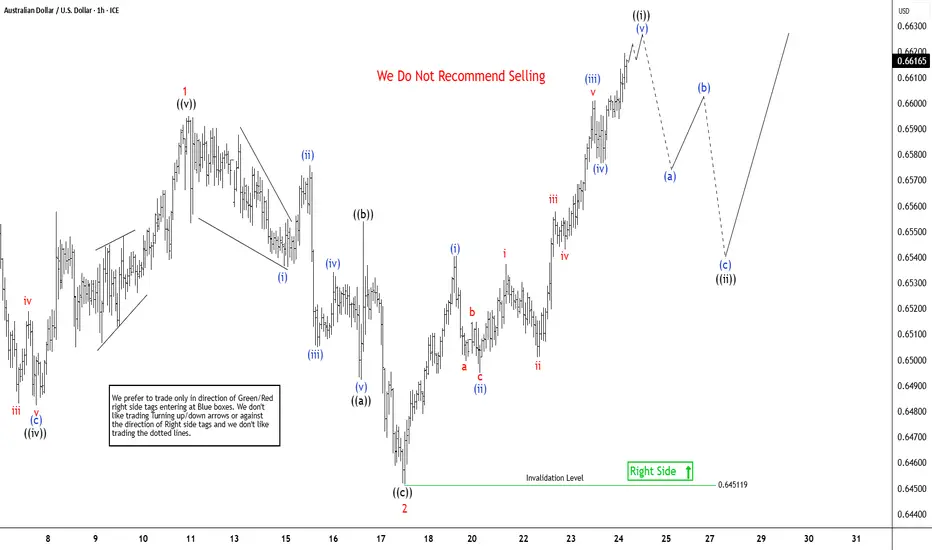
AUDUSD Elliott Wave Outlook: Impulse Pattern Approaching To EndThe AUDUSD pair is showing higher high from 4.09.2025 low, expecting rally to continue from 5.12.2025 low. It favors zigzag corrective bounce from April-2025 low & should continue rally against 0.6451 low. In daily, it started corrective bounce from 4.09.2025 low & may extend towards 0.6720 – 0.6955 area in next few weeks. Above 4.09.2025 low, it ended (A) at 0.6515 high of 5.06.2025, (B) at 0.6354 low of 5.12.2025 & favors upside in (C). Ideally, (C) can extend towards 0.6955 or higher levels, while pullback holds above 5.12.2025 low. Within (C), it placed 1 at 0.6595 high, 2 at 0.6451 low in corrective pullback & favors upside in 3. Within 1, it ended ((i)) at 0.6552 high, ((ii)) at 0.6369 low, ((iii)) at 0.6590 high, ((iv)) at 0.6451 low & ((v)) at 0.6595 high in overlapping diagonal. Below 1 high, it ended 2 in zigzag correction at extreme area before resume rally in 3.
It placed ((a)) of 2 at 0.6492 low in 5 swings, ((b)) at 0.6554 high & ((c)) at 0.6451 low in 5 swings. Wave 2 pullback ended at 0.618 Fibonacci retracement of 1. Within 3, it favors impulse in ((i)) started from 7.17.2025 low. It placed (i) of ((i)) at 0.6540 high, (ii) at 0.6495 low, (iii) at 0.6601 high, (iv) at 0.6576 low & favor upside in (v) targeting in to 0.6606 – 0.6637 area to finish it. It already reached minimum area, but can see more upside above 0.6593 low. Alternatively, the current move even can be (iii) of ((i)) followed by small pullback in (iv) & higher in (v). Later, it expects ((ii)) to correct in 3, 7 or 11 swings against 7.17.2025 low & find support from extreme area to continue rally. Wave 3 should extend in to 0.6692 – 0.6841 area in 5 swings before correcting in 4 of (C). We like to buy the pullback in 3, 7 or 11 swings at extreme area against 7.17.2025 low.

BUY AUDUSD 24.7.2025Confluence order: BUY at H1~M15
Type of order: Limit order
Reason:
- The price breakout H4 (the last top) confirming the uptrend.
- M15~FIBO 0,5-0,618 (same position)
Note:
- Management of money carefully at the price of sub key M15 (0,65944)
Set up entry:
- Entry buy at 0,65823
- SL at 0,65741
- TP1: 0,65944
- TP2: 0,66064
Trading Method: Price action (No indicator, only trend and candles)

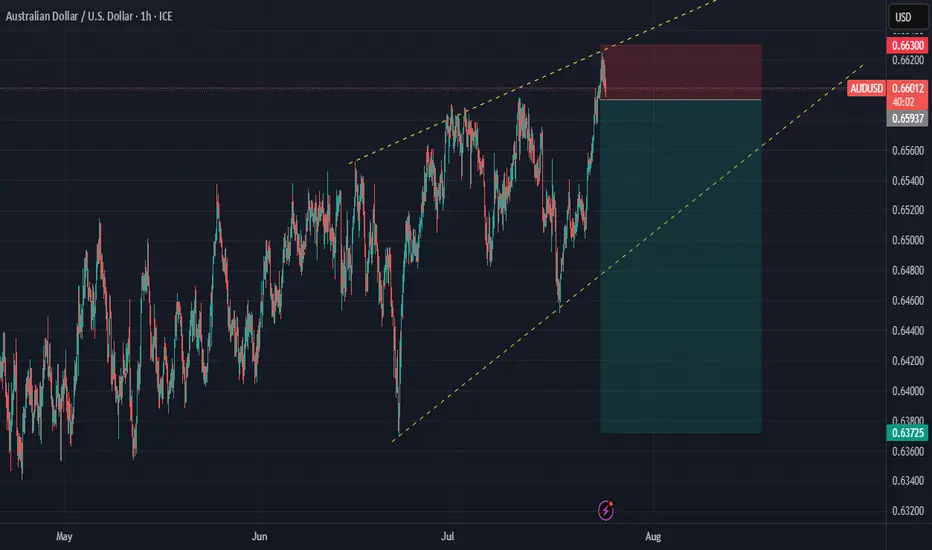
AUDUSD – a rebound from the bottom, ready to break free?After a strong bounce off the ascending trendline, AUDUSD is climbing decisively, clearing out multiple FVG zones on its way toward the key resistance near 0.66300. The bullish structure is intact, and buyers are clearly in control.
News backing the move:
– U.S. S&P Global PMI just came in below expectations, slowing the USD.
– China – Australia’s major trading partner – is signaling fresh stimulus, giving AUD an indirect boost.
If price reaches the 0.66300 zone without strong rejection, this could trigger a breakout that sets the stage for a new rally in August.
Caution: A USD rebound from this week’s data could briefly slow AUDUSD. But for now, the bulls are driving!

AUDUSD(20250724)Today's AnalysisMarket news:
U.S. President Trump continued to lash out at the Federal Reserve on Tuesday, but seemed to back off from the remaining plan to fire Chairman Powell. "I think he's doing a bad job, but he's going to be out of office soon anyway," Trump said in an exchange with reporters at the White House. "In eight months, he'll be out of office."
Technical analysis:
Today's buying and selling boundaries:
0.6580
Support and resistance levels:
0.6639
0.6617
0.6603
0.6558
0.6543
0.6521
Trading strategy:
Upward breakthrough of 0.6603, consider entering the market to buy, the first target price is 0.6617
Downward breakthrough of 0.6580, consider entering the market to sell, the first target price is 0.6558


AUD_USD BULLISH BREAKOUT|LONG|
✅AUD_USD is going up
Now and the pair made a bullish
Breakout of the key horizontal
Level of 0.6590 and the breakout
Is confirmed so we are bullish
Biased and we will be expecting
A further bullish move up
LONG🚀
✅Like and subscribe to never miss a new idea!✅
Disclosure: I am part of Trade Nation's Influencer program and receive a monthly fee for using their TradingView charts in my analysis.

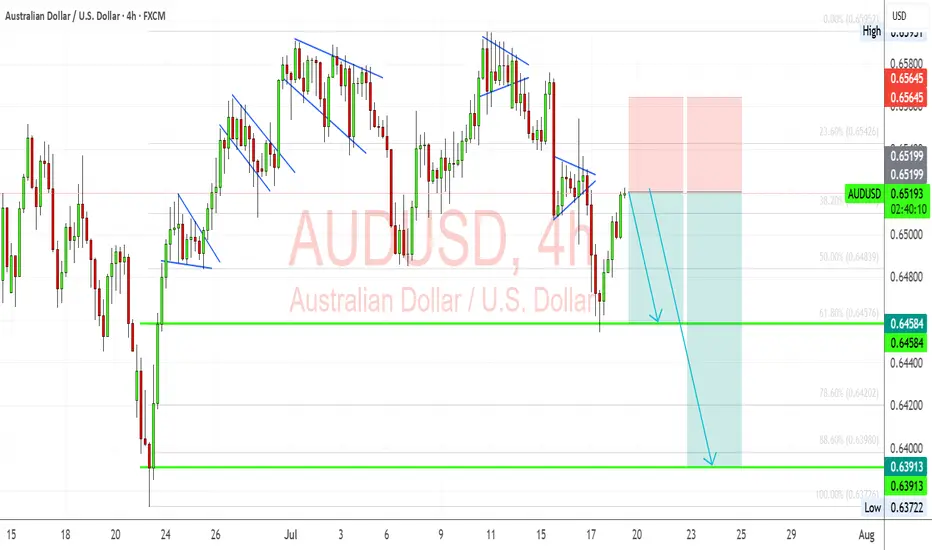
AUDUSD: Bearish Flag Retest Within Macro HeadwindsAUDUSD is developing a clean bearish technical setup just as macro fundamentals increasingly weigh on the Australian dollar. The pair recently completed a rising wedge breakout and is now retesting broken structure within a larger downtrend. With risk sentiment shaky due to U.S. tariff threats and dovish repricing of the RBA’s outlook, Aussie bulls may struggle to sustain momentum. A confirmed breakdown below 0.6458 could open the door toward June’s swing low near 0.6390.
🧠 Technical Breakdown:
✅ Bearish Flag Structure:
The chart shows a sequence of bearish flags and rising wedges, all of which have historically broken lower. The latest breakout to the downside was sharp, and the current rally appears corrective.
✅ Fib Levels & Confluence:
Price is hovering near the 38.2% retracement (0.6510) from the last leg down. The invalidation zone around 0.6565 aligns with a supply zone, making it an ideal SL area.
✅ Target Zones:
First support: 0.6458
Measured move: 0.6390 - 0.6370
These coincide with Fib 61.8% & 100%, adding technical confluence.
📉 Fundamental Drivers:
Dovish RBA Signals: Labour data missed expectations, and June inflation slowed (4.8% vs. 4.9% expected), softening the RBA’s hawkish stance.
Stronger USD Outlook: Powell’s reappointment risk and rate-cut delay pricing have supported the dollar. U.S. data (Retail Sales, CPI) still signal sticky inflation and strong labor.
Tariff Risk from Trump: With the U.S. floating global 10% tariffs, risk assets like AUD (a high-beta currency) face downside pressure.
⚠️ Risks to Bearish Bias:
Stronger-than-expected China stimulus could support AUD as a proxy.
A dovish Fed pivot or soft U.S. data might undercut USD strength.
Sell area audusdStrong sell expected from the marked level
Wait to sweep high and high possible to respect the downtrend channel

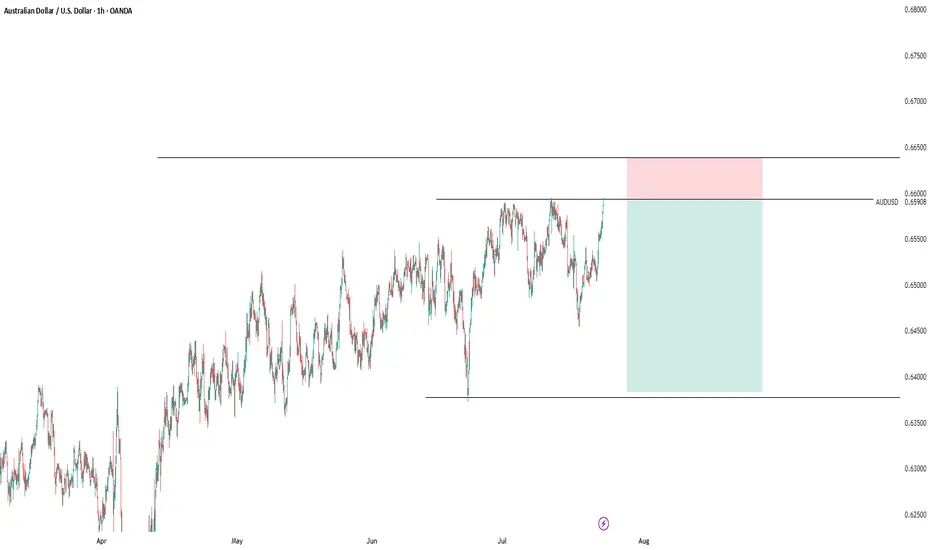
AUDUSDContinuation to the upside on Aussie to Dollar, bias is to pull up to the next resistance zone.watch out for price reaction

Australian dollar hits eight-month high on risk-on moodThe Australian dollar has rallied for a fourth sucessive day. In the North American session, AUD/USD is trading at 0.6588, up 0.50% on the day. The red-hot Aussie has jumped 1.6% since Thursday and hit a daily high of 0.6600 earlier, its highest level since Nov. 2024.
The financial markets are in a risk-on mood today, buoyed by the announcement that the US and Japan have reached a trade agreement. Under the deal, the US will impose 15% tariffs on Japanese products, including automobiles. As well, Japan will invest some $550 billion into the US.
Global stock markets are higher and the Australian dollar, a gauge of risk appetite, has climbed to an eight-month high.
Investors also reacted positively today to reports that negotiations between the US and China were speeding up and the US could grant an extension of the August 12 deadline to reach an agreement. The latest positive developments on the tariff front have raised hopes that the US will also sign trade deals with the European Union and South Korea.
The White House continues to put pressure on the Federal Reserve. Earlier this week, Treasury Scott Bessent called for a thorough review of the Federal Reserve. Bessent echoed President Trump's calls for the Fed to lower interest rates.
Fed Chair Jerome Powell hasn't shown any signs of plans to cut rates and has fired back that the uncertainty over Trump's trade policy has forced the Fed to adopt a wait-and-see policy. The Fed is widely expected to hold rates at the July 30 meeting but there is a 58% likelihood of a rate cut in September, according to CME's FedWatch.
AUD/USD has pushed above resistance at 0.6579 and tested resistance at 0.6593 earlier. Next, there is resistance at 0.6629
0.6539 and 0.6521 are the next support levels
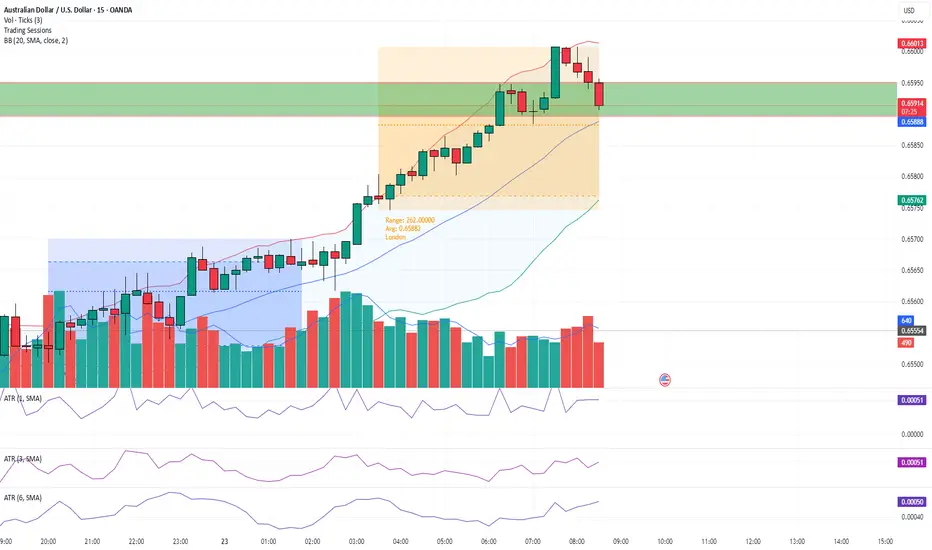
breakout idea1. Day high break
2. retest
3. ATR is increasing
4. price already return to bb
5. Planning to go long.
6. Waiting for confirmation candle
thanks
audusd sell signal. Don't forget about stop-loss.
Write in the comments all your questions and instruments analysis of which you want to see.
Friends, push the like button, write a comment, and share with your mates - that would be the best THANK YOU.
P.S. I personally will open entry if the price will show it according to my strategy.
Always make your analysis before a trade
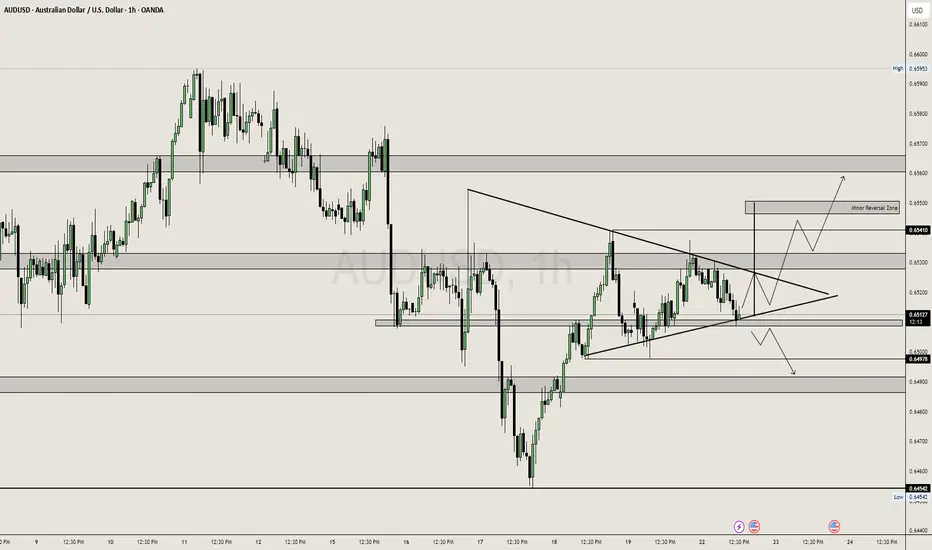
AUDUSD: Symmetrical Triangle
Price is consolidating inside a symmetrical triangle, showing indecision between bulls and bears.
Before entering the triangle, the market showed strong bullish momentum, indicating a possible continuation pattern.
Price is hovering near a key support level (0.6513) where multiple candle wicks suggest buying pressure is defending.
🔍 Key Zones & Levels:
Support (0.6500–0.6510):
Price is reacting strongly here.
A break below this = bearish pressure → could retest lower demand zones.
Resistance (0.6530–0.6541):
Mid-structure resistance.
Clean breakout above this confirms bullish control.
Minor Reversal Zone (0.6555):
If bulls break above triangle, this area may stall price or reverse short term.
Ideal area for TP or trailing SL.
Demand Zone (0.6454):
Strong historical buy zone.
Only likely to hit if triangle breaks down aggressively.
📈 Bullish Scenario:
If price breaks and closes above triangle + 0.6530 zone, expect:
Rally to 0.6541 (first target)
Extension toward 0.6555 where reversal/supply could kick in.
Momentum and volume confirmation needed — no breakout = no trade.
📉 Bearish Scenario:
If price breaks below triangle & 0.6500, expect:
Drop to 0.6490 (minor support)
Further slide toward 0.6454 (major support) if downside accelerates.