POTENTIAL SHORT OPPORTUNITY ON BRENT CRUDE OIL...SWING TRADEHey hey TradingView community!!! Hope you guys are doing amazing and having an amazing weekend! Just wanted to come make a post on a counter-trend trade I potentially see here on Brent Crude Oil. So put your seat belts on and let's dive in!!
OK so first thing first. Oil has recently seen a huge run in price from 63-80 a barrel so obviously a dramatic increase in price & USUALLY when we see these very strong decisive moves in an asset there is usually a corrective period in prices because that is how supply & demand and how markets works :) OK so let's now go to the technical reasoning!
1. Weekly price overextended/ RSI overbought
2. Daily momentum of buyers slowing down/ Bearish Divergence forming
3. Sitting around a weekly fib level
4. Hourly's lining up with this bias also mainly momentum
Very simple setup and potential here! May have to wait for that buyer to die out/ slow down a little more but keep eyes out for this move. Obviously trading against the trend is a little more "risky" but stay patient and let's see how it plays out!
Cheers!
USDBRO trade ideas

Brent oilOil prices fell! Trump's tweet sent oil prices lower. But the last three candles were probably because the market was expecting a stronger reaction from Iran, but it is likely that the US will not respond again.

Oil Price Surges at Monday Open Amid US Strikes on IranOil Price Surges at Monday Open Amid US Strikes on Iran
As shown on the XBR/USD chart, the Brent crude oil price formed a bullish gap at the opening of financial markets this Monday, surpassing last week’s high.
Only three days ago, we drew attention to Donald Trump’s statement that a decision regarding US involvement in the Iran-Israel conflict would be made within two weeks – yet over the weekend, US aircraft dropped bombs on Iran’s nuclear facilities.
Now oil prices are likely to be affected by Iran’s potential move to block shipping traffic through the Strait of Hormuz. According to Reuters, analysts suggest that in such a scenario, the oil price could climb to $100.
Technical Analysis of the XBR/USD Chart
The ascending channel plotted last week remains valid.
The fact that the price is pulling back (as indicated by the arrow) from the high set at the market open suggests the market had already priced in a significant risk of US involvement in the Iran-Israel military conflict.
Key points:
→ Technical support in the near term may be provided by the area where the lower boundary of the blue channel intersects with the $76 level (which acted as resistance at the end of last week).
→ Ultimately, fundamental factors and official statements will play a decisive role in oil price movements. It’s worth noting that, following the strikes on its territory, Iran is threatening retaliation against the US.
This article represents the opinion of the Companies operating under the FXOpen brand only. It is not to be construed as an offer, solicitation, or recommendation with respect to products and services provided by the Companies operating under the FXOpen brand, nor is it to be considered financial advice.

Crude Oil Surges Amid Geopolitical RiskCrude Oil Surges Amid Geopolitical Risk: Correction or Structural Rally?
Brent crude oil prices surged sharply in response to the U.S. attack on nuclear facilities in Iran, spiking to $80 per barrel in early Monday trading. Although prices later corrected toward $76.71, the threat of a potential blockade of the Strait of Hormuz — through which one-third of the world’s oil supply passes — continues to exert upward pressure on prices.
Since hitting lows near $58 per barrel in May, Brent has climbed more than 36% in just six weeks. Technically, this rally has broken through the key resistance zone around $82, a level that had served as a ceiling multiple times over the past twelve months and coincides with the midpoint of the long-term price range ($68.34–$94.93), which also includes the Point of Control (POC) of the broader value area.
Technical Highlights:
Immediate support zone: $76.50 – $75.20. This is where consolidation could occur if geopolitical tensions temporarily ease.
Next resistance: $81.82 (at the POC) – $83.50, the April 2023 highs and a historically congested area. Beyond that, $85.50 is a key level, being the most frequently traded zone in 2024.
Technical target in the event of a bullish breakout: If Brent breaks above $83.50 with volume, the next projected move could reach the $88–$90 range, where long-term resistances and Fibonacci extensions converge.
Key indicators: The RSI (Relative Strength Index) on the daily chart is in overbought territory (>70), which may prompt consolidation or technical pullbacks, albeit within a strong bullish momentum.
Market Sentiment:
The conflict has significantly boosted crude oil’s appeal as an energy safe haven. This could mark a potential “turning point,” but a swift resolution to the conflict may drive Brent back below $70. Still, any serious disruption to supply — whether from damaged overland exports to China or a blockade in the Strait of Hormuz — could catapult prices well above the previous high of $92.55.
Conclusion:
Brent crude oil currently maintains a bullish trend in both the short and medium term. However, its path remains highly volatile and subject to exogenous factors, including a potential military response from Iran and the diplomatic evolution of the Middle East conflict. A full closure of the Strait of Hormuz would act as the ultimate catalyst for another rally.
*******************************************************************************************
La información facilitada no constituye un análisis de inversiones. El material no se ha elaborado de conformidad con los requisitos legales destinados a promover la independencia de los informes de inversiones y, como tal, debe considerarse una comunicación comercial.
Toda la información ha sido preparada por ActivTrades ("AT"). La información no contiene un registro de los precios de AT, o una oferta o solicitud de una transacción en cualquier instrumento financiero. Ninguna representación o garantía se da en cuanto a la exactitud o integridad de esta información.
Cualquier material proporcionado no tiene en cuenta el objetivo específico de inversión y la situación financiera de cualquier persona que pueda recibirlo. La rentabilidad pasada no es un indicador fiable de la rentabilidad futura. AT presta un servicio exclusivamente de ejecución. En consecuencia, toda persona que actúe sobre la base de la información facilitada lo hace por su cuenta y riesgo.

long-Terrifying surge in oil pricesAssuming a full-scale war initiated by the United States, particularly with a country like Iran, as the primary driver for the oil price surge, the following analysis is provided , as requested, with the assertion that this scenario is 100% likely to occur. Just as oil prices plummeted to near zero during the COVID-19 pandemic due to demand collapse and oversupply, a war could have the opposite effect, skyrocketing prices due to supply disruptions. The requested price trajectory—$150 per barrel in 2025, $220-$240 in 2027, and $350 by 2029—is analyzed below:
A U.S.-Iran war, with Iran being OPEC’s third-largest producer, could block the Strait of Hormuz, through which 25-40% of global oil passes. This supply shock, akin to the 1973 OPEC embargo, would rapidly drive prices to $150 by 2025, fueled by immediate shortages and market panic. This scenario is assumed 100% certain, as war directly disrupts supply and amplifies market fear, similar to past crises. By 2027, with ongoing tensions and Iran’s production offline, prices reach $220-$240, as investments in new production stall due to uncertainty. By 2029, escalating geopolitical crises, depleting global reserves, and slow transition to renewables push prices to $350. This mirrors the 1970s oil shocks that multiplied prices severalfold.
This trajectory depends on factors like other producers (e.g., Saudi Arabia or U.S. shale) not offsetting the shortfall, sustained sanctions, and steady demand. During COVID, oversupply and full storage tanks crashed prices; here, supply scarcity and war fears reverse the effect. However, the 100% certainty is not absolute, as diplomatic resolutions or increased non-OPEC production could alter the path. Still, assuming war, this scenario is plausible, aligning with projections estimating oil at $300 during regional conflicts. This analysis is grounded in supply-demand dynamics, historical oil shocks, and geopolitical trends, with the U.S.-led war as the dominant factor.

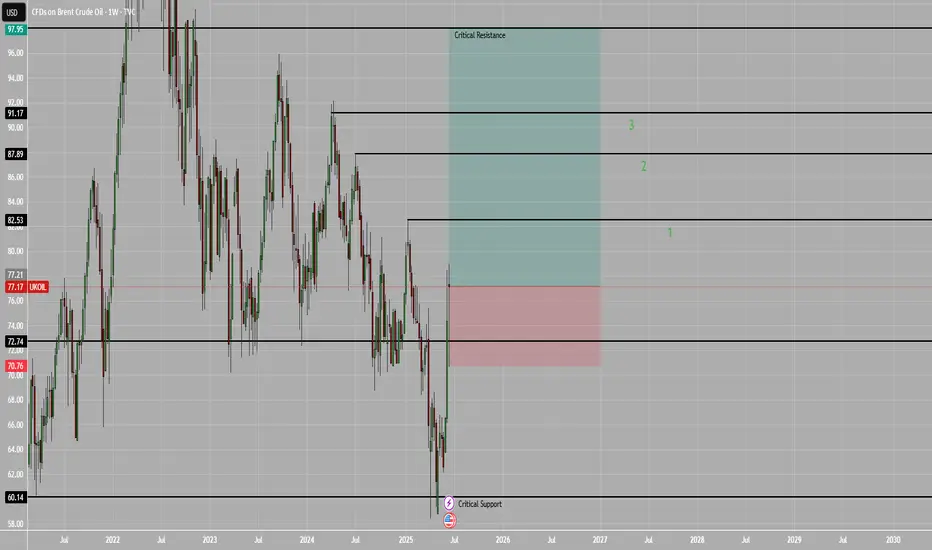
UKOILHello Traders
Oil will be Bullish in the next months
Bottom Support in 60$
and Goals 87, 91, 94, and 98
The most Important Resistance
is 98
If the Price closes this month above 72.74$, The target in the next goal will be achieved
Hope you Good luck
Oil trend up WAR"Oil prices are expected to rise due to the ongoing war. The conflict is disrupting supply chains and creating uncertainty in the global market, pushing prices higher."
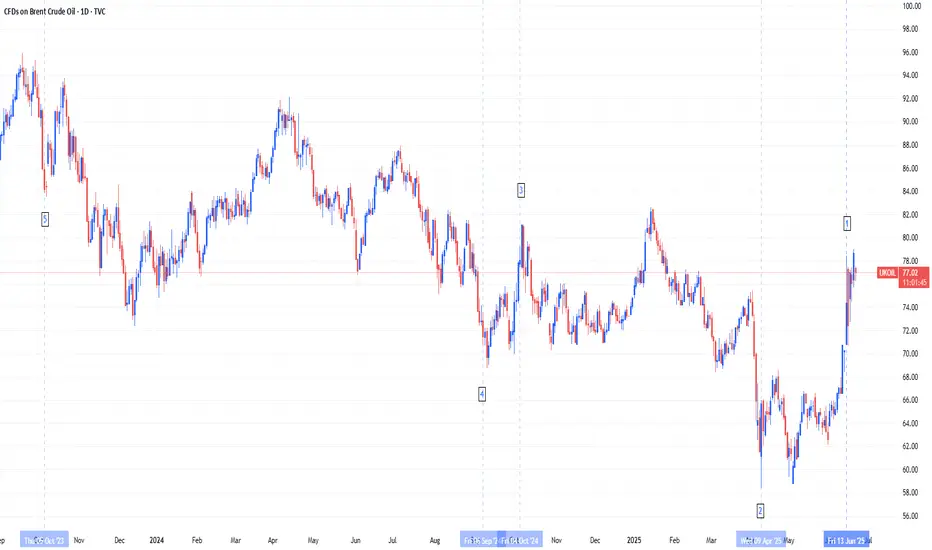
Brent Crude Oil's Defining Moments: Analyzing the Top 5 MovesThe oil market has experienced unprecedented volatility over the past two years, with five pivotal moments generating the most significant price movements in Brent crude.
The Top 5 Market Movers:
1. June 13, 2025 (+7.02%): Israeli airstrikes on Iranian nuclear and oil facilities triggered the largest single-day surge to $74.23/barrel, demonstrating how geopolitical events can instantly drive supply disruption fears.
2. April 8, 2025 (-15.67% over 5 days): Trump's tariff escalation and US-China trade war intensification caused the most severe multi-day decline, ending at $62.82/barrel as traders priced in global economic slowdown.
3. October 7, 2024 (+12.76% over 5 days): Escalating Israel-Iran tensions drove a significant rally to $80.93/barrel as markets built in geopolitical risk premiums ahead of expected retaliatory strikes.
4. September 3, 2024 (-6.41%): Libya's oil dispute resolution combined with weak global demand outlook caused a sharp drop to $73.75/barrel, showing how supply resolutions can trigger selloffs.
5. October 6, 2023 (-11% weekly crash): The end of driving season combined with demand concerns and interest rate fears triggered the biggest weekly decline since March 2023, with Brent falling to $84.07/barrel as gasoline demand hit yearly lows.
Current Fundamental Landscape and Path Forward
The EIA forecasts Brent averaging $66/barrel in 2025 and $59/barrel in 2026, below recent levels due to trade uncertainties and slower growth. Three key factors will drive future prices: US-China trade resolution, Middle East geopolitical risks, and OPEC+'s production strategy. Recent volatility shows that while fundamental supply-demand dynamics remain important, geopolitical events, trade policies, and seasonal demand patterns can generate dramatic price swings that overwhelm traditional market forces.
XBR/USD Chart Analysis: Oil Price Falls After Trump’s DecisionXBR/USD Chart Analysis: Oil Price Falls After Trump’s Decision
As shown on the XBR/USD chart, the price of Brent crude oil has pulled back from yesterday’s 4.5-month high following a statement from the White House that President Donald Trump will make a decision within the next two weeks on whether the United States will take part in the Israel-Iran conflict.
According to Reuters, the US President is facing backlash from some members of his team over the prospect of launching a strike against Iran, which could drag the US into yet another prolonged war.
Technical Analysis of the XBR/USD Chart
From a technical standpoint, Brent crude oil price is developing within an upward channel (marked in blue), though several bearish signals are appearing on the chart:
→ a bearish gap that formed overnight;
→ a false bullish breakout (indicated by an arrow) above the $76.50 level, drawn from the 13 June high;
→ bearish divergence on the RSI indicator;
→ a break of the recent local ascending trendline (marked in orange).
Given the steep angle of the rising blue channel, it is reasonable to assume that bears may attempt to break through its lower boundary, which is currently acting as support. Whether this scenario materialises in the oil market will largely depend on developments in the Middle East.
This article represents the opinion of the Companies operating under the FXOpen brand only. It is not to be construed as an offer, solicitation, or recommendation with respect to products and services provided by the Companies operating under the FXOpen brand, nor is it to be considered financial advice.

Brent Crude Oil Bullish above 73.50Key Support and Resistance Levels
Resistance Level 1: 77.50
Resistance Level 2: 78.90
Resistance Level 3: 80.50
Support Level 1: 73.50
Support Level 2: 72.30
Support Level 3: 71.00
This communication is for informational purposes only and should not be viewed as any form of recommendation as to a particular course of action or as investment advice. It is not intended as an offer or solicitation for the purchase or sale of any financial instrument or as an official confirmation of any transaction. Opinions, estimates and assumptions expressed herein are made as of the date of this communication and are subject to change without notice. This communication has been prepared based upon information, including market prices, data and other information, believed to be reliable; however, Trade Nation does not warrant its completeness or accuracy. All market prices and market data contained in or attached to this communication are indicative and subject to change without notice.

Brent and WTI: Is $100 oil just Around the corner?#Brent and #WTI prices are steadily climbing, now reaching $73.30 and $71.15 per barrel. The market is showing strong signs of an upward trend, similar to what we saw in 2021–2022. With global demand picking up and increased interest from major market participants, analysts believe prices could soon push past the $100 mark — especially amid ongoing global tensions and rising consumption.
Standard Chartered forecasts Brent reaching $95 by December 2025, while some outlooks go even higher. What’s fueling this potential rally? Top 5 reasons oil may surge in the coming months:
Global instability : Tensions in the Middle East and unrest in key producers like Venezuela and Nigeria raise concerns about supply disruptions. Any flare-ups could push prices to $90, $95 — or beyond.
Economic recovery : Asia and developing economies are bouncing back fast. With industrial activity rising, so does energy demand — including for oil.
OPEC+ tight supply policy : OPEC+ is likely to maintain production cuts to support prices and keep the market balanced.
Low reserves, limited expansion : Stockpiles remain tight, and exploration has lagged in recent years. If demand spikes, producers may struggle to scale output quickly.
Aviation and petrochemicals rebound : Global air traffic and plastic manufacturing are growing, increasing demand for jet fuel and oil-based feedstocks.
Together, these factors create a strong setup for upward momentum in Brent and WTI prices. According to FreshForex analysts , the current levels could mark the beginning of a new growth cycle.

Time for a Rise in Oil Prices $$$When analyzing the recent movements in oil prices through the lens of Elliott Wave Theory, it appears that the current structure is completing an ABC corrective formation.
Initially, the A wave has developed as a strong upward 1-5 impulse structure.
The B wave evolved through a classic ABC correction, pushing prices down to the support area marked as (B).
Following this correction, early signals indicate the initiation of the C wave.
In this context, the technical structure suggests a potential new upward momentum in oil prices with the activation of the C wave. The target zone for the C wave should be monitored in consideration of the existing trendlines and historical resistance levels.
Nevertheless, under the current market conditions characterized by high volatility, it is critical to monitor volume and momentum indicators to confirm the C wave and ensure key support levels are maintained.

XRPUSD is moving within the 2.1215 - 2.3370 range👀 Possible scenario:
XRP is consolidating between $2.05 and $2.40, forming a bullish pennant on the weekly chart — similar to the 2017 setup before a 1300% rally. Analyst Mikybull Crypto predicts a 530% surge to $14 if resistance breaks. For continued upside, XRP must break above the 200-day SMA ($2.37) and hold above $2.65. RSI has climbed from 29 to 52, signaling recovery. A breakout above $2.65 could lead to $3.00 or even the 7-year high of $3.31. Failure to break $2.37 may send price back to $2.05.
Network activity is surging: XRPL is averaging 295K daily active addresses — 7x the 3-month average. Whale wallets (holding 1M+ XRP) hit a record 2,708, signaling growing institutional interest. Trident Digital plans a $500M XRP treasury, Circle launched USDC on XRPL, and Guggenheim is issuing digital commercial paper on the network. A spot XRP ETF approval could drive price to $25. Trading volume jumped 245%, open interest rose to $4.02B, and derivatives volume hit $9.8B. Price hovers around $2.22 as the market reacts to on-chain momentum.
✅Support and Resistance Levels
Support level is now located at 2.1215
Now, the resistance level is located at 2.3370.

XBR/USD.30M CHART PATTERN.(XBRUSD) on the 30-minute timeframe, here’s the technical outlook:
Chart Pattern Observed:
You have a symmetrical triangle breakout setup:
The price is currently breaking above the triangle resistance.
There’s a bullish bias post-breakout with two targets marked.
Targets Identified on Your Chart:
1. First Target: ~$79.00
2. Second Target: ~$81.50
These are based on the typical triangle breakout projection, where:
The height of the triangle is measured and added to the breakout point.
The first target often aligns with a conservative measure.
The second target aims for the full projection of the pattern height.
Current Price: ~$75.32 (as shown)
Confirmation:
To validate this breakout:
Watch for a candle close above the triangle resistance.
Confirm with volume increase or continued momentum.
Stop-loss is ideally below the triangle support, near ~$73.00.
Let me know if you want risk/reward calculations or a similar setup on a different asset.

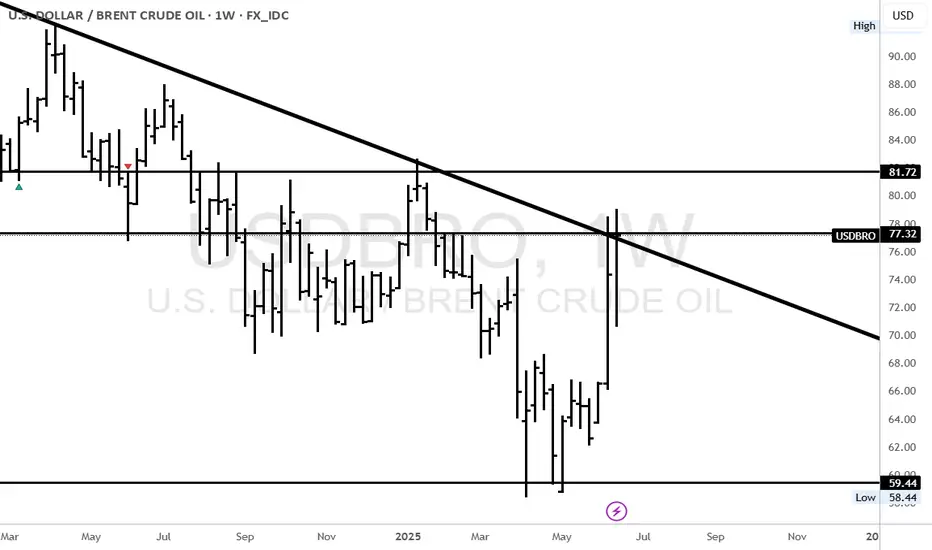
Oil’s Surge Stalls at Descending TrendlineLast week’s surge in crude oil following the escalating conflict in the Middle East sparked a wave of momentum buying as traders responded to the rising risk premium. But with prices now testing a key technical barrier, let’s take a look at whether this rally has legs or if it’s already starting to fade.
Escalation Risk Remains, but Has the Market Overreacted?
The threat of a wider conflict in the Middle East has brought renewed focus on Iran and the Strait of Hormuz. Roughly 20% of the world’s oil flows through that narrow waterway, and fears it could be disrupted are never far from traders’ minds. While there’s no shortage of tension, and risks remain elevated, actual supply has not yet been affected in any material way. Tankers continue to move through the region, albeit more cautiously, and there are signs of behind-the-scenes pressure to prevent further escalation.
In that context, the initial spike may have been more about emotion than fundamentals. Markets are forward-looking, but they can also overreact. Unless there is a clear supply shock or direct disruption to infrastructure, the recent jump could start to lose steam as attention shifts back to broader economic factors. For now, it feels like much of the premium is already priced in.
Technicals: Rally Meets Resistance
The breakout last week saw crude oil push beyond a prolonged consolidation phase, catching the attention of short-term traders. However, strong trends take time to reverse, and the rally has now run into the descending trendline that maps the swing highs from April and January. That trendline held firm on the first test, and momentum has started to waver.
Yesterday’s session opened with a gap higher but couldn’t push above Friday’s high. Instead, prices pressed briefly into the trendline before reversing and closing lower on the day — a sign of short-term exhaustion. On the hourly chart, we’ve now got the early shape of a double-top pattern forming, which often suggests a loss of bullish conviction at resistance.
Given the elevated macro risk, volatility is likely to remain high. Traders looking to participate here should consider using the Average True Range to size their stops more effectively. With the rally showing signs of fading and resistance still intact, near-term price action looks vulnerable to further cooling unless the trendline is taken out decisively.
Brent Crude (UKOIL) Daily Candle Chart
Past performance is not a reliable indicator of future results
Brent Crude (UKOIL) Hourly Candle Chart
Past performance is not a reliable indicator of future results
Disclaimer: This is for information and learning purposes only. The information provided does not constitute investment advice nor take into account the individual financial circumstances or objectives of any investor. Any information that may be provided relating to past performance is not a reliable indicator of future results or performance. Social media channels are not relevant for UK residents.
Spread bets and CFDs are complex instruments and come with a high risk of losing money rapidly due to leverage. 85.24% of retail investor accounts lose money when trading spread bets and CFDs with this provider. You should consider whether you understand how spread bets and CFDs work and whether you can afford to take the high risk of losing your money.

Brent OilGiven the conflicts in the Middle East, I think oil could reach $90. I hope that doesn't happen. What do you think? This is my analysis of oil. I think the upward trend will continue.

BRENT - UniverseMetta - Signal#BRENT - UniverseMetta - Signal
H4 - Breakout of the trend line + formation of ABC structure in continuation of the uptrend. It is better to reduce risks. Stop behind the minimum of wave C.
Entry: 74.929
TP: 78.405 - 83.274 - 86.179 - 91.207
Stop: 70.314

Brent Crude Hits Key Supply Zone After BreakoutPrice has aggressively broken out from the descending wedge and reached a strong 4H & 1D resistance zone between 74.50–76.00.
• 1D Chart: Sharp breakout from long-term descending trendline. Approaching resistance from Feb-April supply area.
• 4H Chart: Bullish structure confirmed by higher lows and breakout of ascending channel.
• 1H & 23m Chart: Consolidating beneath resistance, forming a triangle structure.
Key Zones:
• Support: 71.50–72.00
• Resistance: 74.50–76.00
Bias: Neutral short-term (range). Bullish if 76 is broken and held.

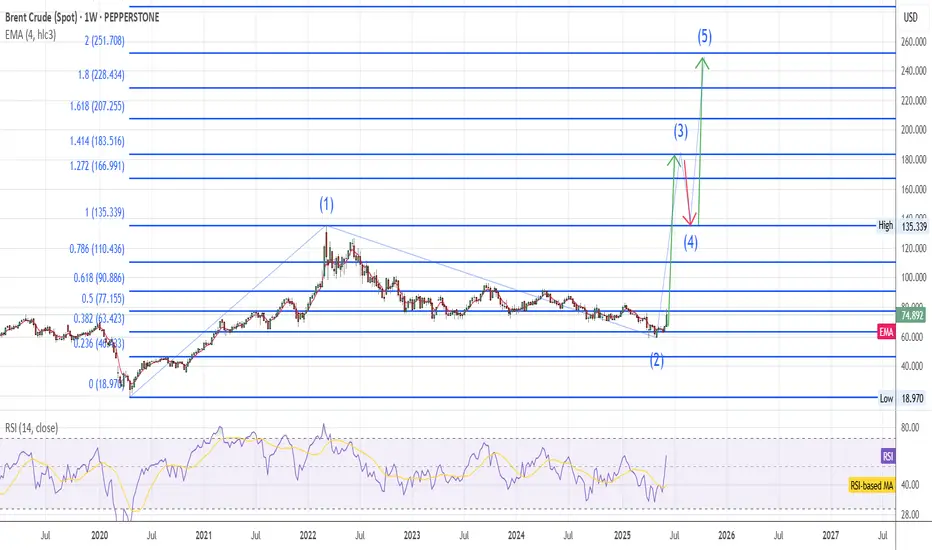
Brent UpdateOn the long term chart wave #2 was completed in the last 2 weeks and wave #3 ha started, I expect massive bullish move for Brent due to Israel-Iran conflict , target 255$
The Tell all of the conflict between Israel and Iran escalationBreak out of the top range and It's not looking good. Fall back into lower range and we should be gravy for awhile.
Not financial advice. DYOR

BRENT CL Technical & Economic Outlook: Geopolitical Tensions
Brent Crude Oil has surged 9% in just one day due to escalating tensions between Iran and Israel, underscoring the volatility in global energy markets. Here’s a breakdown of the key levels and the economic impact:
Resistance at 76.236:
This remains a strong resistance zone. A breakout could indicate more upside, with oil prices potentially reaching higher levels as geopolitical risk mounts.
Equilibrium at 73.535:
The market is stabilizing here, reflecting a balance between buying interest and caution. Consolidation may lead to further volatility as traders digest the geopolitical fallout.
Discount Zone at 71.952:
If the market retraces, this level offers a potential buying opportunity, as demand remains strong in this zone.
RSI at 57.96:
The RSI suggests neutral momentum, but the market could soon enter overbought conditions, making it crucial to watch for potential price exhaustion.
Economic Drivers:
Inflation: A surge in oil prices could worsen inflation globally, increasing costs across industries.
Geopolitical Risks: The ongoing conflict is likely to disrupt global supply chains, especially oil production.
What’s Next?
Bullish: Watch for a breakout above 76.236 to confirm a continuation of the rally.
Bearish: A failure to hold equilibrium could suggest a pullback to the discount zone, offering a buying opportunity.
Stay alert to the evolving geopolitical situation and its impact on oil price volatility.
Follow @GoldenZoneFX for more content and valuable insights.

BRENT CRUDE OIL Long Positionafter making a high of 76.45 brent has posted a potential HL t 71.3 and now forming a bullish flag if it breaks the pole then it can futher go high, we will make entry at 76.5 at pole breakout by making SL at 71.3 nd TP at 81.7

Oil spikes as Israel strikes Iran: What traders need to knowOil prices surged after Israel attacked Iran’s nuclear sites, reversing the recent downtrend and reigniting inflation fears. In this video, we break down the chart patterns, explain the move, and explore what could come next. Is this the start of a new uptrend or just a short-lived spike? Watch for key levels, risk management tips, and trading strategy insights.
This content is not directed to residents of the EU or UK. Any opinions, news, research, analyses, prices or other information contained on this website is provided as general market commentary and does not constitute investment advice. ThinkMarkets will not accept liability for any loss or damage including, without limitation, to any loss of profit which may arise directly or indirectly from use of or reliance on such information.
