USDCAD I Weekly CLS I Model 1I Target 3M CLS LowHey, Market Warriors, here is another outlook on this instrument
If you’ve been following me, you already know every setup you see is built around a CLS Footprint, a Key Level, Liquidity and a specific execution model.
If you haven't followed me yet, start now.
My trading system is completely mechanical — designed to remove emotions, opinions, and impulsive decisions. No messy diagonal lines. No random drawings. Just clarity, structure, and execution.
🧩 What is CLS?
CLS is real smart money — the combined power of major investment banks and central banks moving over 6.5 trillion dollars a day. Understanding their operations is key to markets.
✅ Understanding the behavior of CLS allows you to position yourself with the giants during the market manipulations — leading to buying lows and selling highs - cleaner entries, clearer exits, and consistent profits.
📍 Model 1
is right after the manipulation of the CLS candle when CIOD occurs, and we are targeting 50% of the CLS range. H4 CLS ranges supported by HTF go straight to the opposing range.
"Adapt what is useful, reject what is useless, and add what is specifically your own."
— David Perk aka Dave FX Hunter ⚔️
👍 Hit like if you find this analysis helpful, and don't hesitate to comment with your opinions, charts or any questions.
USDCAD trade ideas

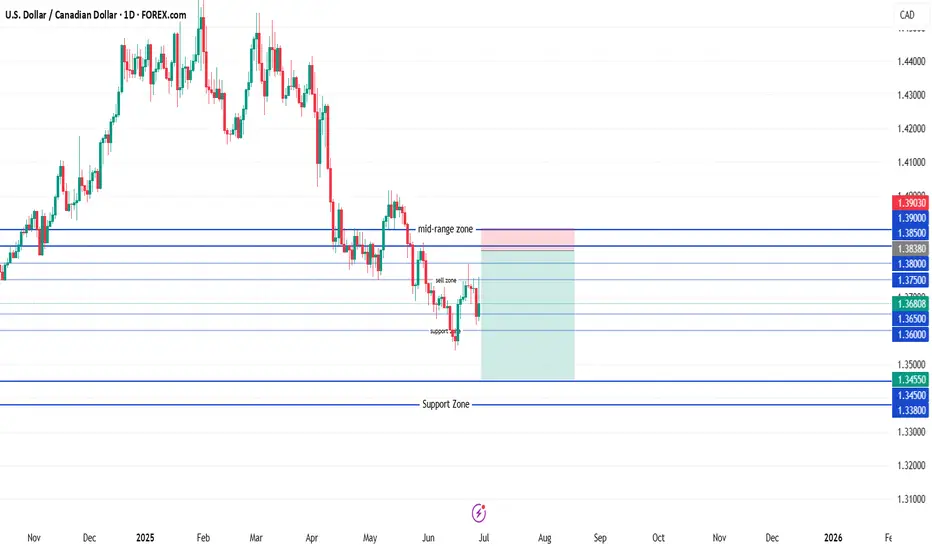
USDCAD Bearish Reversal Trade Setup – 3H Chart Analysis (June 26 Entry Zone: 1.37279 – 1.37554
🔹 Stop Loss: 1.37934
🔹 Target: 1.35278
🔹 Risk-to-Reward (RR): ~1:2.5
🧠 Technical Breakdown
Trend Overview:
Overall trend shows a downtrend from earlier June, followed by a corrective bullish move.
Price failed to sustain above the 200 EMA (blue line), indicating continued bearish pressure.
Trade Line Break:
A steep bullish trendline was broken, signaling a potential trend reversal or deeper pullback.
Bearish Rejection Zone:
The purple zone (1.37279 – 1.37554) acted as resistance.
Price formed a lower high and rejected this zone, confirming selling interest.
Entry Strategy:
Short entry is ideally within or just below the rejection zone.
Aggressive entry already in play at current market price (1.36909) after confirmation.
Target Zone:
Projected towards 1.35278, aligning with previous support and fib retracement zone.
Large purple support zone near the target suggests a potential reversal area.
⚠️ Risk Notes
Be cautious of USD volatility due to upcoming economic events (noted with icons on the chart).
Stop loss above previous swing high minimizes risk of fakeouts.
✅ Summary:
This is a bearish swing setup aiming for a significant drop toward 1.35278. The clean rejection from resistance and trendline break supports a high-probability short opportunity with favorable risk-reward.

USD /CAD) bearish reversal analysis Read The captionSMC trading point update
Technical analysis of USD/CAD pair on the 2-hour timeframe, suggesting that the price is likely to drop toward the support zone. Here's the detailed idea behind the analysis:
---
Chart Breakdown (2H – USD/CAD)
1. Resistance Zone (Yellow Box - Top):
Marked as a strong supply area where price has repeatedly been rejected (highlighted by red arrows).
Acts as a key zone where sellers are in control.
Also aligns with a descending trendline, reinforcing bearish pressure.
2. Support Zone (Yellow Box - Bottom):
This is the target point marked at 1.35387, which previously served as a demand zone.
The chart suggests this level as the next significant area where price might find buyers.
3. Trend Context:
Price is moving within a descending channel (black trendlines), confirming the overall downtrend.
The 200 EMA (1.36834) is acting as dynamic resistance, keeping price under pressure.
4. Projected Move (Blue Box):
Shows a potential drop of ~91 pips toward the support level.
A bearish wave is anticipated as per the black zigzag line on the chart.
5. RSI Indicator:
RSI is near neutral (49.02 and 49.70) — suggesting no overbought/oversold conditions, but confirming lack of bullish momentum.
RSI is aligned with price trending down.
Mr SMC Trading point
---
Summary:
Bias: Bearish
Entry Zone: Near current price or minor pullback (1.364–1.365)
Target: 1.35387 (support zone)
Invalidation: Break and close above resistance level / 200 EMA (~1.3685)
Trend: Downtrend within channel
---
Please support boost 🚀 analysis)

USDCAD: Very Bearish PatternThe USDCAD has created a head and shoulders pattern at a significant intraday horizontal resistance.
A bearish breakout from this neckline indicates strong selling pressure, suggesting that the pair is likely to continue declining, potentially reaching at least the 1.3600 level.

USDCAD: Price Approaching Buying Zone, Will DXY Bounce Back? The USDCAD pair has dropped significantly in recent times, particularly as the DXY index has plummeted. The extremely bearish nature of the DXY suggests that the price of USDCAD is melting. Both fundamental and technical indicators indicate a potential bullish price reversal for this pair, which could potentially hit our first take-profit area. This is a swing analysis, so please give time for the trade to get activated and for it to work out in our favour.
Please note that this analysis does not guarantee that the price will move as suggested. Before trading, it’s essential to conduct your own research.
If you’d like to assist us, we encourage you to consider the following actions:
- Like our ideas
- Provide comments on our ideas
- Share our ideas
Kind regards,
Team Setupsfx_
Much love ❤️🚀

Weekly Forecast Based on Simplified Wave Analysis for USD/CADThe downward wave that formed on the USD/CAD chart tis year has been followed by a corrective move since late May. The pair is largely confined to a sideways price channel. The current wave structure remains incomplete, lacking final segment.
Forecast:
The pair may decline further in the coming days, reaching the support zone. A reversal and upward movement from support may follow. The resistance zone reflects the upper boundary of the pair's expected weekly volatility.
Potential Reversal Zones
Resistance: 1.3800/ 1.3850
Support: 1.3640/ 1.3590
Recommendations:
Selling: Possible intraday in small volumes, not beyond the support zone.
Buying: Consider only after confirmed reversal signals appear near support.
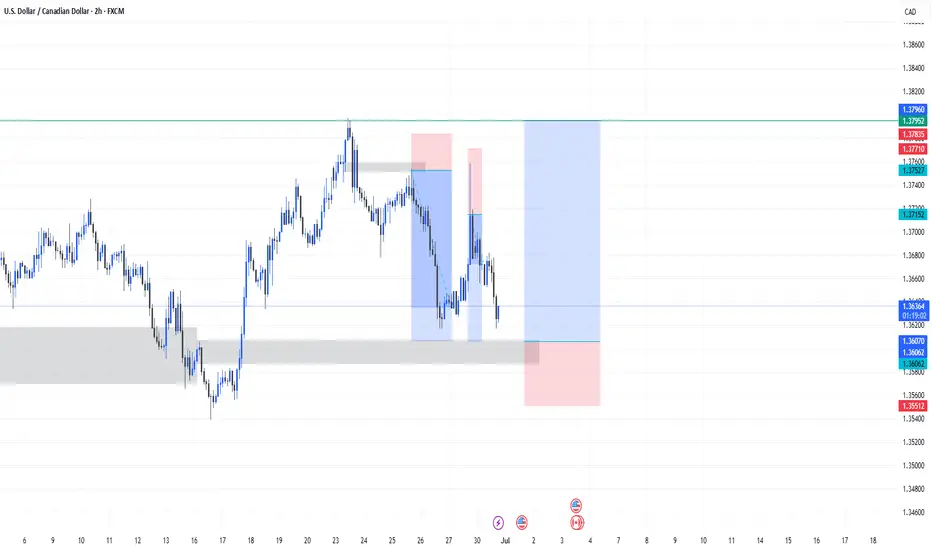
USDCAD long trade setup for this week📈 USDCAD Long Setup Idea – Weekly Play 💯
Here’s a clean bullish setup on USDCAD (2H timeframe) I’m eyeing for this week:
🔹 Key Zones:
- Demand Zone: Strong reaction from the 1.35500–1.36000 area, with price respecting this grey support block multiple times.
- Supply Flip: Previous structure zone turned potential demand.
🔹 Entry:
- Long position placed after liquidity grab and bullish rejection within the demand zone.
- Market structure is beginning to shift bullish after consecutive lower highs and lows broke.
🔹 Risk Management:
- SL below the demand zone at ~1.35512
- TP set near previous high around 1.37960 (resistance zone)
🔹 RRR (Risk to Reward Ratio):
- Solid risk/reward potential on this play – targeting a 3R move if momentum holds.
🔹 Trade Bias:
- Looking for a deeper retracement continuation up, aligning with possible DXY pullback.
- Watching for confirmations like bullish engulfing or structure break for entry trigger.
📊 Stay patient, follow price action, and manage risk properly.
USDCAD 4-hour chart
USDCAD is consistently trading within a clearly defined descending price channel, indicating a prevailing downtrend.
Price action is characterized by a series of lower highs and lower lows, respecting both the upper and lower boundaries of this channel.
The pair has recently encountered resistance near the upper channel boundary, leading to a turn lower.
Based on the established channel, the current price trajectory suggests a potential move towards the lower boundary of the descending channel.
Disclaimer:
The information provided in this chart is for educational and informational purposes only and should not be considered as investment advice. Trading and investing involve substantial risk and are not suitable for every investor. You should carefully consider your financial situation and consult with a financial advisor before making any investment decisions. The creator of this chart does not guarantee any specific outcome or profit and is not responsible for any losses incurred as a result of using this information. Past performance is not indicative of future results. Use this information at your own risk. This chart has been created for my own improvement in Trading and Investment Analysis. Please do your own analysis before any investments.


USDCAD Strongest long-term Sell in the market right now.At the beginning of the year (January 15, see chart below), we made an unpopular bearish call at the time, hinting that the USDCAD pair was approaching its Resistance Zone, hence a multi-year Top was in order:
As you can see, the moment the price hit that Resistance Zone, it got instantly rejected and a new Bearish Leg started, which has extended up to this day. This time we view this on the 1M time-frame where the Support levels are more clearly illustrated.
More particularly, the 1M MA50 (blue trend-line) poses as the first one, in fact it has been holding since September 2022. Our Target is still located at 1.26000, which is marginally above the 0236 Fibonacci level, which has been the 1st Target during both previous Bearish Legs. Also it is where the 1M MA200 (orange trend-line) is headed to, and there are high chances of a long-term bounce there.
-------------------------------------------------------------------------------
** Please LIKE 👍, FOLLOW ✅, SHARE 🙌 and COMMENT ✍ if you enjoy this idea! Also share your ideas and charts in the comments section below! This is best way to keep it relevant, support us, keep the content here free and allow the idea to reach as many people as possible. **
-------------------------------------------------------------------------------
Disclosure: I am part of Trade Nation's Influencer program and receive a monthly fee for using their TradingView charts in my analysis.
💸💸💸💸💸💸
👇 👇 👇 👇 👇 👇

USD/CAD💰Symbol: { USD/CAD }
🟩Price: { 1.36868 }
🟥Stop: { 1.37236 }
1️⃣profit: { 1.36594 }
2️⃣profit: { 1.36183 }
3️⃣profit: { 1.35893 }
4️⃣profit: { 1.35562 }
📊Check your chart before entering.
🚨Check before use to make sure there is no important news.🚨

USDCAD: Oil Price Weakness Weighs on CAD – Can USD Capitalize?USDCAD: Oil Price Weakness Weighs on CAD – Can USD Capitalize?
Hello TradingView community!
Today, let's analyze the USDCAD pair, which is showing interesting dynamics as the CAD faces pressure from falling oil prices.
🌍 Macro Drivers: CAD Struggles Amidst Lower Oil, USD Upside Limited
The USDCAD pair is caught in a tug-of-war between the Canadian Dollar (CAD) and the US Dollar (USD):
CAD pressured by oil: The Canadian Dollar has seen its gains trimmed, primarily weighed down by lower crude oil prices. Canada, being a major oil exporter, sees its currency directly impacted by these fluctuations.
Oil prices lower: A recent truce between Israel and Iran is keeping crude oil prices significantly lower (16% below Monday's highs), directly affecting CAD's strength.
USD's limited upside: Despite CAD's weakness, the US Dollar's upside attempts are being constrained by recent soft US economic data and persistent hopes for Federal Reserve (Fed) monetary policy easing.
In summary, USDCAD is seeing a slight upward tick due to a weaker CAD from oil price drops, but the USD's rally is somewhat capped by Fed easing expectations.
📊 Technical Analysis & USDCAD Trading Plan
Based on the USDCAD chart (H4/M30) provided:
Overall Trend: USDCAD is trading within an ascending channel, but shows signs of weakness near the channel's upper boundary. Price appears to be forming a lower high after a previous upward move.
Key Price Levels:
Potential SELL Zone (Resistance): Clearly identified around 1.36989. This is a strong resistance level, coinciding with recent local highs. Selling pressure is likely to emerge here.
Key Support (Potential BUY Zone): Around 1.36734 and further down at 1.36431. The 1.36431 level is particularly significant, aligning with a major Fibonacci level (1.382) and acting as a robust demand area from prior price action.
Moving Averages (EMAs): Price is trading near the EMAs (black, orange, red), indicating a consolidation phase and potential for a significant move.
Projected Price Action: The chart suggests that USDCAD could pull back from the current resistance zone (1.36989) towards the support levels below, particularly 1.36431, before potentially finding buying interest to resume an upward trend.
🎯 USDCAD Trading Plan:
SELL ZONE: 1.36989
SL: 1.37050
TP: 1.36900 - 1.36850 - 1.36800 - 1.36750 - 1.36700 - 1.36600 - 1.36500 - 1.36431
BUY ZONE: 1.36431
SL: 1.36300
TP: 1.36500 - 1.36550 - 1.36600 - 1.36650 - 1.36700 - 1.36750 - 1.36800 - 1.36900
⚠️ Key Factors to Monitor:
Crude Oil Prices: Any significant movements in crude oil will directly impact the CAD.
US Economic Data: Upcoming reports on inflation and employment from the US could heavily influence Fed policy expectations and USD strength.
Bank of Canada (BoC) Policy: Statements or decisions from the BoC will also be a critical factor affecting the CAD.
Trade smart and stay vigilant! Wishing everyone a successful USDCAD trading day!

USD/CAD ShortSell-limit order: 1.3838
Stop-loss: 1.3903
Target 1: 1.3705
Target 2: 1.3605
Target 3 (optional runner): 1.3455
Place the limit at 1.3838 and keep the stop above 1.3900; scale out at the listed targets as price moves in your favor.
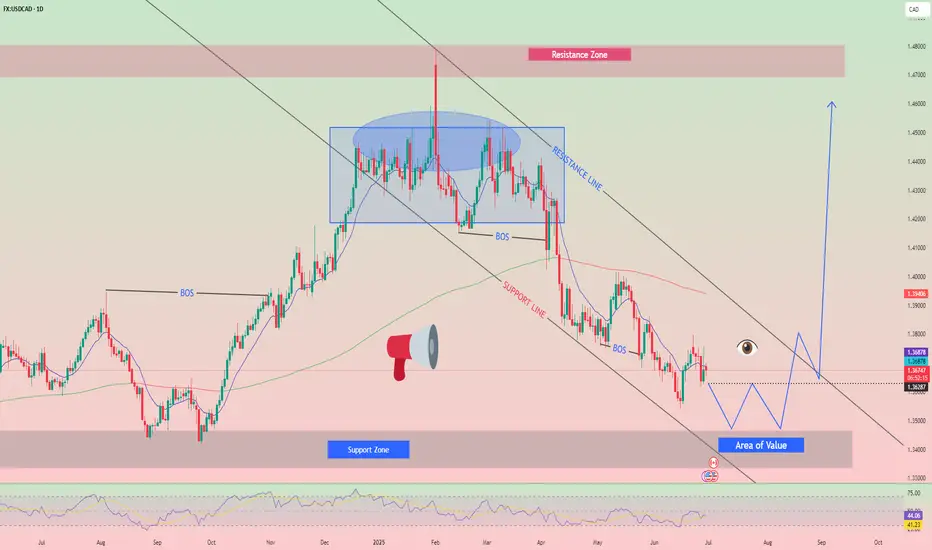
USD/CAD Forms Bullish Trend Structure – Key Levels to WatchUSD/CAD Forms Bullish Trend Structure – Key Levels to Watch
The USD/CAD pair has recently shown signs of a bullish trend formation, indicating a potential continuation of upward momentum in the coming trading sessions. The formation of a higher high on the 4-hour timeframe confirms a shift in market sentiment, suggesting that buyers are gaining control. This bullish structure signals that the pair may extend its gains, with key resistance and support levels guiding future price action.
Bullish Confirmation: Higher High Formation
A higher high is a classic technical indicator of an uptrend, reflecting increasing demand for the US dollar against the Canadian dollar. The recent price action confirms that bulls are dominating the market, increasing the likelihood of further upside movement. Traders should remain alert, as the prevailing trend suggests that any pullbacks may present buying opportunities unless a strong reversal pattern emerges.
Upside Targets: 1.38600 and 1.40100
If the bullish momentum continues, the USD/CAD pair could test the immediate resistance level at 1.38600. A decisive breakout above this level may accelerate the rally toward the next key target at 1.40100. These levels will act as critical zones where sellers might attempt to step in, but if buying pressure remains strong, the pair could extend its upward trajectory. Traders should watch for bullish continuation patterns near these resistance levels for potential breakout opportunities.
Support Level: 1.35300 as Key Floor
On the downside, 1.35300 serves as a crucial support level. Any corrective decline toward this zone could attract fresh buying interest, reinforcing the bullish outlook. A sustained break below this support would be necessary to invalidate the current uptrend, potentially shifting market sentiment in favor of the bears. Until then, traders may consider buying on dips near this support level.
Market Outlook: Bullish Bias Prevails
Given the recent price structure, the USD/CAD pair is expected to remain under buying pressure in the near term. Economic factors, including shifts in oil prices (which heavily influence the Canadian dollar) and Federal Reserve policy expectations, could further impact the pair’s movement. Traders should also monitor upcoming economic data releases, such as US inflation figures and Canadian employment reports, for additional market direction clues.
Conclusion
In summary, the USD/CAD pair has established a bullish trend, with higher highs reinforcing the upward bias. The immediate targets to watch are 1.38600 and 1.40100, while 1.35300 remains a critical support level. Unless there is a strong bearish reversal signal, the path of least resistance appears to be upward, making short-term bullish strategies favorable. As always, proper risk management and close monitoring of price action around key levels will be essential for navigating this market.

USDCAD H4 IdeaPotential for a bullish pullback on the USDCAD H4 which could lead to a price movement towards the resistance level at 1.13800. BUY levels from 1.13600

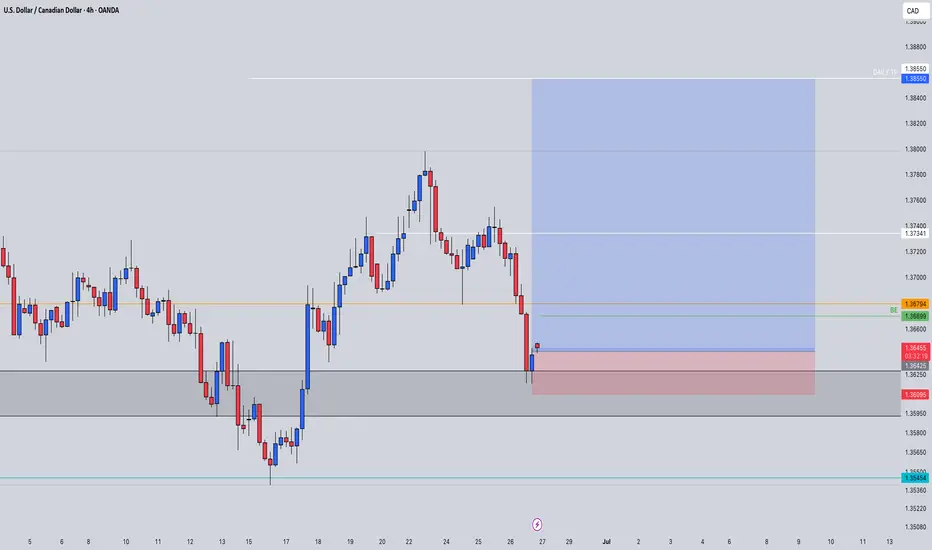
USDCAD Bearish Continuation Setup📉 USDCAD Bearish Continuation Setup
🗓 Published: June 26, 2025
🕒 Timeframes: 4H & 1D
📍 Instrument: USD/CAD
📊 Technical Bias: Bearish
🧠 Analysis Summary
USDCAD has recently rejected from the 1.3713–1.3700 resistance zone (highlighted in red/pink box) after a corrective bullish move. This area served as a strong supply zone where price was previously rejected.
The price is now forming a clear lower high, and the recent failure to break above 1.3713 confirms short-term bearish control. The structure on both the 4H and Daily charts supports a continuation move lower, aligning with a potential bearish swing leg developing.
📍 Key Levels
Level Description
1.3713 Major resistance (top of supply zone)
1.3700 Round number & resistance confirmation
1.3687 Minor S/R flip
1.3666 Short-term support
1.3657 Next target support
1.3617 Key swing low
1.3562 Final target (major support zone)
🔁 Trade Setup
Entry Zone:
🔴 Enter on a 15M/1H retracement to 1.3700–1.3713 (ideal R:R)
🔄 or market sell confirmation below 1.3686
Take Profit Targets:
✅ TP1: 1.3657
✅ TP2: 1.3617
✅ TP3: 1.3562
Stop Loss:
❌ SL above 1.3730
📦 Confluence Factors
Daily & 4H trend turning bearish
Bearish engulfing rejection at previous supply
Lower high structure building up
No major demand zone until 1.356x
⚠️ Risk Note
Wait for confirmation before entering, especially on lower timeframes (1H/15M), such as bearish engulfing candles or break–retest of 1.3686 level. Avoid trading if price breaks above 1.3730 – structure would be invalidated.
💬 Let me know in the comments how you’re trading USDCAD today, and don’t forget to set alerts at key zones!
📉 Good luck and manage risk wisely.
Rendon1

USDCAD Pressure Still to the DownsideHead and shoulders Pattern and bearish flag are strong confirmations that the overall trend is still bearish. However, now that the neckline of this H & S Pattern has been broken, be on the lookout for a minor retest before the downtrend resumes.
Patience Pays. The Trend is Your Friend.

Bullish bounce off pullback support?The Loonie (USD/CAD) has bounced of the pivot and could rise to the 1st resistance which acts as a pullback resistance.
Pivot: 1.3674
1st Support: 1.3599
1st Resistance: 1.3793
Risk Warning:
Trading Forex and CFDs carries a high level of risk to your capital and you should only trade with money you can afford to lose. Trading Forex and CFDs may not be suitable for all investors, so please ensure that you fully understand the risks involved and seek independent advice if necessary.
Disclaimer:
The above opinions given constitute general market commentary, and do not constitute the opinion or advice of IC Markets or any form of personal or investment advice.
Any opinions, news, research, analyses, prices, other information, or links to third-party sites contained on this website are provided on an "as-is" basis, are intended only to be informative, is not an advice nor a recommendation, nor research, or a record of our trading prices, or an offer of, or solicitation for a transaction in any financial instrument and thus should not be treated as such. The information provided does not involve any specific investment objectives, financial situation and needs of any specific person who may receive it. Please be aware, that past performance is not a reliable indicator of future performance and/or results. Past Performance or Forward-looking scenarios based upon the reasonable beliefs of the third-party provider are not a guarantee of future performance. Actual results may differ materially from those anticipated in forward-looking or past performance statements. IC Markets makes no representation or warranty and assumes no liability as to the accuracy or completeness of the information provided, nor any loss arising from any investment based on a recommendation, forecast or any information supplied by any third-party.

Lingrid | USDCAD Support Level Bounce OpportunityThe price perfectly fulfilled my last idea . FX:USDCAD is attempting to stabilize after a sharp drop from the 1.3696 resistance area, approaching the lower boundary of the falling wedge pattern. The price is testing the 1.3600–1.3550 support band, aligned with the blue descending trendline and historical pivot zones. A bullish rebound here could push the pair back toward 1.3696, while failure to hold exposes 1.3500 and lower.
📈 Key Levels
Buy zone: 1.3550–1.3600
Sell trigger: breakdown below 1.3550
Target: 1.3696
Buy trigger: breakout and retest of 1.3625–1.3650 zone
💡 Risks
Bearish momentum continuation toward 1.3500 if bounce fails
Weak volume recovery may trap buyers near 1.3620
Rejection near descending red trendline can maintain bearish pressure
If this idea resonates with you or you have your own opinion, traders, hit the comments. I’m excited to read your thoughts!

Should we keep an eye on it?!Hello friends..
This week we should be more on the chart, because most of the charts are in an attractive range for trading.
What our team sees is that the chart (US Dollar to Canadian Dollar) has hit a good range that we previously identified in the daily time frame and has managed to change the trend from a bearish to an upward trend. In the 4-hour time frame, the price shows us the trend change. Now we have to wait and look for a buy trade in the specified range.
The target for this trade can also be 1.3924.
It should be noted that as long as the price does not break the swing low (the line at the bottom) with the candle body, the trend remains upward.
So this week you can put this chart on your watch list.
You can follow our page to see more analysis.

USDCAD-Expecting a PB to 1.42 and then HUGE FALL !!!DISCLAIMER : All labelling and wave counts done by me by manually and i will keep change according to the LIVE MARKET PRICE ACTION. So don't bias, hope on my trade plans...try to learn and make your own strategy...Following is not that much easy...I AM NOT RESPONSIBLE FOR ANY LOSSES IF U TOOK THE TRADE ACCORDING TO MY TRADE PLANS....THANKS LOT..CHEERS

Bearish continuation?The Loonie (USD/CAD) has rejected off the pivot and could drop to the 1st support.
Pivot: 1.3732
1st Support: 1.3431
1st Resistance: 1.3974
Risk Warning:
Trading Forex and CFDs carries a high level of risk to your capital and you should only trade with money you can afford to lose. Trading Forex and CFDs may not be suitable for all investors, so please ensure that you fully understand the risks involved and seek independent advice if necessary.
Disclaimer:
The above opinions given constitute general market commentary, and do not constitute the opinion or advice of IC Markets or any form of personal or investment advice.
Any opinions, news, research, analyses, prices, other information, or links to third-party sites contained on this website are provided on an "as-is" basis, are intended only to be informative, is not an advice nor a recommendation, nor research, or a record of our trading prices, or an offer of, or solicitation for a transaction in any financial instrument and thus should not be treated as such. The information provided does not involve any specific investment objectives, financial situation and needs of any specific person who may receive it. Please be aware, that past performance is not a reliable indicator of future performance and/or results. Past Performance or Forward-looking scenarios based upon the reasonable beliefs of the third-party provider are not a guarantee of future performance. Actual results may differ materially from those anticipated in forward-looking or past performance statements. IC Markets makes no representation or warranty and assumes no liability as to the accuracy or completeness of the information provided, nor any loss arising from any investment based on a recommendation, forecast or any information supplied by any third-party.

USDCAD SC112M
BM
M
Inv H&S
W
Ind. candle
Structure (-)
D
Inv H&S
News liq S1
fib completion -68
4H
Decel 3