USDCAD: Very Bearish PatternThe USDCAD has created a head and shoulders pattern at a significant intraday horizontal resistance.
A bearish breakout from this neckline indicates strong selling pressure, suggesting that the pair is likely to continue declining, potentially reaching at least the 1.3600 level.
USDCAD trade ideas

USDJPY and USDCAD Analysis todayHello traders, this is a complete multiple timeframe analysis of this pair. We see could find significant trading opportunities as per analysis upon price action confirmation we may take this trade. Smash the like button if you find value in this analysis and drop a comment if you have any questions or let me know which pair to cover in my next analysis.

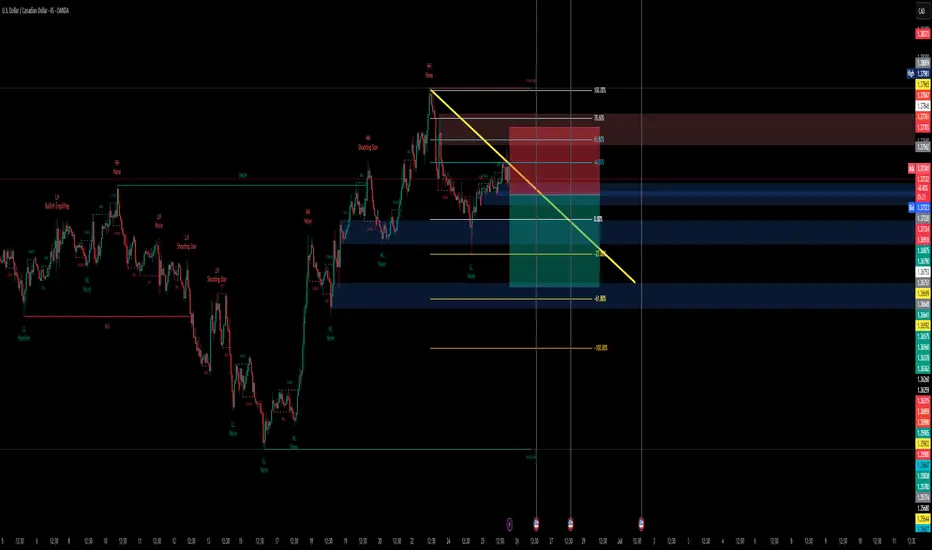
USDCAD I Weekly CLS I Model 1I Target 3M CLS LowHey, Market Warriors, here is another outlook on this instrument
If you’ve been following me, you already know every setup you see is built around a CLS Footprint, a Key Level, Liquidity and a specific execution model.
If you haven't followed me yet, start now.
My trading system is completely mechanical — designed to remove emotions, opinions, and impulsive decisions. No messy diagonal lines. No random drawings. Just clarity, structure, and execution.
🧩 What is CLS?
CLS is real smart money — the combined power of major investment banks and central banks moving over 6.5 trillion dollars a day. Understanding their operations is key to markets.
✅ Understanding the behavior of CLS allows you to position yourself with the giants during the market manipulations — leading to buying lows and selling highs - cleaner entries, clearer exits, and consistent profits.
📍 Model 1
is right after the manipulation of the CLS candle when CIOD occurs, and we are targeting 50% of the CLS range. H4 CLS ranges supported by HTF go straight to the opposing range.
"Adapt what is useful, reject what is useless, and add what is specifically your own."
— David Perk aka Dave FX Hunter ⚔️
👍 Hit like if you find this analysis helpful, and don't hesitate to comment with your opinions, charts or any questions.

Lingrid | USDCAD Support Level Bounce OpportunityThe price perfectly fulfilled my last idea . FX:USDCAD is attempting to stabilize after a sharp drop from the 1.3696 resistance area, approaching the lower boundary of the falling wedge pattern. The price is testing the 1.3600–1.3550 support band, aligned with the blue descending trendline and historical pivot zones. A bullish rebound here could push the pair back toward 1.3696, while failure to hold exposes 1.3500 and lower.
📈 Key Levels
Buy zone: 1.3550–1.3600
Sell trigger: breakdown below 1.3550
Target: 1.3696
Buy trigger: breakout and retest of 1.3625–1.3650 zone
💡 Risks
Bearish momentum continuation toward 1.3500 if bounce fails
Weak volume recovery may trap buyers near 1.3620
Rejection near descending red trendline can maintain bearish pressure
If this idea resonates with you or you have your own opinion, traders, hit the comments. I’m excited to read your thoughts!

USDCAD BUY 1.3568On the 4-hour chart, USDCAD fluctuated and fell. Currently, we can pay attention to the area around 1.3568 below, which is a potential buying position for a bullish bat pattern. At the same time, this position is within the previous demand area.

USDCAD Bearish Reversal Trade Setup – 3H Chart Analysis (June 26 Entry Zone: 1.37279 – 1.37554
🔹 Stop Loss: 1.37934
🔹 Target: 1.35278
🔹 Risk-to-Reward (RR): ~1:2.5
🧠 Technical Breakdown
Trend Overview:
Overall trend shows a downtrend from earlier June, followed by a corrective bullish move.
Price failed to sustain above the 200 EMA (blue line), indicating continued bearish pressure.
Trade Line Break:
A steep bullish trendline was broken, signaling a potential trend reversal or deeper pullback.
Bearish Rejection Zone:
The purple zone (1.37279 – 1.37554) acted as resistance.
Price formed a lower high and rejected this zone, confirming selling interest.
Entry Strategy:
Short entry is ideally within or just below the rejection zone.
Aggressive entry already in play at current market price (1.36909) after confirmation.
Target Zone:
Projected towards 1.35278, aligning with previous support and fib retracement zone.
Large purple support zone near the target suggests a potential reversal area.
⚠️ Risk Notes
Be cautious of USD volatility due to upcoming economic events (noted with icons on the chart).
Stop loss above previous swing high minimizes risk of fakeouts.
✅ Summary:
This is a bearish swing setup aiming for a significant drop toward 1.35278. The clean rejection from resistance and trendline break supports a high-probability short opportunity with favorable risk-reward.

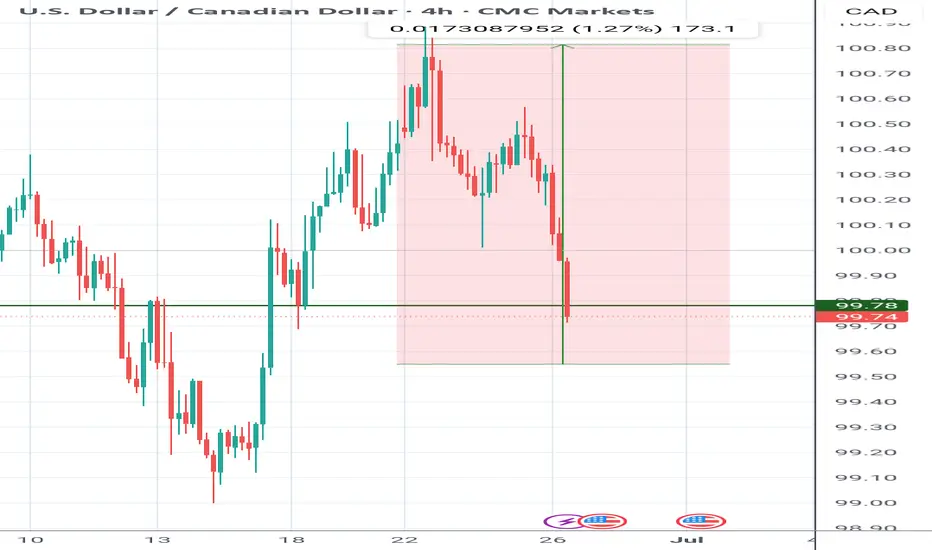
USDCAD – Friday June 27th, 2025USDCAD played beautifully to our bias, breaking the 1.36647 safe sell level and delivering 46 pips clean before pulling back.
If you weren’t already in, the pullback offered a decent re-entry window — but at this point I’m not looking for new trades today.
📌 Still Bearish
Here’s what I’m watching now:
Retest of 1.36647 → possible add-on entry
Break and close below 1.35432 → continuation play
No need to force anything ahead of the weekend. Structure remains bearish and we’ll reassess post-weekend for continuation.

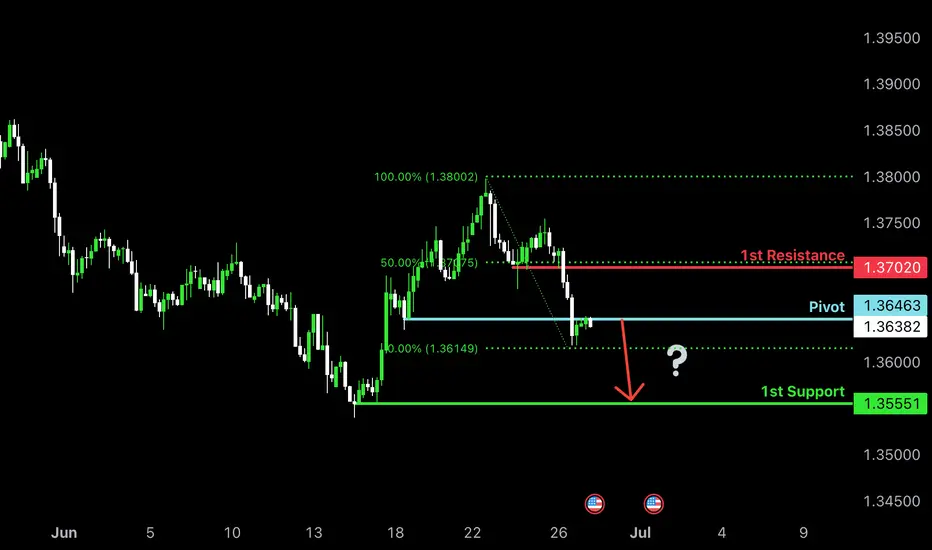
Bearish drop off pullback resistance?USD/CAD is reacting off the pivot which is a pullback resistance and could drop to the 1st support which acts as a pullback support.
Pivot: 1.3646
1st Support: 1.3555
1st Resistance: 1.3702
Risk Warning:
Trading Forex and CFDs carries a high level of risk to your capital and you should only trade with money you can afford to lose. Trading Forex and CFDs may not be suitable for all investors, so please ensure that you fully understand the risks involved and seek independent advice if necessary.
Disclaimer:
The above opinions given constitute general market commentary, and do not constitute the opinion or advice of IC Markets or any form of personal or investment advice.
Any opinions, news, research, analyses, prices, other information, or links to third-party sites contained on this website are provided on an "as-is" basis, are intended only to be informative, is not an advice nor a recommendation, nor research, or a record of our trading prices, or an offer of, or solicitation for a transaction in any financial instrument and thus should not be treated as such. The information provided does not involve any specific investment objectives, financial situation and needs of any specific person who may receive it. Please be aware, that past performance is not a reliable indicator of future performance and/or results. Past Performance or Forward-looking scenarios based upon the reasonable beliefs of the third-party provider are not a guarantee of future performance. Actual results may differ materially from those anticipated in forward-looking or past performance statements. IC Markets makes no representation or warranty and assumes no liability as to the accuracy or completeness of the information provided, nor any loss arising from any investment based on a recommendation, forecast or any information supplied by any third-party.
USD/CAD 15-Minute Time Frame (15TF) Technical & Fundamental AnalUSD/CAD 15-Minute Time Frame (15TF) Technical & Fundamental Analysis
The Bank of Canada (BoC) recently held its benchmark interest rate steady at 2.75%, providing temporary support to the Canadian dollar (CAD). This decision pushed the loonie to an eight-month high as markets interpreted it as a sign of cautious optimism from the BoC.
However, recent data paints a more mixed picture. Weak May retail sales and cooling labor market figures have raised expectations for a possible rate cut later this year, which could weigh heavily on the CAD if confirmed. This divergence in short-term strength and longer-term concern is currently shaping the USD/CAD price action.
Technical Outlook:
USD/CAD has fallen to fresh weekly lows around 1.3626–1.3630, following a breakout above a key level at 1.3680, which was immediately followed by Accumulation and liquidity sweep below that breakout zone.
After hunting stop-losses, price is now pulling back and preparing for potential distribution, as smart money behavior appears to be unfolding.
A limit buy setup is forming at the area of reaccumulation.
📊 Trade Setup
📍 Area of Interest (AOI): 1.36390 (Buy Limit Order)
🛡 Stop-Loss: 1.36300 (Below liquidity grab)
🎯 Take Profit: 1.36680 (Next minor resistance / ~1:2.5 RR)
This trade idea is supported by institutional patterns — breakout, liquidity grab, and reaccumulation — which suggest a bullish continuation move if structure holds.
📌 Disclaimer:
This is not financial advice. Always wait for proper confirmation before executing trades. Manage risk wisely and trade what you see—not what you feel.

USD/CAD: Momentum Turns South Again with Fed Cut Bets BuildingDownside risks flagged in a separate trade idea earlier this week finally materialised for USD/CAD, resulting in the initial target being achieved. With the price now trading marginally below those levels and momentum indicators still bearish, another short setup has presented itself.
If USD/CAD continues to hold beneath 1.3650, shorts could be initiated below the level with a stop above for protection. The obvious target would be support at 1.3550, where the price bounced strongly in May.
With market pricing for Fed rate cuts continuing to build, narrowing yield differentials between the United States and Canada, downside is also favoured from a fundamental perspective.
Good luck!
DS

USD/CAD unclear, lower next weekAnalysing DXY the current daily candle is anticipated to be a consolidation 3rd candle. Although the retracement off the daily Fair Value Gap on USD/CAD looks like the last bearish argument to be removed, I don't expect follow through today.
Rather wait for a 3rd candle on DXY and trade lower from the new Fair Value Gap.

Bullish Bat and Bullish Crab patternWe have added confluence on this long-term swing buy up to 1.37 and 1.38 area. Be Patient. Happy Trading.

USDCAD - Outlook Short on all IndicatorsUSDCAD - Outlook Short on all Indicators
TVC:DXY
FRED:TREASURY
ECONOMICS:USGD
US CONS
- The US Treasury is under $353.5 Billion.
- DXY will continue to fall.
- The Decline of the US Dollar will continue.
- US Debt has exceeded $36 Trillion
- US Federal Debt Deficiency of over $2 Trillion (Must be paid prior to Interest Payments)
- US Federal Interest (over $1 Trillion)
- War in Iran
- USD could be converted to GOLD and moved to BTC
- Moody's US credit rating reduce.
- Interest Rate Cuts
US PROS
- Trump could get funding from another country.
- Interest Rate increases
- Positive FOMC in July

USDCAD Wave Analysis – 26 June 2025
- USDCAD reversed from the resistance zone
- Likely to fall to support level 1.3545
USDCAD currency pair recently reversed down from the resistance zone between the resistance level 1.3770 (former support from the start of May), upper daily Bollinger Band and the 50% Fibonacci correction of the downward impulse from last October.
This resistance zone was further strengthened by the resistance trendline from the start of February.
USDCAD currency pair can be expected to fall to the next support level 1.3545, which reversed the price in the middle of June.

Bullish reversal?USD/CAD is falling towards a support level, which acts as a pullback support just above the 78.6% Fibonacci projection. A bounce from this level could indicate the formation of a double bottom pattern, potentially leading to a price rise toward our take profit target.
Entry: 1.3555
Why we like it:
There is a pullback support levle.
Stop loss: 1.3465
Why we like it:
There is a support level that lines up with the 127.2% Fibonacci extension and the 100% Fibonacci projection.
Take profit: 1.3677
Why we like it:
There is a pullback resistance.
Enjoying your TradingView experience? Review us!
Please be advised that the information presented on TradingView is provided to Vantage (‘Vantage Global Limited’, ‘we’) by a third-party provider (‘Everest Fortune Group’). Please be reminded that you are solely responsible for the trading decisions on your account. There is a very high degree of risk involved in trading. Any information and/or content is intended entirely for research, educational and informational purposes only and does not constitute investment or consultation advice or investment strategy. The information is not tailored to the investment needs of any specific person and therefore does not involve a consideration of any of the investment objectives, financial situation or needs of any viewer that may receive it. Kindly also note that past performance is not a reliable indicator of future results. Actual results may differ materially from those anticipated in forward-looking or past performance statements. We assume no liability as to the accuracy or completeness of any of the information and/or content provided herein and the Company cannot be held responsible for any omission, mistake nor for any loss or damage including without limitation to any loss of profit which may arise from reliance on any information supplied by Everest Fortune Group.

usdcadThe Canadian dollar is likely to move in one of 3 directions:
There is a weekly support and a weekly trend line ahead
There is a daily resistance and a 4-hour timeframe
If the 4-hour support is not broken, it is ready to buy

USDCAD: Bullish Continuation is Expected! Here is Why:
Our strategy, polished by years of trial and error has helped us identify what seems to be a great trading opportunity and we are here to share it with you as the time is ripe for us to buy USDCAD.
Disclosure: I am part of Trade Nation's Influencer program and receive a monthly fee for using their TradingView charts in my analysis.
❤️ Please, support our work with like & comment! ❤️

USDCAD: Price Approaching Buying Zone, Will DXY Bounce Back? The USDCAD pair has dropped significantly in recent times, particularly as the DXY index has plummeted. The extremely bearish nature of the DXY suggests that the price of USDCAD is melting. Both fundamental and technical indicators indicate a potential bullish price reversal for this pair, which could potentially hit our first take-profit area. This is a swing analysis, so please give time for the trade to get activated and for it to work out in our favour.
Please note that this analysis does not guarantee that the price will move as suggested. Before trading, it’s essential to conduct your own research.
If you’d like to assist us, we encourage you to consider the following actions:
- Like our ideas
- Provide comments on our ideas
- Share our ideas
Kind regards,
Team Setupsfx_
Much love ❤️🚀

#USDCAD: 1000+ Pips Big Bullish Move With Three TargetsThe USDCAD is currently in a bearish trend since the day has dropped significantly and is still falling. We anticipate the price to drop slightly more before it reaches our entry zone. There are two entry points, and you can choose either one that aligns with your views. There are three targets, and you can set take profit targets that suit you best.
Good luck and trade safely.
Thanks for your support! 😊
If you want to help us out, here are a few things you can do:
- Like our ideas
- Comment on our ideas
- Share our ideas
Team Setupsfx_
❤️🚀

#USDCAD: Two Major Buying Zones, Patience Pays! As previously analysed, USDCAD is expected to decline towards our predetermined entry point. We anticipate a bearish US Dollar for the remainder of the week, which will ultimately lead USDCAD to reach the entry zone. Three distinct target areas exist, collectively worth over 1100 pips. Each entry point, stop loss, and take profit is clearly defined.
We wish you the best of luck and safe trading.
Thank you for your support.
If you wish to assist us, we encourage you to consider the following actions:
- Like our ideas
- Provide comments on our ideas
- Share our ideas
Kind Regards,
Team Setupsfx_
Much Love ❤️🚀

USDCAD Sell ForecastUSDCAD New Forecast👨💻👨💻
This is my personal trade and not in anyway a mandatory setup.
Note:
Follow proper risk management rules. Never risk more then 2% of your total capital. Money management is the key of success in this business...... Set your own SL & TP.
Please support this idea with a Like and COMMENT if you find it useful click "follow" on our profile if you will like these type of trading ideas delivered straight to your email in the future.
Thanks for your continued support!! lemme know your thoughts in the comment sec..
