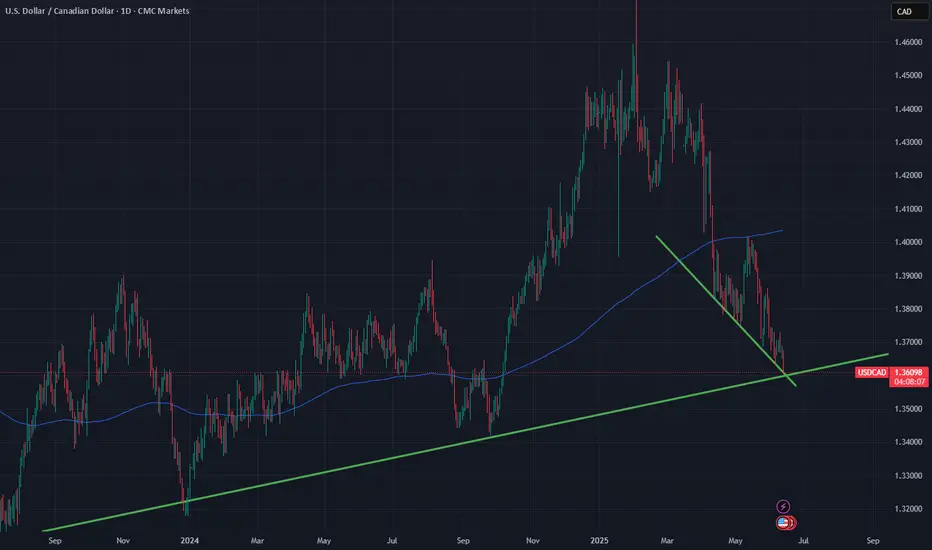
USDCAD SETUPUSD/CAD is currently showing signs of a bullish corrective wave or potential trend reversal after defending a critical demand zone. If the market respects the retracement levels, a move toward 1.3900–1.3950 is likely in the short-to-mid term. Traders should look for a pullback entry or breakout confirmation, with risk managed below recent support.
USDCAD trade ideas

Trade Idea: Sell USD/CAD **Why Sell USD/CAD?**
**🇺🇸 U.S. Dollar (USD):**
* **U.S. growth is slowing**
→ *Losing steam. A weaker economy means less support for the dollar.*
* **Inflation still above 2%**
→ *Sticky, but not scary. Not enough heat for the Fed to tighten further — dollar stays dull.*
* **Fed is on pause, no rate hikes ahead**
→ *The engine's idling. No fuel to push USD higher.*
* **Market heavily short USD**
→ *Traders are already betting against it — and they might be right. Momentum is down.*
---
**🇨🇦 Canadian Dollar (CAD):**
* **Oil prices are back above \$70**
→ *Oil is CAD’s lifeline — and it’s flowing again. That props up the loonie.*
* **BoC holding rates with a neutral tone**
→ *Not cutting, not panicking. Steady hands support CAD.*
* **Core inflation still high (CPI-trim \~3.1%)**
→ *Quiet pressure. Enough to keep the BoC on alert — a silent strength for CAD.*
* **More traders turning bullish on CAD**
→ *The crowd’s shifting — and the loonie is starting to feel the love.*
* **CAD still sensitive to risk-off mood**
→ *If markets panic, CAD could slip. But for now, risk is manageable.*

Usdcad We are currently at the resistance zone and we have to wait and see the coming days candlestick before we can know what to do.

USDCAD - H1 SELL setup USDCAD got rejected twice at H4 major resistant.
Expecting more of a downward movement than upwards movement.

EURUSD BuysWe have reached a HTF support level. On the lower timeframe we have a double bottom with a bullish engulfing candle giving us the confluence needed to enter the trade.

Israel-Iran Confrontation. (I expect upward movement in USD/CADIsrael and Iran are exchanging missile strikes, but it seems markets are trying to play their own game, assuming that this conflict will not cross the nuclear threshold. in the meantime, investors are shifting their focus to key events this week.
The main highlights will be the consumer inflation reports from the UK and the eurozone. In the EU, inflation is expected to stabilize at 1.9%, while in the UK, it is forecast to decrease from 3.5% to 3.3% year over year.
This week will also bring central bank meetings in Switzerland, the UK, and, of course, the U.S. Federal Reserve-which will likely take center stage and divert attention from the tow European central banks.
Other events worth focusing on include the release of the Philadelphia Fed Manufacturing Index U.S. retail sales figures.
But let's return to the week's main event-the Fed's final monetary policy decision, which will be made over two days, Tuesday and Wednesday. According to the consensus forecast, the central bank is expected to leave the key interest rate unchanged at 4,50% The main reasons for this are persistently high consumer inflation figures, which showed an annual increase last week (albeit smaller than expected), and uncertainty about the consequences of Donald Trump's presidency. Fed Chair Jerome Powell has previously cited both as reasons to pause the rate-cutting cycle.
So, what might come of the Fed holding rates steady?
Frankly, not much. Ongoing uncertainty will continue to be the primary driving force in the markets. Traders are starting to anticipate rate cuts in the second half of the year. However, I believe there is a strong chance that rates will remain unchanged until next year. This is due not only to risk of inflation returning to 3% and the murky geoeconomic policies of the U.S.-China trade war and its unclear outcome.
Given this combination of negative factors-each of which obstructs rate cuts-and the fact that the market has already priced these into its expectations, we can anticipate a continuation of existing trends.
The pair is declining amid rising crude oil prices, which support the Canadian dollar, a commodity-linked currency. If oil prices resume upward momentum, USD/CAD will face pressure again. If the pair fails to rise above 1,3600, a decline toward 1.3435 is likely. A potential sell level is 13560.

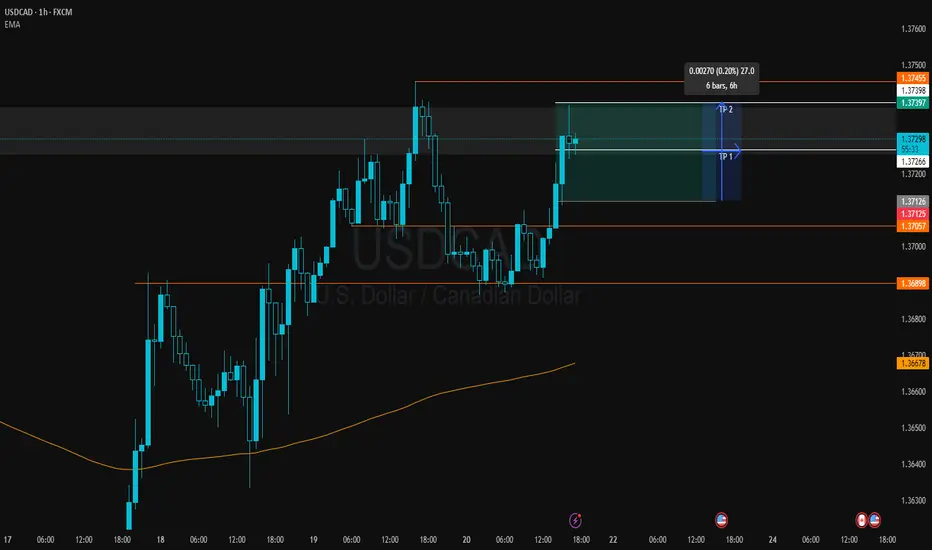
Today small trade. USDCAD BUY 27 PIPS Today's short intraday trade on the USDCAD currency pair. Entry was based on small trend and a subsequent reaction from a key support area. The market offered a clean move to the upside – trade closed with a +27 pip profit.
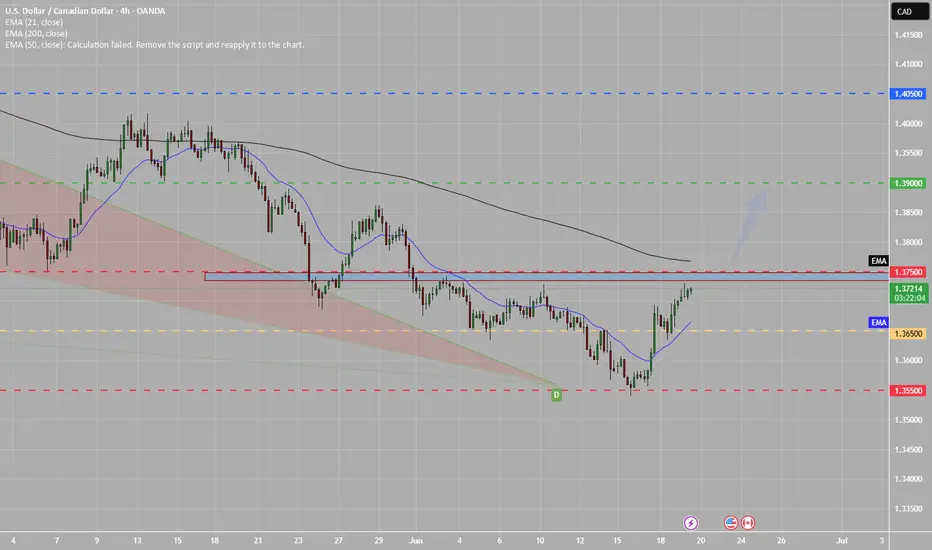
USDCAD Analysis – Breaking the Chains, Eyeing 1.38+USDCAD Price broke out from a long descending channel, followed by two bullish continuation flags – classic breakout-retest pattern.
Price is now pushing above 1.3720, aligning with the 38.2% Fib level of the prior drop.
Next upside targets:
🔹 1.3833 (Fib 61.8%)
🔹 1.3913 (Fib 78.6%)
Clear stop level: below 1.3625 (channel breakout support)
Structure Bias: Bullish continuation. Clean breakout + consolidation = probable impulse toward 1.3830/1.39.
📊 Current Bias: Bullish
🔍 Key Fundamentals Driving USDCAD
USD Drivers (Neutral to Bullish):
Fed held rates, dot plot shows only 1 cut in 2025, but Powell's tone leaned dovish.
US Retail Sales + PPI were weak, but safe-haven USD demand persists due to geopolitical risks and equity volatility.
Market reassessing Trump election risk, Fed independence, and inflation stickiness.
CAD Drivers (Bearish):
Oil prices are volatile due to Middle East tensions, but weak demand caps upside.
Canada’s CPI softened, BoC already delivered a dovish cut earlier this month.
CAD under pressure due to dovish BoC outlook and fiscal concerns (gov't budget deficits expanding).
CAD is also suffering from reduced foreign investment flows.
⚠️ Risks to Watch
Oil price spikes (especially if Strait of Hormuz risk escalates) may boost CAD short-term.
A sharp reversal in DXY or Fed commentary shift toward aggressive easing.
Weak US data next week (Core PCE especially) could unwind USD momentum.
🗓️ Upcoming Events to Watch
US Core PCE (June 28) – critical inflation gauge for the Fed
BoC Business Outlook Survey
Oil Inventories + Global energy sentiment
Geopolitical: Israel–Iran updates and Canada’s fiscal signals
🏁 Which Pair Leads the Move?
USDCAD is leading commodity crosses as CAD weakness broadens. Watch USDCAD and GBPCAD for signs of CAD softness before others like AUDCAD/NZDCAD follow.


USDCAD change its directions.Bullish divergence
.Clearly breakout of LH
.Already made First HH
.Drive with the trend.

USDCAD SELLIt's these setups that i do not publish that make it through. But from now I will post set ups that give me 2 affirmations like this one. A triangle and a support zone.
usdcad am i foolish to think like this ??? what would u say if you saw this , whats your view ? block out all the noise and see it
Falling towards 50% Fibonacci support?The Loonie (USD/CAD) is falling towards the pivot which acts as an overlap support that lines up with the 50% Fibonacci retracement and could bounce to the pullback resistance.
Pivot: 1.3651
1st Support: 1.3581
1st Resistance: 1.3735
Risk Warning:
Trading Forex and CFDs carries a high level of risk to your capital and you should only trade with money you can afford to lose. Trading Forex and CFDs may not be suitable for all investors, so please ensure that you fully understand the risks involved and seek independent advice if necessary.
Disclaimer:
The above opinions given constitute general market commentary, and do not constitute the opinion or advice of IC Markets or any form of personal or investment advice.
Any opinions, news, research, analyses, prices, other information, or links to third-party sites contained on this website are provided on an "as-is" basis, are intended only to be informative, is not an advice nor a recommendation, nor research, or a record of our trading prices, or an offer of, or solicitation for a transaction in any financial instrument and thus should not be treated as such. The information provided does not involve any specific investment objectives, financial situation and needs of any specific person who may receive it. Please be aware, that past performance is not a reliable indicator of future performance and/or results. Past Performance or Forward-looking scenarios based upon the reasonable beliefs of the third-party provider are not a guarantee of future performance. Actual results may differ materially from those anticipated in forward-looking or past performance statements. IC Markets makes no representation or warranty and assumes no liability as to the accuracy or completeness of the information provided, nor any loss arising from any investment based on a recommendation, forecast or any information supplied by any third-party.

USD/CAD H1 | Potential bounce off an overlap supportUSD/CAD is falling towards an overlap support and could potentially bounce off this level to climb higher.
Buy entry is at 1.3686 which is an overlap support that aligns with the 50% Fibonacci retracement.
Stop loss is at 1.3633 which is a level that lies underneath anoverlap support and the 50% Fibonacci retracement.
Take profit is at 1.3738 which is a swing-high resistance.
High Risk Investment Warning
Trading Forex/CFDs on margin carries a high level of risk and may not be suitable for all investors. Leverage can work against you.
Stratos Markets Limited (tradu.com ):
CFDs are complex instruments and come with a high risk of losing money rapidly due to leverage. 63% of retail investor accounts lose money when trading CFDs with this provider. You should consider whether you understand how CFDs work and whether you can afford to take the high risk of losing your money.
Stratos Europe Ltd (tradu.com ):
CFDs are complex instruments and come with a high risk of losing money rapidly due to leverage. 63% of retail investor accounts lose money when trading CFDs with this provider. You should consider whether you understand how CFDs work and whether you can afford to take the high risk of losing your money.
Stratos Global LLC (tradu.com ):
Losses can exceed deposits.
Please be advised that the information presented on TradingView is provided to Tradu (‘Company’, ‘we’) by a third-party provider (‘TFA Global Pte Ltd’). Please be reminded that you are solely responsible for the trading decisions on your account. There is a very high degree of risk involved in trading. Any information and/or content is intended entirely for research, educational and informational purposes only and does not constitute investment or consultation advice or investment strategy. The information is not tailored to the investment needs of any specific person and therefore does not involve a consideration of any of the investment objectives, financial situation or needs of any viewer that may receive it. Kindly also note that past performance is not a reliable indicator of future results. Actual results may differ materially from those anticipated in forward-looking or past performance statements. We assume no liability as to the accuracy or completeness of any of the information and/or content provided herein and the Company cannot be held responsible for any omission, mistake nor for any loss or damage including without limitation to any loss of profit which may arise from reliance on any information supplied by TFA Global Pte Ltd.
The speaker(s) is neither an employee, agent nor representative of Tradu and is therefore acting independently. The opinions given are their own, constitute general market commentary, and do not constitute the opinion or advice of Tradu or any form of personal or investment advice. Tradu neither endorses nor guarantees offerings of third-party speakers, nor is Tradu responsible for the content, veracity or opinions of third-party speakers, presenters or participants.

USDCAD BUY Am seeing a buy Opportunities on USDCAD
ENTRY: 1.36900
Stoploss: 1.36800
Take profit: 1.37500
Comment your opinion
For fund management. DM on X @shajudeakinoba1

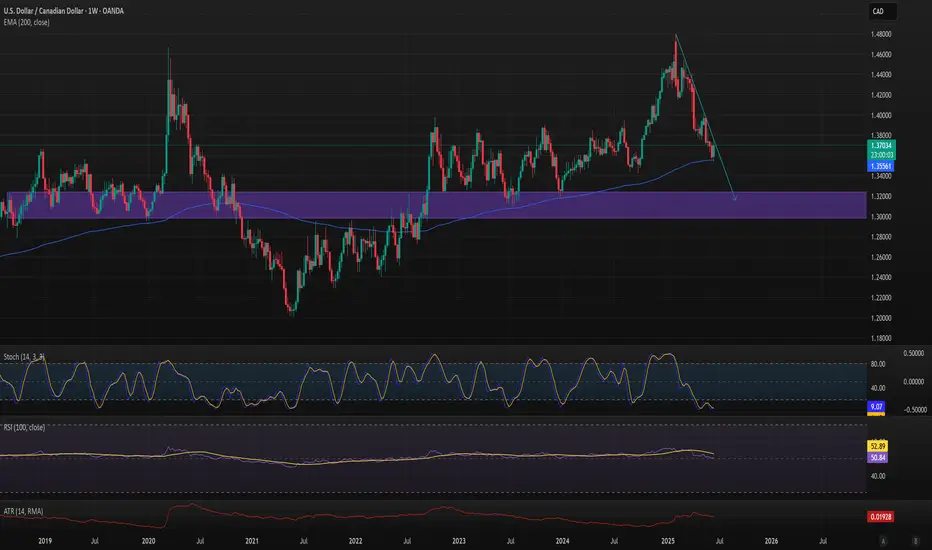
USDCAD - ShortAwaiting a weekly break in the 100 and 200 Moving Average then take to $1.35 or lower.
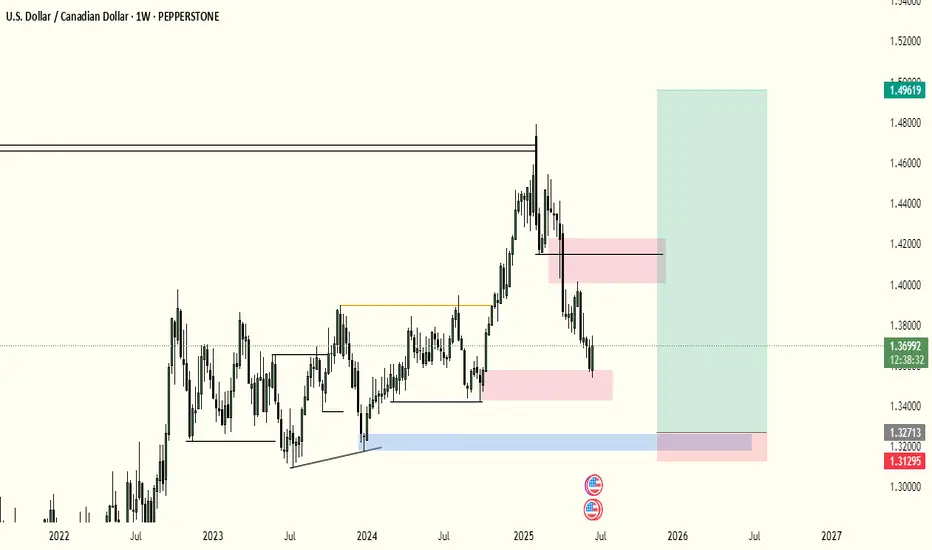
Long Idea for USDCADI beleive the USDCAD its in good spot to start rising again. The correction may be over and now I'm looking for a good bounce
Targets:
TP1. 1.37
TP2. 1.38
TP3. 1.40
Good luck
USDCAD COT and Liquidity AnalysisHey what up traders welcome to the COT data and Liquidity report. It's always good to go with those who move the market here is what I see in their cards. I share my COT - order flow views every weekend.
🎯 Non Commercials added significant longs and closed shorts at the same time. So for that reason I see the highs as a liquidity for their longs profits taking.
📍Please be aware that institutions report data to the SEC on Tuesdays and data are reported on Fridays - so again we as retail traders have disadvantage, but there is possibility to read between the lines. Remember in the report is what they want you to see, that's why mostly price reverse on Wednesday after the report so their cards are hidden as long as possible. However if the trend is running you can read it and use for your advantage.
💊 Tip
if the level has confluence with the high volume on COT it can be strong support / Resistance.
👍 Hit like if you find this analysis helpful, and don't hesitate to comment with your opinions, charts or any questions.
Analysis done on the Tradenation Charts
Disclosure: I am part of Trade Nation's Influencer program and receive a monthly fee for using their TradingView charts in my analysis.
"Adapt what is useful, reject what is useless, and add what is specifically your own."
— David Perk aka Dave FX Hunter ⚔️

Bullish rise for the Loonie?The price has reacted off the resistance level which is an overlap resistance and could potentially rise from this level to our take profit.
Entry: 1.3703
Why we like it:
There is an overlap resistance level.
Stop loss: 1.3647
Why we like it:
There is an overlap support level.
Take profit: 1.3857
Why we like it:
There is a pullback resistance level that aligns with the 161.8% Fibonacci extension.
Enjoying your TradingView experience? Review us!
Please be advised that the information presented on TradingView is provided to Vantage (‘Vantage Global Limited’, ‘we’) by a third-party provider (‘Everest Fortune Group’). Please be reminded that you are solely responsible for the trading decisions on your account. There is a very high degree of risk involved in trading. Any information and/or content is intended entirely for research, educational and informational purposes only and does not constitute investment or consultation advice or investment strategy. The information is not tailored to the investment needs of any specific person and therefore does not involve a consideration of any of the investment objectives, financial situation or needs of any viewer that may receive it. Kindly also note that past performance is not a reliable indicator of future results. Actual results may differ materially from those anticipated in forward-looking or past performance statements. We assume no liability as to the accuracy or completeness of any of the information and/or content provided herein and the Company cannot be held responsible for any omission, mistake nor for any loss or damage including without limitation to any loss of profit which may arise from reliance on any information supplied by Everest Fortune Group.

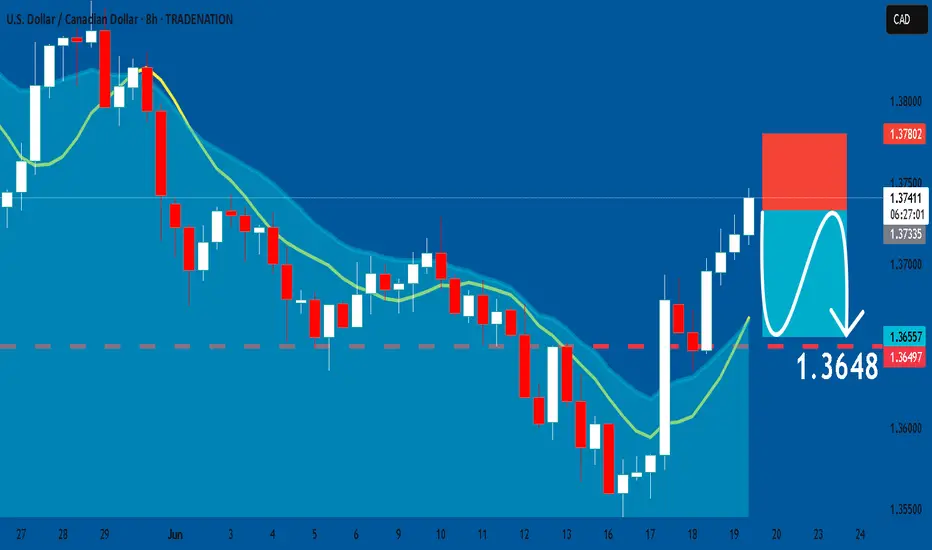
USDCAD: Short Signal Explained
USDCAD
- Classic bearish formation
- Our team expects pullback
SUGGESTED TRADE:
Swing Trade
Short USDCAD
Entry - 1.3734
Sl - 1.3780
Tp - 1.3648
Our Risk - 1%
Start protection of your profits from lower levels
Disclosure: I am part of Trade Nation's Influencer program and receive a monthly fee for using their TradingView charts in my analysis.
❤️ Please, support our work with like & comment! ❤️
UC WAITING GAME Looking to see how price reacts to this recent bearish rally, trend is biased for shorts. However, we can possible start to see price climb, I have a target in mind which is the green resistance (weekly) would like to see break and retest of the Daily (red line) before price continues to the mentioned target.
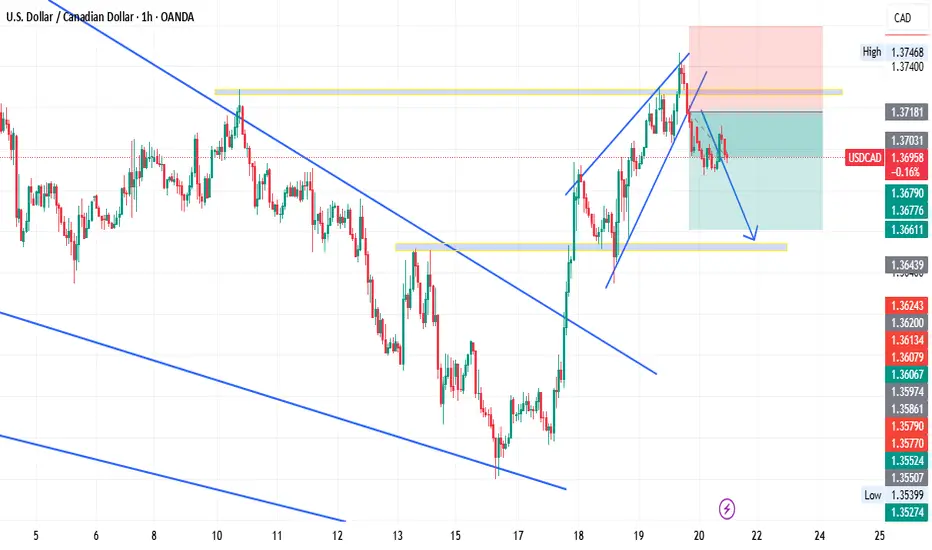
SHORT ON USD/CADUSD/CAD has given a confirmation choc (change of character) from up to down on the lower timeframe (5min) from a MAJOR supply area.
I will be selling USD/CAD looking to make over 100 pips to the next demand level.

USD/CAD SHORT FROM RESISTANCE
Hello, Friends!
USD/CAD is trending down which is evident from the red colour of the previous weekly candle. However, the price has locally surged into the overbought territory. Which can be told from its proximity to the BB upper band. Which presents a beautiful trend following opportunity for a short trade from the resistance line above towards the demand level of 1.361.
Disclosure: I am part of Trade Nation's Influencer program and receive a monthly fee for using their TradingView charts in my analysis.
✅LIKE AND COMMENT MY IDEAS✅
