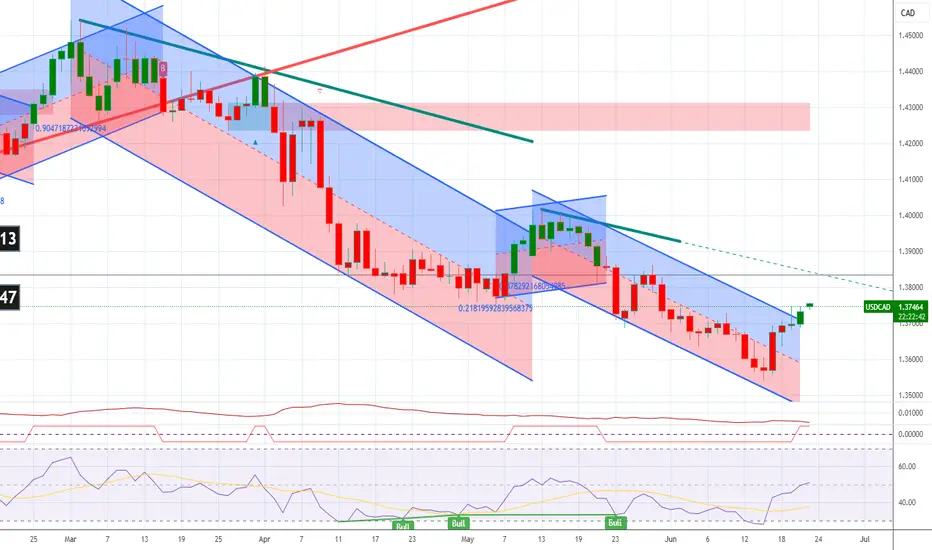
USDCAD LongUSDCAD is now net long on the regression break.
I am considering this trades as the positive roll make it attractive.
USDCAD trade ideas
Bullish rise?The Loonie (USD/CAD) has reacted off the pivot and could potentially rise to the 1st resistance which acts as a pullback resistance.
Pivot: 1.3697
1st Support: 1.3561
1st Resistance: 1.3843
Risk Warning:
Trading Forex and CFDs carries a high level of risk to your capital and you should only trade with money you can afford to lose. Trading Forex and CFDs may not be suitable for all investors, so please ensure that you fully understand the risks involved and seek independent advice if necessary.
Disclaimer:
The above opinions given constitute general market commentary, and do not constitute the opinion or advice of IC Markets or any form of personal or investment advice.
Any opinions, news, research, analyses, prices, other information, or links to third-party sites contained on this website are provided on an "as-is" basis, are intended only to be informative, is not an advice nor a recommendation, nor research, or a record of our trading prices, or an offer of, or solicitation for a transaction in any financial instrument and thus should not be treated as such. The information provided does not involve any specific investment objectives, financial situation and needs of any specific person who may receive it. Please be aware, that past performance is not a reliable indicator of future performance and/or results. Past Performance or Forward-looking scenarios based upon the reasonable beliefs of the third-party provider are not a guarantee of future performance. Actual results may differ materially from those anticipated in forward-looking or past performance statements. IC Markets makes no representation or warranty and assumes no liability as to the accuracy or completeness of the information provided, nor any loss arising from any investment based on a recommendation, forecast or any information supplied by any third-party.

USDCAD H4 AnalysisUSDCAD Showing a Bearish Flag. If it breaks this zone above, Most probably can fly up to 1.37836 and higher to 1.38654. If no, Can rally between 1.36359, 1.35415 or even lower. Trading Analysis from 23-06-25 to 27-06-25. Take your risk under control and wait for market to break support or resistance on smaller time frame. Best of luck everyone and happy trading.🤗

Smart Money Just Flipped Bearish on USD/CAD. Are You Still Long?🧠 1. COT Context & Institutional Flows
🇨🇦 CAD COT Report (CME) – June 10, 2025
Non-Commercials (speculators): net short 93,143 contracts (19,651 long vs. 112,794 short), with a short reduction of -14,319 → early bearish unwinding.
Commercials: net long 91,207 contracts (223,285 long vs. 132,078 short), with strong accumulation (+27,999 longs).
🔄 Net open interest change: +18,436 → renewed institutional interest on the long CAD side.
🇺🇸 USD Index COT Report (ICE) – June 10, 2025
Non-Commercials: net long 1,402 contracts (17,027 long vs. 15,625 short), with a +1,279 increase in longs → modest USD support.
Commercials remain net short -35 contracts, no clear shift.
🔄 Total open interest +2,652 → mild bullish interest in USD.
📌 Implication: Strong institutional support for CAD, USD mildly supported. Net positioning favors downside pressure on USD/CAD.
💹 2. Technical Analysis & Price Action
Primary trend: clearly bearish from the 1.38 zone.
Current price: 1.3552, testing a macro demand zone (1.3470–1.3540).
Daily RSI remains deeply oversold → possible technical bounce, but no reversal structure confirmed.
Recent candles show lower highs and lower lows, with no bullish momentum.
📌 Implication: The bearish trend remains in control. A technical rebound is possible, but bias stays short as long as price trades below 1.3640.
📈 3. Retail Sentiment
77% of retail traders are long USD/CAD, with an average entry at 1.3646.
Only 23% are short, positioned better at 1.3790.
📌 Implication: Retail is heavily long → contrarian bearish signal confirmed.
📊 4. Seasonality
June is historically weak for USD/CAD:
5Y Avg: -0.0118
2Y Avg: -0.0081
The June seasonal curve shows a stronger downside acceleration into the second half of the month.
📌 Implication: Seasonality adds downward pressure into month-end.

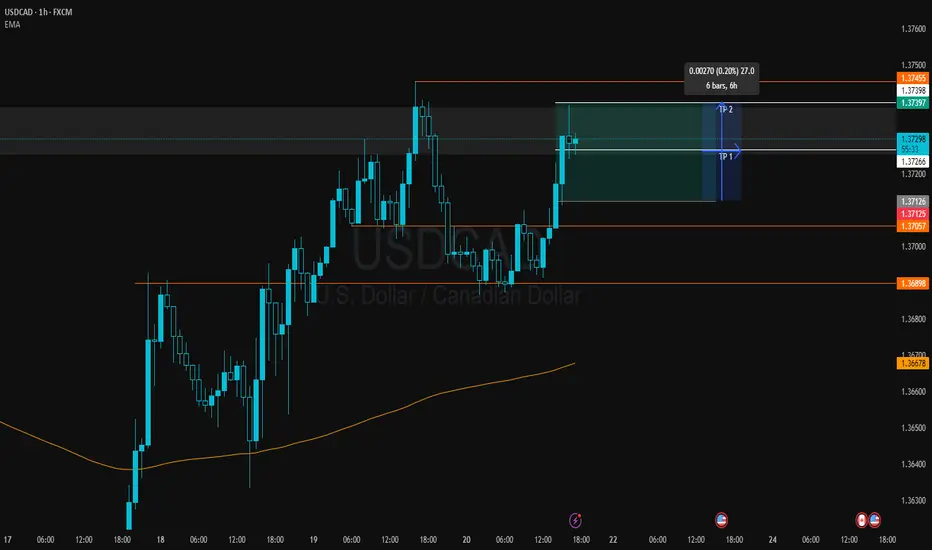
Bullish bounce off pullback support?USD/CAD has bounced off the support level which is a pullback support that lines up with the 23.6% Fibonacci retracement and could rise from this level to our take profit.
Entry: 1.3703
Why we like it:
There is a pullback support level that lines up with the 23.6% Fibonacci retracement.
Stop loss: 1.3647
Why we like it:
There is an overlap support that lines up with the 50% Fibonacci retracement.
Take profit: 1.3815
Why we like it:
There is a pullback resistance that aligns with the 145% Fibonacci extension.
Enjoying your TradingView experience? Review us!
Please be advised that the information presented on TradingView is provided to Vantage (‘Vantage Global Limited’, ‘we’) by a third-party provider (‘Everest Fortune Group’). Please be reminded that you are solely responsible for the trading decisions on your account. There is a very high degree of risk involved in trading. Any information and/or content is intended entirely for research, educational and informational purposes only and does not constitute investment or consultation advice or investment strategy. The information is not tailored to the investment needs of any specific person and therefore does not involve a consideration of any of the investment objectives, financial situation or needs of any viewer that may receive it. Kindly also note that past performance is not a reliable indicator of future results. Actual results may differ materially from those anticipated in forward-looking or past performance statements. We assume no liability as to the accuracy or completeness of any of the information and/or content provided herein and the Company cannot be held responsible for any omission, mistake nor for any loss or damage including without limitation to any loss of profit which may arise from reliance on any information supplied by Everest Fortune Group.

USDCAD TRADE SETUPWait for retest the entry level and bullish momentum then take a trade for Buy otherwise skip this setup

The End of A Trend & The Start of A New OneA few weeks ago we made an amazing bearish call of the $USDCAD. Now that it's come to an end, the market is showing signs of a potential reversal.
In this video we're going to talk about how to identify a potential reversal in trend and of course show you how I'm looking to trade it.
Please leave any questions, comments or shared ideas below.
Akil

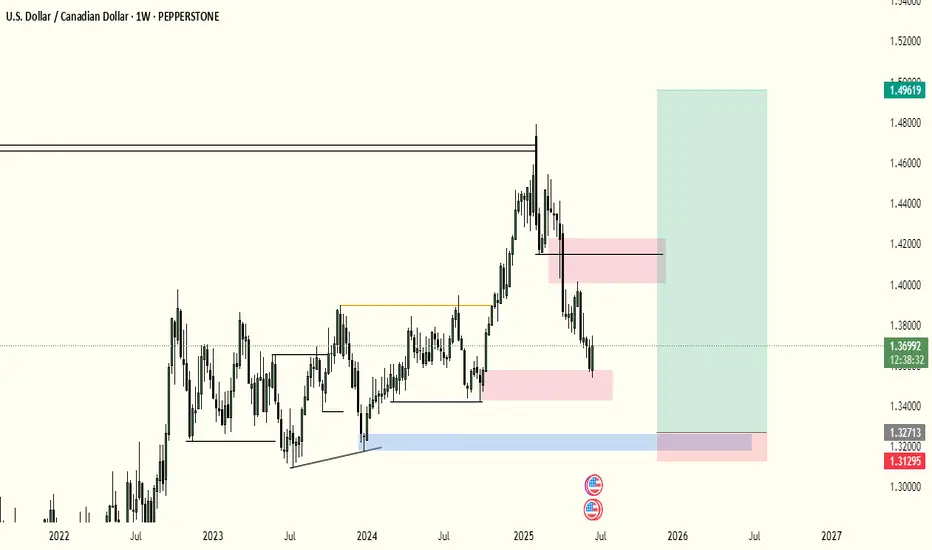
USDCAD DETAILED ANALYSISUSDCAD has formed a classic falling wedge pattern on the daily timeframe, with price currently pressing against the upper trendline resistance near 1.37300. This is a high-probability bullish reversal setup, and the pair is showing early signs of a potential breakout. The recent bullish momentum from the lows suggests buyers are stepping in aggressively, and if we get a strong daily close above the wedge, it could confirm the start of a new upward leg. My near-term target for this breakout is 1.47300, offering an excellent risk-reward profile.
From a fundamental perspective, the Canadian Dollar is currently under pressure due to weakening oil prices and softening domestic economic data. The Bank of Canada has recently signaled a dovish tilt following its latest rate cut in June, citing slower GDP growth and easing inflation. On the other hand, the US Dollar is finding renewed strength backed by sticky inflation and the Fed’s cautious stance on rate cuts. The divergence in monetary policy between the Fed and BoC is creating a favorable environment for USDCAD bulls.
Technically, the confluence of wedge resistance, bullish divergence on the RSI, and a clear higher low formation all point toward a breakout scenario. A break above 1.37600–1.38000 would unlock the next wave of bullish continuation, potentially accelerating momentum toward the 1.47 handle. This area also aligns with the previous March highs, making it a strong technical magnet.
I remain bullish on USDCAD and will be watching the breakout closely this week. If the pair holds above 1.36800 and breaks structure convincingly, I’ll be adding to longs on confirmation. The current setup presents a textbook breakout opportunity supported by strong fundamentals, technical structure, and market sentiment leaning in favor of the USD.

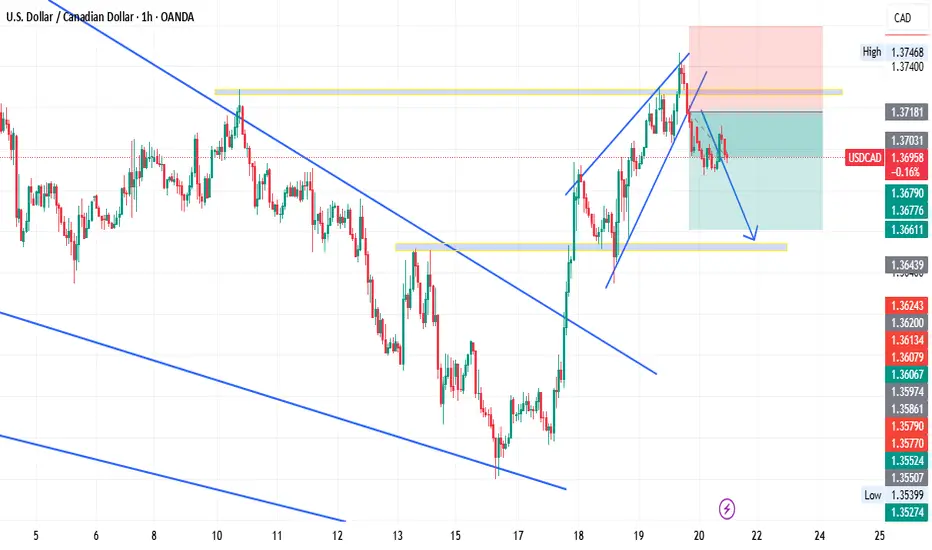
USD/CAD Trap in Progress? Smart Money Flips BearishUSD/CAD is currently in a rebalancing phase after the strong downside correction seen over recent weeks. Following a rejection in the 1.3900–1.4000 supply zone, price retraced down to a major demand area between 1.3500 and 1.3650, where it has shown a notable bullish reaction. The pair is now trading at 1.3734, and multi-frame data suggests we are in a transitional phase—not yet a confirmed bullish trend reversal.
COT Report – Institutional Positioning
The latest Commitments of Traders data (June 10th) reveals critical signals:
Commercials (hedgers and large institutions) have aggressively increased their long exposure on CAD, adding +27,999 contracts. This indicates strong expectations of Canadian dollar appreciation—bearish implications for USD/CAD in the medium term.
Non-Commercials (speculators) reduced their short CAD exposure by -14,319 contracts, signaling that speculative players are starting to unwind long USD/CAD positions.
Overall, the net shift shows institutional sentiment turning bearish on the pair, potentially pointing to a deeper downside once the current technical pullback completes.
USD Index COT – Dollar Momentum Weakening
On the USD Index, Non-Comms have added +1,279 long contracts, but positioning remains moderate. Commercials are flat, suggesting the dollar lacks strong bullish backing. This makes any sustained USD/CAD rally structurally fragile.
Retail Sentiment
Retail traders are 57% short and 43% long on USD/CAD. Although not extreme, this imbalance suggests confidence among retail participants in a bearish move—often preceding a short-term upward squeeze before an eventual trend continuation.
We could therefore see price move toward 1.3900 as a liquidity grab, setting the stage for a larger reversal.
Technical Analysis – Outlook
Key highlights:
A strong bullish reaction occurred from the 1.3500–1.3650 demand zone, previously well-respected.
The weekly RSI is still below the 50-level but is turning upward—momentum is improving.
Price structure shows room for a pullback to the 1.3900–1.4000 supply zone, which aligns with higher-timeframe order blocks.
This zone remains a critical resistance, and unless the macro and positioning context changes, a renewed bearish impulse is expected from this area.
Trading Outlook
The current picture presents a tactical short-term long opportunity, followed by a potential structural short setup.
📈 Scenario 1 – Bullish Pullback (in play):
With price above 1.3700 and consolidating, there’s space for a rally toward the 1.3900–1.4000 supply zone. Ideal for short-term targets.
📉 Scenario 2 – Structural Short (priority bias):
Should price reach 1.3950–1.4000 and show bearish confirmation (e.g., engulfing, doji, rejection on H4/H1), this would be a prime area to initiate swing shorts, targeting 1.3600 and eventually 1.3450.
✅ Final Bias: Structural Bearish – Corrective Bullish
Watch for potential false breakouts above 1.3800–1.3900 to liquidate retail shorts before a more meaningful downside move. The sharp increase in commercial net long CAD positions supports a bearish USD/CAD bias for the coming weeks.

USDCAD LONG SETUPI am expecting the US Dollar to be bullish this week.
Weekly closed as a bullish engulfing.
Expecting price to make a minor pull back on the daily before taking making another bullish push.
Price is also showing a bullish divergence on the daily, which furthers strengthens my perspective.
The 2H TF also illustrates somewhat of a Cup-and-Handle Candle Stick Formation
Will look to enter longs on the lower TFs (1-4h)

USDCAD SETUPUSD/CAD is currently showing signs of a bullish corrective wave or potential trend reversal after defending a critical demand zone. If the market respects the retracement levels, a move toward 1.3900–1.3950 is likely in the short-to-mid term. Traders should look for a pullback entry or breakout confirmation, with risk managed below recent support.

Trade Idea: Sell USD/CAD **Why Sell USD/CAD?**
**🇺🇸 U.S. Dollar (USD):**
* **U.S. growth is slowing**
→ *Losing steam. A weaker economy means less support for the dollar.*
* **Inflation still above 2%**
→ *Sticky, but not scary. Not enough heat for the Fed to tighten further — dollar stays dull.*
* **Fed is on pause, no rate hikes ahead**
→ *The engine's idling. No fuel to push USD higher.*
* **Market heavily short USD**
→ *Traders are already betting against it — and they might be right. Momentum is down.*
---
**🇨🇦 Canadian Dollar (CAD):**
* **Oil prices are back above \$70**
→ *Oil is CAD’s lifeline — and it’s flowing again. That props up the loonie.*
* **BoC holding rates with a neutral tone**
→ *Not cutting, not panicking. Steady hands support CAD.*
* **Core inflation still high (CPI-trim \~3.1%)**
→ *Quiet pressure. Enough to keep the BoC on alert — a silent strength for CAD.*
* **More traders turning bullish on CAD**
→ *The crowd’s shifting — and the loonie is starting to feel the love.*
* **CAD still sensitive to risk-off mood**
→ *If markets panic, CAD could slip. But for now, risk is manageable.*

Usdcad We are currently at the resistance zone and we have to wait and see the coming days candlestick before we can know what to do.

USDCAD - H1 SELL setup USDCAD got rejected twice at H4 major resistant.
Expecting more of a downward movement than upwards movement.

EURUSD BuysWe have reached a HTF support level. On the lower timeframe we have a double bottom with a bullish engulfing candle giving us the confluence needed to enter the trade.

Israel-Iran Confrontation. (I expect upward movement in USD/CADIsrael and Iran are exchanging missile strikes, but it seems markets are trying to play their own game, assuming that this conflict will not cross the nuclear threshold. in the meantime, investors are shifting their focus to key events this week.
The main highlights will be the consumer inflation reports from the UK and the eurozone. In the EU, inflation is expected to stabilize at 1.9%, while in the UK, it is forecast to decrease from 3.5% to 3.3% year over year.
This week will also bring central bank meetings in Switzerland, the UK, and, of course, the U.S. Federal Reserve-which will likely take center stage and divert attention from the tow European central banks.
Other events worth focusing on include the release of the Philadelphia Fed Manufacturing Index U.S. retail sales figures.
But let's return to the week's main event-the Fed's final monetary policy decision, which will be made over two days, Tuesday and Wednesday. According to the consensus forecast, the central bank is expected to leave the key interest rate unchanged at 4,50% The main reasons for this are persistently high consumer inflation figures, which showed an annual increase last week (albeit smaller than expected), and uncertainty about the consequences of Donald Trump's presidency. Fed Chair Jerome Powell has previously cited both as reasons to pause the rate-cutting cycle.
So, what might come of the Fed holding rates steady?
Frankly, not much. Ongoing uncertainty will continue to be the primary driving force in the markets. Traders are starting to anticipate rate cuts in the second half of the year. However, I believe there is a strong chance that rates will remain unchanged until next year. This is due not only to risk of inflation returning to 3% and the murky geoeconomic policies of the U.S.-China trade war and its unclear outcome.
Given this combination of negative factors-each of which obstructs rate cuts-and the fact that the market has already priced these into its expectations, we can anticipate a continuation of existing trends.
The pair is declining amid rising crude oil prices, which support the Canadian dollar, a commodity-linked currency. If oil prices resume upward momentum, USD/CAD will face pressure again. If the pair fails to rise above 1,3600, a decline toward 1.3435 is likely. A potential sell level is 13560.

Today small trade. USDCAD BUY 27 PIPS Today's short intraday trade on the USDCAD currency pair. Entry was based on small trend and a subsequent reaction from a key support area. The market offered a clean move to the upside – trade closed with a +27 pip profit.
USDCAD Analysis – Breaking the Chains, Eyeing 1.38+USDCAD Price broke out from a long descending channel, followed by two bullish continuation flags – classic breakout-retest pattern.
Price is now pushing above 1.3720, aligning with the 38.2% Fib level of the prior drop.
Next upside targets:
🔹 1.3833 (Fib 61.8%)
🔹 1.3913 (Fib 78.6%)
Clear stop level: below 1.3625 (channel breakout support)
Structure Bias: Bullish continuation. Clean breakout + consolidation = probable impulse toward 1.3830/1.39.
📊 Current Bias: Bullish
🔍 Key Fundamentals Driving USDCAD
USD Drivers (Neutral to Bullish):
Fed held rates, dot plot shows only 1 cut in 2025, but Powell's tone leaned dovish.
US Retail Sales + PPI were weak, but safe-haven USD demand persists due to geopolitical risks and equity volatility.
Market reassessing Trump election risk, Fed independence, and inflation stickiness.
CAD Drivers (Bearish):
Oil prices are volatile due to Middle East tensions, but weak demand caps upside.
Canada’s CPI softened, BoC already delivered a dovish cut earlier this month.
CAD under pressure due to dovish BoC outlook and fiscal concerns (gov't budget deficits expanding).
CAD is also suffering from reduced foreign investment flows.
⚠️ Risks to Watch
Oil price spikes (especially if Strait of Hormuz risk escalates) may boost CAD short-term.
A sharp reversal in DXY or Fed commentary shift toward aggressive easing.
Weak US data next week (Core PCE especially) could unwind USD momentum.
🗓️ Upcoming Events to Watch
US Core PCE (June 28) – critical inflation gauge for the Fed
BoC Business Outlook Survey
Oil Inventories + Global energy sentiment
Geopolitical: Israel–Iran updates and Canada’s fiscal signals
🏁 Which Pair Leads the Move?
USDCAD is leading commodity crosses as CAD weakness broadens. Watch USDCAD and GBPCAD for signs of CAD softness before others like AUDCAD/NZDCAD follow.


USDCAD change its directions.Bullish divergence
.Clearly breakout of LH
.Already made First HH
.Drive with the trend.

USDCAD SELLIt's these setups that i do not publish that make it through. But from now I will post set ups that give me 2 affirmations like this one. A triangle and a support zone.
usdcad am i foolish to think like this ??? what would u say if you saw this , whats your view ? block out all the noise and see it
Falling towards 50% Fibonacci support?The Loonie (USD/CAD) is falling towards the pivot which acts as an overlap support that lines up with the 50% Fibonacci retracement and could bounce to the pullback resistance.
Pivot: 1.3651
1st Support: 1.3581
1st Resistance: 1.3735
Risk Warning:
Trading Forex and CFDs carries a high level of risk to your capital and you should only trade with money you can afford to lose. Trading Forex and CFDs may not be suitable for all investors, so please ensure that you fully understand the risks involved and seek independent advice if necessary.
Disclaimer:
The above opinions given constitute general market commentary, and do not constitute the opinion or advice of IC Markets or any form of personal or investment advice.
Any opinions, news, research, analyses, prices, other information, or links to third-party sites contained on this website are provided on an "as-is" basis, are intended only to be informative, is not an advice nor a recommendation, nor research, or a record of our trading prices, or an offer of, or solicitation for a transaction in any financial instrument and thus should not be treated as such. The information provided does not involve any specific investment objectives, financial situation and needs of any specific person who may receive it. Please be aware, that past performance is not a reliable indicator of future performance and/or results. Past Performance or Forward-looking scenarios based upon the reasonable beliefs of the third-party provider are not a guarantee of future performance. Actual results may differ materially from those anticipated in forward-looking or past performance statements. IC Markets makes no representation or warranty and assumes no liability as to the accuracy or completeness of the information provided, nor any loss arising from any investment based on a recommendation, forecast or any information supplied by any third-party.
