Long Idea for USDCADI beleive the USDCAD its in good spot to start rising again. The correction may be over and now I'm looking for a good bounce
Targets:
TP1. 1.37
TP2. 1.38
TP3. 1.40
Good luck
USDCAD trade ideas
USDCAD COT and Liquidity AnalysisHey what up traders welcome to the COT data and Liquidity report. It's always good to go with those who move the market here is what I see in their cards. I share my COT - order flow views every weekend.
🎯 Non Commercials added significant longs and closed shorts at the same time. So for that reason I see the highs as a liquidity for their longs profits taking.
📍Please be aware that institutions report data to the SEC on Tuesdays and data are reported on Fridays - so again we as retail traders have disadvantage, but there is possibility to read between the lines. Remember in the report is what they want you to see, that's why mostly price reverse on Wednesday after the report so their cards are hidden as long as possible. However if the trend is running you can read it and use for your advantage.
💊 Tip
if the level has confluence with the high volume on COT it can be strong support / Resistance.
👍 Hit like if you find this analysis helpful, and don't hesitate to comment with your opinions, charts or any questions.
Analysis done on the Tradenation Charts
Disclosure: I am part of Trade Nation's Influencer program and receive a monthly fee for using their TradingView charts in my analysis.
"Adapt what is useful, reject what is useless, and add what is specifically your own."
— David Perk aka Dave FX Hunter ⚔️

Bullish rise for the Loonie?The price has reacted off the resistance level which is an overlap resistance and could potentially rise from this level to our take profit.
Entry: 1.3703
Why we like it:
There is an overlap resistance level.
Stop loss: 1.3647
Why we like it:
There is an overlap support level.
Take profit: 1.3857
Why we like it:
There is a pullback resistance level that aligns with the 161.8% Fibonacci extension.
Enjoying your TradingView experience? Review us!
Please be advised that the information presented on TradingView is provided to Vantage (‘Vantage Global Limited’, ‘we’) by a third-party provider (‘Everest Fortune Group’). Please be reminded that you are solely responsible for the trading decisions on your account. There is a very high degree of risk involved in trading. Any information and/or content is intended entirely for research, educational and informational purposes only and does not constitute investment or consultation advice or investment strategy. The information is not tailored to the investment needs of any specific person and therefore does not involve a consideration of any of the investment objectives, financial situation or needs of any viewer that may receive it. Kindly also note that past performance is not a reliable indicator of future results. Actual results may differ materially from those anticipated in forward-looking or past performance statements. We assume no liability as to the accuracy or completeness of any of the information and/or content provided herein and the Company cannot be held responsible for any omission, mistake nor for any loss or damage including without limitation to any loss of profit which may arise from reliance on any information supplied by Everest Fortune Group.

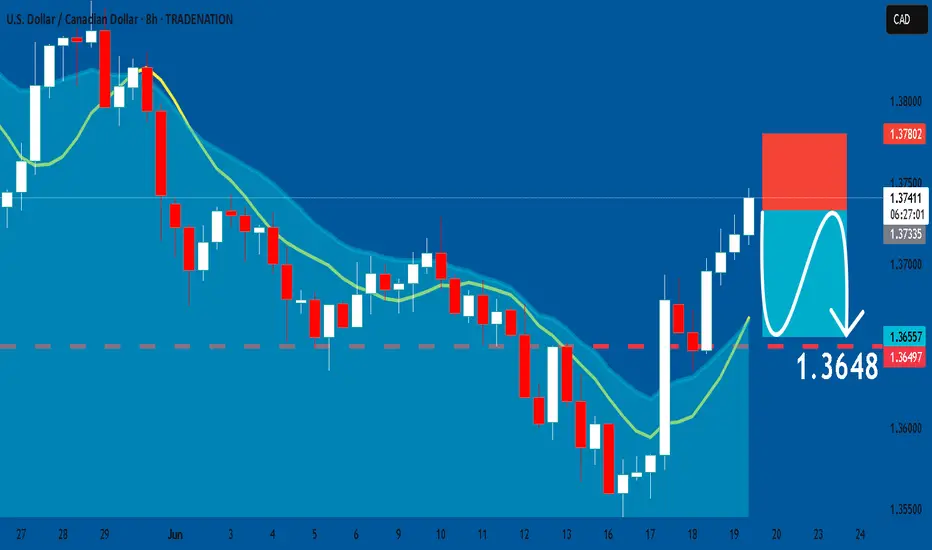
USDCAD: Short Signal Explained
USDCAD
- Classic bearish formation
- Our team expects pullback
SUGGESTED TRADE:
Swing Trade
Short USDCAD
Entry - 1.3734
Sl - 1.3780
Tp - 1.3648
Our Risk - 1%
Start protection of your profits from lower levels
Disclosure: I am part of Trade Nation's Influencer program and receive a monthly fee for using their TradingView charts in my analysis.
❤️ Please, support our work with like & comment! ❤️
UC WAITING GAME Looking to see how price reacts to this recent bearish rally, trend is biased for shorts. However, we can possible start to see price climb, I have a target in mind which is the green resistance (weekly) would like to see break and retest of the Daily (red line) before price continues to the mentioned target.
SHORT ON USD/CADUSD/CAD has given a confirmation choc (change of character) from up to down on the lower timeframe (5min) from a MAJOR supply area.
I will be selling USD/CAD looking to make over 100 pips to the next demand level.

USD/CAD SHORT FROM RESISTANCE
Hello, Friends!
USD/CAD is trending down which is evident from the red colour of the previous weekly candle. However, the price has locally surged into the overbought territory. Which can be told from its proximity to the BB upper band. Which presents a beautiful trend following opportunity for a short trade from the resistance line above towards the demand level of 1.361.
Disclosure: I am part of Trade Nation's Influencer program and receive a monthly fee for using their TradingView charts in my analysis.
✅LIKE AND COMMENT MY IDEAS✅

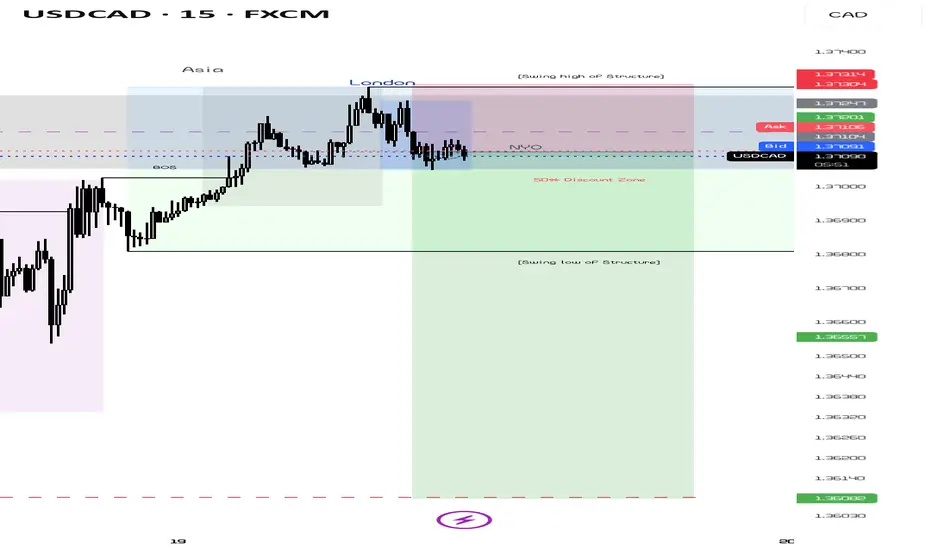
USDCADHere we are currently retesting the Impulsive Wave correction that's currently completed on smaller TF there's a Bearish RSI Divergence indicating the sellers to come in, however if the S/R Flip zone is respected and solid, the buyers will come in as on the chart indicated to perform the corrective "A,B,C" wave with bulls hence we looking to ride with those for that correction.

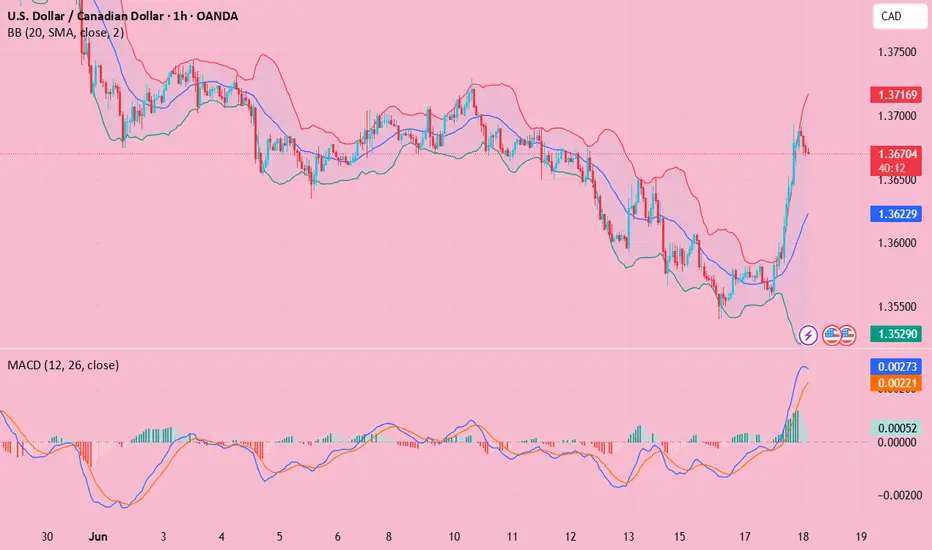
USDCAD early reversal signs📈 USDCAD Analysis – 1H Chart (June 19, 2025)
The USDCAD is showing signs of bullish exhaustion after a strong rally. The price is currently trading around 1.3710, just below the recent local high at 1.37117.
🔹 Bearish Divergence: Price action is forming higher highs, while RSI is forming lower highs — a classic bearish divergence, hinting at potential downside correction.
🔹 Support Zone: A clear demand zone is marked between 1.35800 - 1.36000, which acted as a breakout base and could serve as strong support if the price pulls back.
🔹 Ichimoku Cloud: Price is still trading above the cloud, indicating an ongoing uptrend. However, a potential retest of the cloud support is possible.
🔹 Dynamic Support: The 21 EMA is holding well, and price is currently retesting it.
🔹 RSI: RSI is above 50 but shows decreasing momentum, currently sitting near 59.26 with signal line crossing above at 64.36, suggesting weakening bullish momentum.
📊 Conclusion: The pair is overextended and showing early signs of reversal or correction. A break below the EMA and into the cloud may lead to a pullback toward the highlighted support zone. Watch price action closely for confirmation.

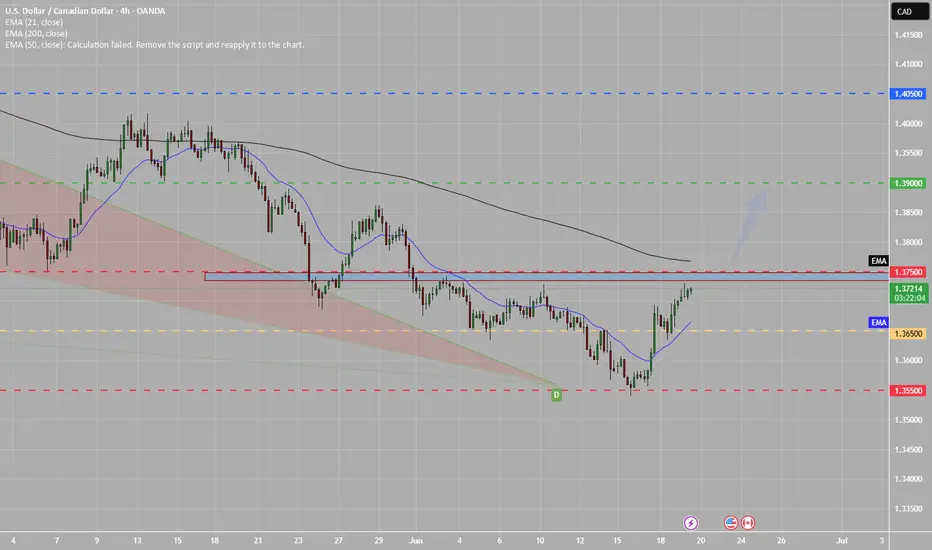
USDCAD SWING TRADE LONG IDEA - MASSIVE BULLISH MOVE COMING?OANDA:USDCAD USDCAD has given a massive bullish break of structure on 4 Hour time frame after tapping to a strong key level on weekly time frame that is serving as support.
Now am bullish on USDCAD for a weekly income swing trading moves.
All I need right now to enter for a long to ride the move is a pull back to key level of support like old highs or imbalance levels.
That is when I will take a bullish long trade on USDCAD.
This is my A+ Trading Setup.
What do you see on your chart?

USDCAD BULLISH USDCAD bullish divergence.
And falling wedge formed which indicates the chances of bullish trend.
this trade active on my accounts but miss the chart published.
Price action Now the market has become a bit tricky usdcad has all the qualities of bearish move liquidity sweep now a sell side entry this trade is a bit risky
Bullish continuation?The Loonie (USD/CAD) is falling towards the pivot which is an overlap support and could bounce to the 1st resistance which is a pullback resistance.
Pivot: 1.3691
1st Support: 1.3666
1st Resistance: 1.3742
Risk Warning:
Trading Forex and CFDs carries a high level of risk to your capital and you should only trade with money you can afford to lose. Trading Forex and CFDs may not be suitable for all investors, so please ensure that you fully understand the risks involved and seek independent advice if necessary.
Disclaimer:
The above opinions given constitute general market commentary, and do not constitute the opinion or advice of IC Markets or any form of personal or investment advice.
Any opinions, news, research, analyses, prices, other information, or links to third-party sites contained on this website are provided on an "as-is" basis, are intended only to be informative, is not an advice nor a recommendation, nor research, or a record of our trading prices, or an offer of, or solicitation for a transaction in any financial instrument and thus should not be treated as such. The information provided does not involve any specific investment objectives, financial situation and needs of any specific person who may receive it. Please be aware, that past performance is not a reliable indicator of future performance and/or results. Past Performance or Forward-looking scenarios based upon the reasonable beliefs of the third-party provider are not a guarantee of future performance. Actual results may differ materially from those anticipated in forward-looking or past performance statements. IC Markets makes no representation or warranty and assumes no liability as to the accuracy or completeness of the information provided, nor any loss arising from any investment based on a recommendation, forecast or any information supplied by any third-party.


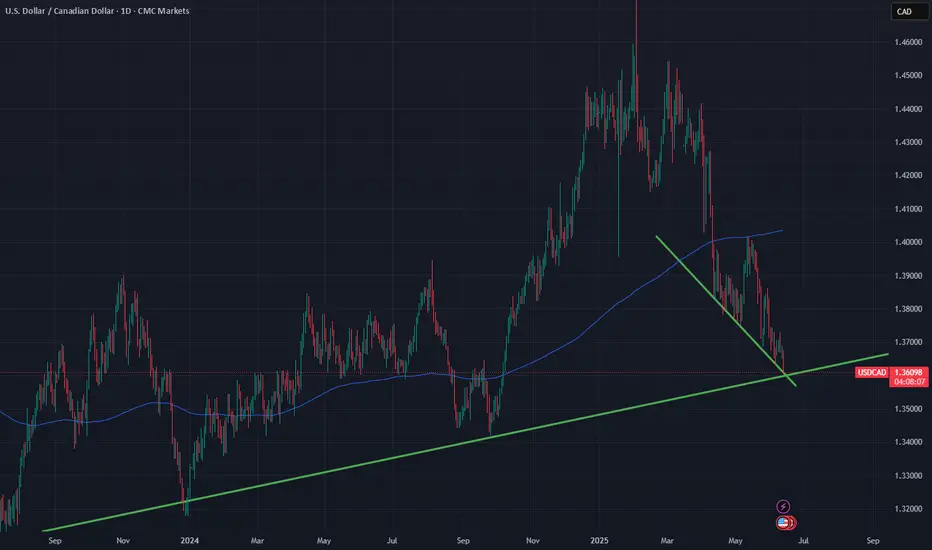
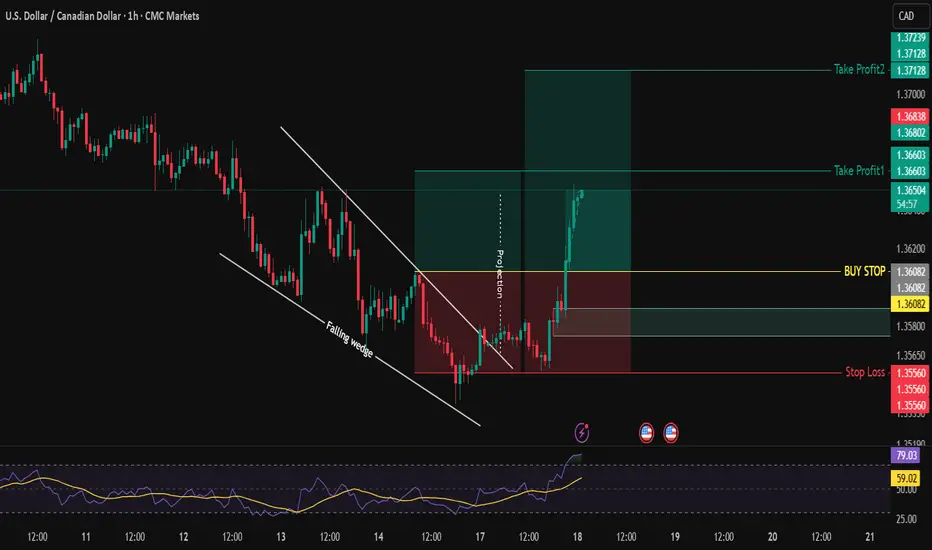
USDCAD – Bullish Reversal After Completed Wave 5 and AO DivergenAnalysis:
The USDCAD daily chart shows a textbook completion of an Elliott Wave 12345 sequence. Wave (5) has just completed, supported by clear bullish divergence on the Awesome Oscillator (AO) – a classic signal suggesting exhaustion of bearish momentum.
What strengthens the bullish reversal bias is the presence of a bullish engulfing candle at the end of Wave (5), right at a key structural low. This candle formation, combined with the divergence, provides strong evidence that a corrective wave (likely Wave A or a larger reversal) may be underway.
🔍 Key Confluences:
Wave 5 ends in a falling wedge structure.
AO shows higher low on Wave 5 compared to Wave 3 → Bullish Divergence.
Bullish engulfing candle confirms momentum shift.
Price action breaking out of the wedge pattern.
🎯 Trade Plan:
I am waiting for a pullback toward the breakout zone to find an optimal buy entry. The ideal entry would be a retest of the bullish engulfing candle low or broken wedge resistance, turning into support.
📈 Targets:
Initial short-term target: ~1.3850 (previous Wave 4 region).
Mid-term potential: ~1.4050 depending on structure development.
🛑 Invalidation:
A daily candle closing back below the low of the bullish engulfing will invalidate the bullish outlook.

USDCAD Wave Analysis – 18 June 2025- USDCAD broke daily down channel
- Likely to rise to the resistance level at 1.3730
USDCAD currency pair recently broke the resistance trendline of the daily down channel from the start of May.
The breakout of this down channel follows the earlier upward reversal from the pivotal support level 1.3545 coinciding with the lower daily Bollinger Band.
USDCAD currency pair can be expected to rise to the next resistance level at 1.3730 (former strong support from May).

USD/cad TRADE 2 even tho i belive this to be in a down trend i still belive a reversal for next couple days is in order i would say wait for in to retrace to a higher level of interest to get in on a short but advanced traders will be waiting for the jump, i have marked the arrows to show u what i belive to happen but a engulfing pattern has already come out, i so i belive this is going to have a little bullish run to then continue on the bearish movment

USD/CAD short 4Hr Supply Zone: I believe that the trade should be triggered in the supple zone I drew out (yellow rectangle)
Market Structure: There is a good market structure formation and I believe that the price will go up to the supply zone then continue the market structure towards the downside.
Fib tool: This is also aligning close to my price trigger and the t/p
Support level: if we go back in time we can see that my t/p is put on a support level (orange dotted line).

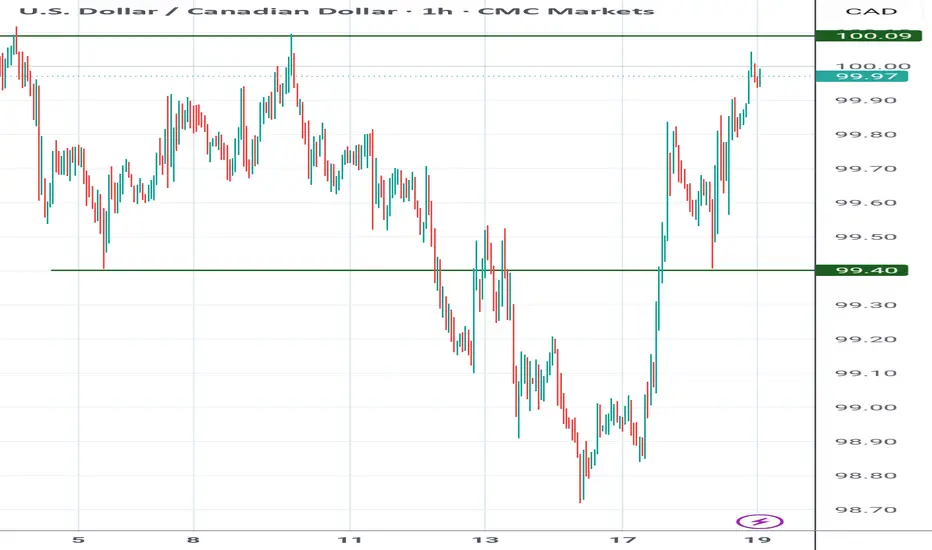
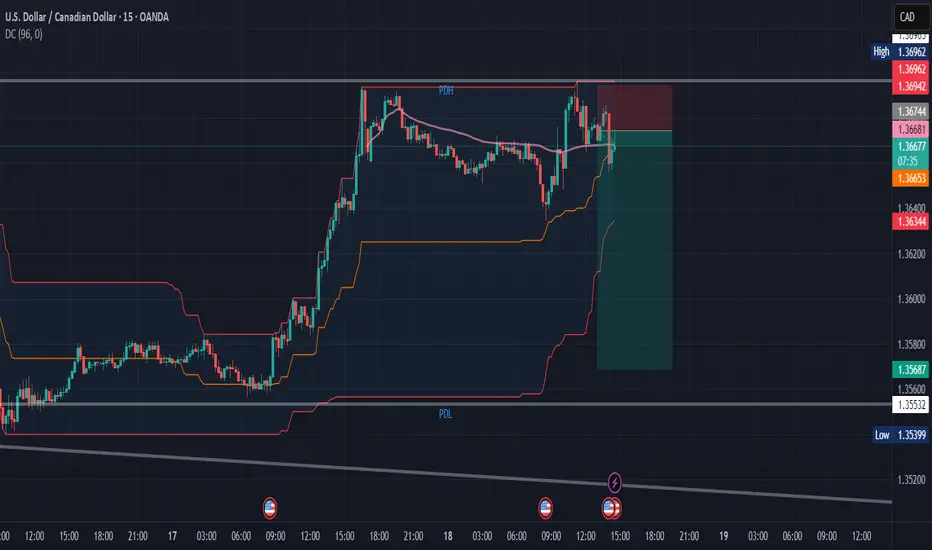
usdcad short to 1.35687stuck in a 1 day downstrend channel since early Februrary
trading at high range of PDH
PD range of 143 pips, expecting more retracement
Bearish reversal for the Loonie?USD/CAD is reacting off the resistance level which is an overlap resistance that lines up with the 50% Fibonacci retracement and could reverse from this level to our take profit.
Entry: 1.3692
Why we lik eit:
There is an overlap resistance level that lines up with the 50% Fibonacci retracement.
Stop loss: 1.3777
Why we like it:
There is a pullback resistance level that is slightly below the 78.6% Fibonacci retracement.
Take profit: 1.3552
Why we like it:
There is a pullback support level.
Enjoying your TradingView experience? Review us!
Please be advised that the information presented on TradingView is provided to Vantage (‘Vantage Global Limited’, ‘we’) by a third-party provider (‘Everest Fortune Group’). Please be reminded that you are solely responsible for the trading decisions on your account. There is a very high degree of risk involved in trading. Any information and/or content is intended entirely for research, educational and informational purposes only and does not constitute investment or consultation advice or investment strategy. The information is not tailored to the investment needs of any specific person and therefore does not involve a consideration of any of the investment objectives, financial situation or needs of any viewer that may receive it. Kindly also note that past performance is not a reliable indicator of future results. Actual results may differ materially from those anticipated in forward-looking or past performance statements. We assume no liability as to the accuracy or completeness of any of the information and/or content provided herein and the Company cannot be held responsible for any omission, mistake nor for any loss or damage including without limitation to any loss of profit which may arise from reliance on any information supplied by Everest Fortune Group.

fomc or fomo?? can trump keep rate down or will powell win? fomc or fomo??
can trump keep rate down or will powell win?
free transparent no edit no delete
🐉We value full transparency. All wins and fails fully publicized, zero edit, zero delete, zero fakes.🐉
🐉Check out our socials for some nice insights.🐉
information created and published doesn't constitute investment advice!
NOT financial advice

USD/CAD(20250618)Today's AnalysisMarket news:
World Gold Council: 95% of central banks expect gold reserves to rise in the next 12 months.
Technical analysis:
Today's buying and selling boundaries:
1.3642
Support and resistance levels:
1.3778
1.3727
1.3694
1.3590
1.3557
1.3506
Trading strategy:
If the price breaks through 1.3694, consider buying, the first target price is 1.3727
If the price breaks through 1.3642, consider selling, the first target price is 1.3590