USDCAD Breakout from Parallel Channel | Bullish Move Ahead?USD/CAD has just broken out of a well-respected downward parallel channel, signaling a potential trend reversal. We saw a strong bullish impulse that pushed price above the channel resistance and now appears to be consolidating just above it.
🔍 What to Watch For:
Pullback Opportunity: Price may retest the breakout zone (~1.3640–1.3660). This zone could act as new support, providing a good entry point for buyers.
Upside Target: The next major resistance sits near 1.38542, offering a potential move of over 180+ pips from current levels.
Momentum: Bullish momentum is strong, suggesting a high probability of continuation after a healthy pullback.
📈 Bullish Bias remains intact as long as price holds above the breakout zone.
📉 If price drops back inside the channel, reevaluation of the bullish outlook will be needed.
🔔 Trade Idea: Look for long opportunities on a successful retest with confirmation (bullish candlestick or volume surge).
💬 What are your thoughts on this breakout? Are you long on USD/CAD or waiting for confirmation? Let me know in the comments! 👇
USDCAD trade ideas

USD/CAD mid-term shift?The rise in the US Dollar Index has led to a rebound against several currencies such as the Canadian dollar, the euro, and the Japanese yen, shifting the medium-term bearish trend into a bullish one. One of the pairs that could benefit from the USD’s strength is the USD/CAD.
After the USD/CAD pair recorded a new high by breaking the last lower high, the recent pullback is considered a correction within the upward trend. The price is likely to rise from the 1.35725 level toward the 1.36567 target.
However, a drop below the 1.35397 level and a 4-hour candle closing beneath it would invalidate the bullish scenario.
Note:
This pair is trading in a general downtrend on the daily timeframe. However, the above analysis is specifically based on the 4-hour chart for the medium-to-short-term outlook.
Markets are also closely watching the Federal Reserve meeting later today, as its outcome will have a direct impact on all USD-related currency pairs.

USDCAD is Nearing The Daily Trend!!Hey Traders, in today's trading session we are monitoring USDCAD for a selling opportunity around 1.36950 zone, USDCAD is trading in a downtrend and currently is in a correction phase in which it is approaching the trend at 1.36950 support and resistance area.
Trade safe, Joe.

Bearish USD/CAD Presents a Selling Opportunity Now.FenzoFx—USD/CAD surged to 1.3686, a resistance zone backed by a bearish Fair Value Gap. Stochastic shows 81.0, signaling short-term overpricing. The market remains bearish below 1.3729, with fundamentals pointing to a stronger CAD.
A decline toward 1.362 is likely if USD/CAD stays below 1.3729.

Bearish reversal off pullback resistance?The Loonie (USD/CAD) is rising towards the pivot which is a pullback resistance that aligns with the 50% Fibonacci retracement and could reverse to the 1st support.
Pivot: 1.3706
1st Support: 1.3599
1st Resistance: 1.3793
Risk Warning:
Trading Forex and CFDs carries a high level of risk to your capital and you should only trade with money you can afford to lose. Trading Forex and CFDs may not be suitable for all investors, so please ensure that you fully understand the risks involved and seek independent advice if necessary.
Disclaimer:
The above opinions given constitute general market commentary, and do not constitute the opinion or advice of IC Markets or any form of personal or investment advice.
Any opinions, news, research, analyses, prices, other information, or links to third-party sites contained on this website are provided on an "as-is" basis, are intended only to be informative, is not an advice nor a recommendation, nor research, or a record of our trading prices, or an offer of, or solicitation for a transaction in any financial instrument and thus should not be treated as such. The information provided does not involve any specific investment objectives, financial situation and needs of any specific person who may receive it. Please be aware, that past performance is not a reliable indicator of future performance and/or results. Past Performance or Forward-looking scenarios based upon the reasonable beliefs of the third-party provider are not a guarantee of future performance. Actual results may differ materially from those anticipated in forward-looking or past performance statements. IC Markets makes no representation or warranty and assumes no liability as to the accuracy or completeness of the information provided, nor any loss arising from any investment based on a recommendation, forecast or any information supplied by any third-party.

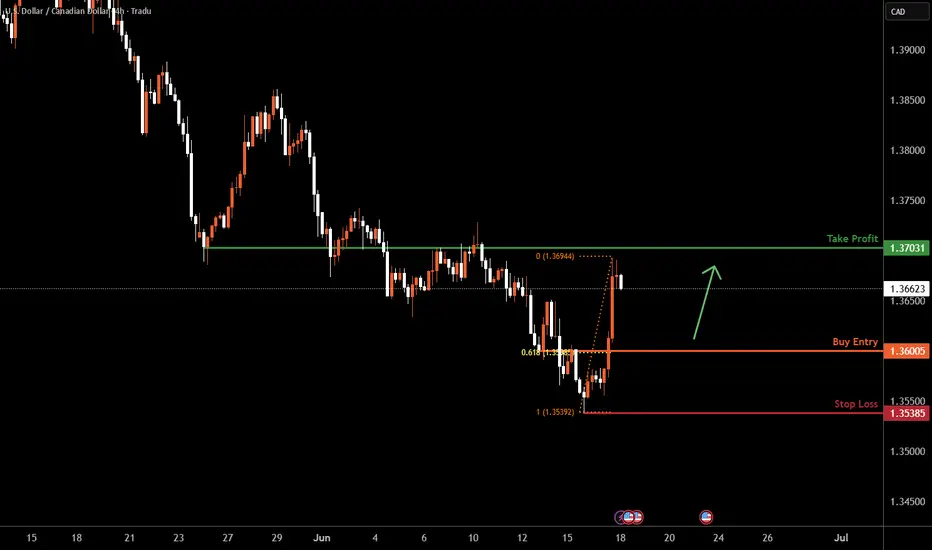
USDCAD H4 I Bullish Bounce Off the supportBased on the H4 chart analysis, the price is falling toward our buy entry level at 1.3600, a pullback support that aligns with the 61.8% Fib retracement.
Our take profit is set at 1.3703, a pullback resistance.
The stop loss is placed at 1.3500, a swing low
High Risk Investment Warning
Trading Forex/CFDs on margin carries a high level of risk and may not be suitable for all investors. Leverage can work against you.
Stratos Markets Limited (tradu.com ):
CFDs are complex instruments and come with a high risk of losing money rapidly due to leverage. 63% of retail investor accounts lose money when trading CFDs with this provider. You should consider whether you understand how CFDs work and whether you can afford to take the high risk of losing your money.
Stratos Europe Ltd (tradu.com ):
CFDs are complex instruments and come with a high risk of losing money rapidly due to leverage. 63% of retail investor accounts lose money when trading CFDs with this provider. You should consider whether you understand how CFDs work and whether you can afford to take the high risk of losing your money.
Stratos Global LLC (tradu.com ):
Losses can exceed deposits.
Please be advised that the information presented on TradingView is provided to Tradu (‘Company’, ‘we’) by a third-party provider (‘TFA Global Pte Ltd’). Please be reminded that you are solely responsible for the trading decisions on your account. There is a very high degree of risk involved in trading. Any information and/or content is intended entirely for research, educational and informational purposes only and does not constitute investment or consultation advice or investment strategy. The information is not tailored to the investment needs of any specific person and therefore does not involve a consideration of any of the investment objectives, financial situation or needs of any viewer that may receive it. Kindly also note that past performance is not a reliable indicator of future results. Actual results may differ materially from those anticipated in forward-looking or past performance statements. We assume no liability as to the accuracy or completeness of any of the information and/or content provided herein and the Company cannot be held responsible for any omission, mistake nor for any loss or damage including without limitation to any loss of profit which may arise from reliance on any information supplied by TFA Global Pte Ltd.
The speaker(s) is neither an employee, agent nor representative of Tradu and is therefore acting independently. The opinions given are their own, constitute general market commentary, and do not constitute the opinion or advice of Tradu or any form of personal or investment advice. Tradu neither endorses nor guarantees offerings of third-party speakers, nor is Tradu responsible for the content, veracity or opinions of third-party speakers, presenters or participants.
USD/CAD Faces Rejection at 1.3692 – Downside Risk Toward 1.3597
USD/CAD was rejected at the key resistance zone between 1.36670 and 1.36928, and has since begun pulling back. This reaction comes as price remains within a broader descending channel.
If the bearish momentum continues, the next levels to watch on the downside are 1.36347, followed by 1.35970. A break below those could open the path toward the major support at 1.35402.
🔻 Rejection Zone: 1.36670 – 1.36928
🔻 Support 1: 1.36347
🔻 Support 2: 1.35970
🔻 Support 3: 1.35402
🔻 Trend: Bearish within descending channel
🔻 Timeframe: 4H
This is a technical idea only – not financial advice.

USD/CAD: Signs of a bottom as bulls fight backTuesday’s bullish move in USD/CAD has delivered a signal often seen at bottoms, taking out several key technical resistance levels in the process, including the December 2023 uptrend. With bearish momentum starting to reverse, upside risks look to be building.
Those in the market for a long setup could initiate positions around these levels with a stop beneath 1.3650 for protection. Tuesday’s high of 1.3693 now stands as an important near-term level. A break above opens the door to the June 10 high at 1.3728 as one potential target, along with 1.3750.
If either level is hit, reevaluate whether to hold, cut or reverse, given the setup runs counter to the broader trend.
Good luck!
DS

USDCAD SHORT IDEA- USDCAD Is EXTREMELY WEAK AND READY FOR SELLOANDA:USDCAD USDCAD Is extremely weak I expect price to drop hard from here.
TRADE BREAKDOWN
Weekly Trend is Bearish.
Daily Trend is Bearish.
4H Trend is also Bearish.
This is 100% a trend following strategy trade.
The entry is taken on 4H time frame targeting the recent weekly swing low.
This is a 4RR Trade.

USDCAD - Strong SellStrong Sell under 200 moving average and 100 moving average. OIL prices will rise due to middle east conflict. Which will increase the price of CAD expecting around .74 cents or higher with full support.
USDCAD POTENTIAL LONG OPPORTUNITY...HISTORY REPEATS ITSELFHey hey TradingView fam! It has been a minute (more like months lol) since I've done a post on here for you guys so just wanted to come on and drop an potential swing trade opportunity I see on the USDCAD currency pair! So let's get straight to it
OK so it is pretty straight forward (at least in my eyes) but as you can see on the chart USDCAD is coming into a weekly demand zone. IF you are unfamiliar with what a "demand zone" is it is actually very simple. Think of it this way...a buyer zone/area. Literally simple as that. It is a previous zone that a buyer was interested in before. How do we know that? One of the most incredible thing about the charts is that it is like a receipt. It shows the transactions that have taken place.
SO...when we look left back @ the 1.3600 price handle we can see that there was aggressive buying that took place here. How do we know? THE CHART LITERALLY ROSE/SKYROCKETED FROM THIS LEVEL. Ever heard of the phrase history repeats itself? It is ESPECIALLY true in the markets!
OK so hopefully you guys got some nuggets from this post was more of a psychological breakdown than anything but truly want to help those of you who may see the charts as this complicated phenomena to realize that it is actually so so simple. And my main goal is to make trading simple again.
Love & appreciate you all! Thanks for tuning in! If you found some value in this please boost this post & follow my page for accurate analysis and simple trading! Cheers!

BUY USDCADIn todays session we are anticipating a bullish dollar. Our entry for buys on USDCAD are at 1.35728 our targets are 1.36484 and stops below 1.35535. Use proper risk management. Stay safe

USD/CADAGAIN USD CAD TO hit resitance level ready for a reversal to carry on in the bearish if breakout occurs on either end we would look to follow but i always advice go with the trend

USDCAD for short*The content on this analysis is subject to change at any time without notice, and is provided for the sole purpose of assisting traders to make independent investment decisions.

Potential bullish rise?USD/CAD has reacted off the resistance level and could rise from this level to our take profit.
Entry: 1.3603
Why we like it:
There is a pullback resistance level.
Stop loss: 1.3540
Why we like it:
There is a pullback support level.
Take profit: 1.3704
Why we like it:
There is an overlap resistance level that lines up with the 50% Fibonacci retracement.
Enjoying your TradingView experience? Review us!
Please be advised that the information presented on TradingView is provided to Vantage (‘Vantage Global Limited’, ‘we’) by a third-party provider (‘Everest Fortune Group’). Please be reminded that you are solely responsible for the trading decisions on your account. There is a very high degree of risk involved in trading. Any information and/or content is intended entirely for research, educational and informational purposes only and does not constitute investment or consultation advice or investment strategy. The information is not tailored to the investment needs of any specific person and therefore does not involve a consideration of any of the investment objectives, financial situation or needs of any viewer that may receive it. Kindly also note that past performance is not a reliable indicator of future results. Actual results may differ materially from those anticipated in forward-looking or past performance statements. We assume no liability as to the accuracy or completeness of any of the information and/or content provided herein and the Company cannot be held responsible for any omission, mistake nor for any loss or damage including without limitation to any loss of profit which may arise from reliance on any information supplied by Everest Fortune Group.

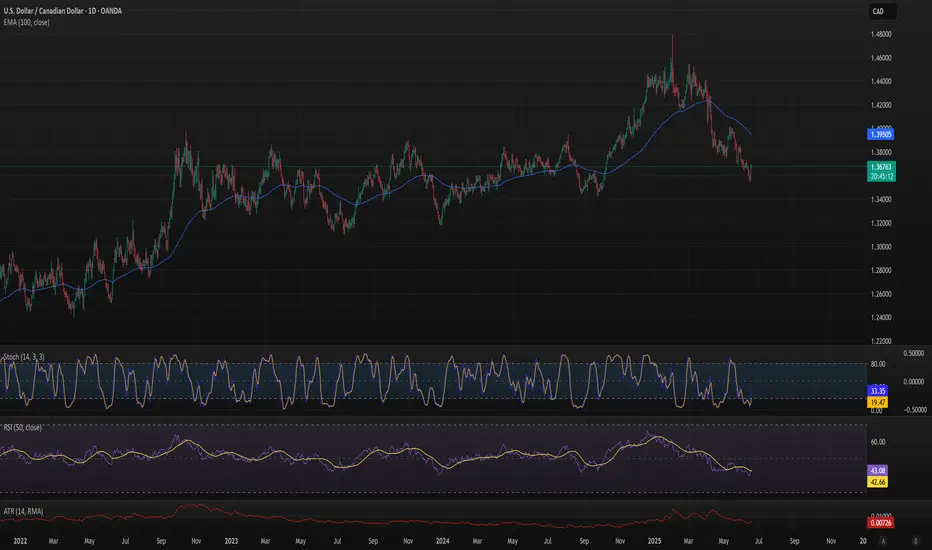
The chart showcases the U.S. Dollar (USD) to Canadian Dollar (CAThe price has risen steadily from a low of 1.31512 since early 2024, peaking at 1.47931, with the 200-day EMA (orange line) providing strong support since December 2024. I expect the price to potentially test the resistance around 1.38812 again if the upward momentum continues.
The focus is on the 200-day EMA as a key support level

USDCAD LONG FORECAST Q2 W25 D17 Y25 12:18 GMT UPDATEUSDCAD LONG FORECAST Q2 W25 D17 Y25 12:18 GMT UPDATE
Professional Risk Managers👋
Welcome back to another FRGNT chart update📈
Diving into some Forex setups using predominantly higher time frame order blocks alongside confirmation breaks of structure.
💡Here are some trade confluences📝
✅1H order block
✅HTF 50 EMA
✅Intraday bullish breaks of structure to be identified
✅15’ order block identified
🔑 Remember, to participate in trading comes always with a degree of risk, therefore as professional risk managers it remains vital that we stick to our risk management plan as well as our trading strategies.
📈The rest, we leave to the balance of probabilities.
💡Fail to plan. Plan to fail.
🏆It has always been that simple.
❤️Good luck with your trading journey, I shall see you at the very top.
🎯Trade consistent, FRGNT X

USD/ CAD Trade plan ???From the chart level you can plan sell if price come to our selling area . then after 5min coch or 15 min red candle

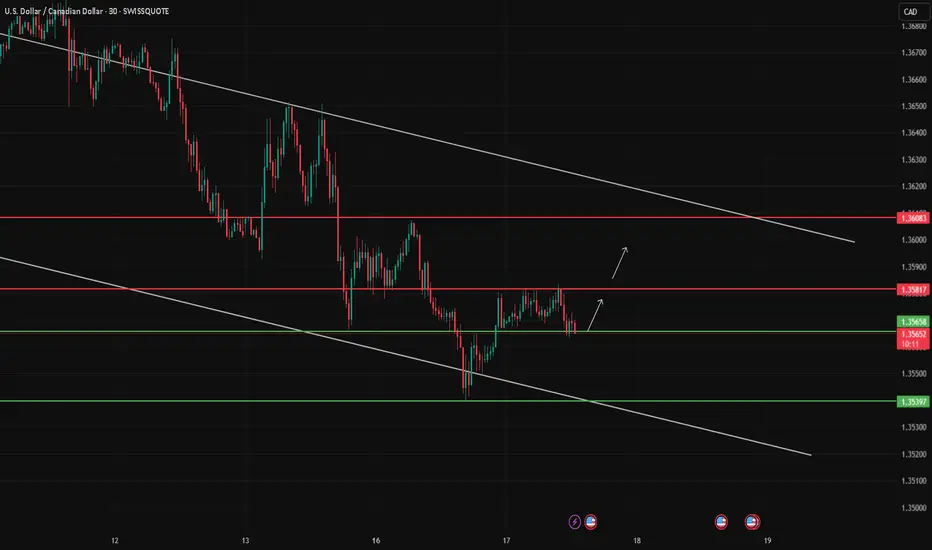
USD/CAD Holding Minor Support
USD/CAD is consolidating above local support at 1.35658, within a descending channel. A bullish break from this tight range could trigger a move toward the next resistance levels at 1.35817 and 1.36083.
A confirmed break and hold above 1.35817 would be the first signal of short-term strength.
However, a drop below 1.35658 could invalidate the bullish scenario and send price back to 1.35397 support.
Oil Rises, Canadian Yields Surge: Can USD/CAD Rebound?USDCAD 17/06 – Oil Rises, Canadian Yields Surge: Can USD/CAD Rebound?
After a significant drop to the 1.355x area, USD/CAD is showing early signs of recovery. However, the pair remains influenced by strong macro headwinds—particularly oil prices and Canadian monetary policy signals.
🌐 Macro & Sentiment Overview
WTI crude oil is rising due to ongoing tensions between Israel and Iran, which increase the risk of global supply disruptions. This supports the Canadian Dollar (CAD) as a commodity-linked currency.
Canada’s 10-year bond yields have reached their highest levels in 5 months (~3.4%), reinforcing expectations that the BoC may remain hawkish in the near term.
USD weakens slightly as traders await more clarity from the Federal Reserve about the next rate cut timeline, potentially in Q3.
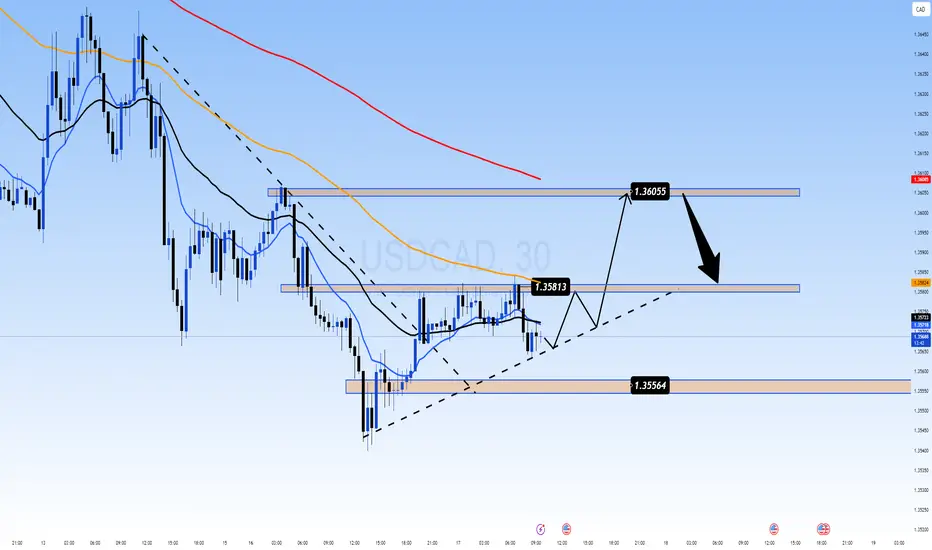
📊 Technical Analysis (M30 Chart)
Price is printing higher lows above the key trendline.
EMAs 13–34–89 are tightening → sign of sideways pressure before breakout.
Short-term bullish channel still intact.
Key resistance zones: 1.3581 and 1.3605.
🎯 Trade Setup Scenarios
📈 Long Scenario
Entry: 1.3556 – 1.3560 (trendline bounce)
Stop Loss: 1.3535
Take Profits: 1.3581 → 1.3605
✅ Wait for M30/H1 confirmation like bullish engulfing or price-action breakout.
📉 Short Scenario
Entry: 1.3605 (if price rejects resistance)
Stop Loss: 1.3630
Take Profits: 1.3581 → 1.3556
⚠️ Trigger only on bearish rejection with strong candle and volume at resistance.
📌 Strategic Outlook
USD/CAD is caught in a tug-of-war: stronger Canadian fundamentals (oil + yields) vs. cautious USD movement post-FOMC. If oil prices and Canadian yields continue to climb, CAD may remain in favor. However, short-term technical rebounds toward 1.3600 remain valid if price structure holds.
USD/CAD)) Bearish Trand analysis Read The captionSMC trading point update
Technical analysis of USD/CAD on the 3-hour timeframe, using Smart Money Concepts (SMC) and classic technical analysis. Here's a breakdown
---
Key Technical Insights:
Overall Trend:
The pair is in a clear downtrend, confirmed by:
Lower highs and lower lows
Price trading below the 200 EMA (currently at 1.37402)
Respect for the downtrend channel
---
Resistance Zones:
1. Upper Resistance Zone (~1.38400 – 1.38750):
Strong historical sell area (price sharply reversed here in late May)
2. Mid Resistance Zone (~1.36450 – 1.36750):
Price reacted twice here and dropped.
Aligns with the downtrend line and was recently tested again (red arrow).
---
Bearish Projections:
After the latest pullback into the resistance zone, price is expected to:
Reject the zone
Continue following the descending structure
Target marked around 1.35034, which coincides with:
Previous low
Lower boundary of the descending channel
Mr SMC Trading point
---
Chart Tools & Features Used:
Trendlines: Clearly marking the downtrend channel
200 EMA: Used as dynamic resistance
Fib-like measured move: Mirrored previous impulse moves (-1.61%) suggesting a symmetric drop
Arrows: Indicating reaction points from resistance
---
Conclusion:
Bias: Bearish
Invalidation: Break and hold above 1.36500 would weaken the bearish outlook.
Next Move: Potential sell setups on lower timeframe retests or bearish confirmations within the resistance zone.
Please support boost 🚀 this analysis)

USD/CAD) Bearish trand analysis Read The captionSMC trading point update
Technical analysis of USD/CAD on the 3-hour timeframe reflects a bearish market outlook. Here’s a breakdown of the idea:
---
Trend Overview:
The pair is in a clear downtrend, confirmed by:
Lower highs and lower lows
Price trading below the 200 EMA
A bearish flag pattern in play
---
Key Zones & Levels:
1. Resistance Zones (Yellow boxes):
Upper zone (~1.3835 area): Previously tested and rejected (marked by the red arrow).
Mid-zone (~1.3745 area): Labeled as a resistance level, previously support turned resistance.
2. Support Zone:
The price is heading toward a projected target point at ~1.35584, which aligns with previous support.
---
Bearish Confirmation:
The price attempted a retracement but failed to break above the resistance level.
The structure shows a bearish continuation pattern, suggesting a move downward is likely.
---
Indicators:
RSI (Relative Strength Index):
Currently near 37, not oversold yet, but suggests bearish momentum is still strong.
Also shows slight bearish divergence (lower highs on RSI while price was consolidating).
---
Projection/Trade Idea:
Scenario: Break and retest of the current level (~1.3679), with a continuation to the target at 1.35584.
Risk Areas: Any break above 1.3745 could invalidate the setup.
Confirmation: A clean bearish candle below the minor support could confirm entry for short sellers.
Mr SMC Trading point
---
Summary:
This is a supply-and-demand + structure-based bearish setup. The market is showing weakness below resistance, and the next logical target is 1.35584, barring any macroeconomic reversal (e.g., USD or CAD news).
Please support boost 🚀 this analysis)

USDCAD Bearish Bias: Beware Liquidity Traps & Reversal Risks.I'm currently keeping a close eye on USDCAD, which has been in a strong bearish trend. 📉
In this video, I explain how the market is unfolding across both the higher and lower timeframes, and why it’s critical to watch them in conjunction. On the lower timeframes, we often see a clean sequence of lower highs and lower lows, as the algos set up a seemingly a smooth trend. But traders should be cautious ⚠️
Why? Because on the higher timeframes, the market can easily pull back, triggering a liquidity hunt. This is often when the algorithm targets stop orders above recent highs, before resuming the trend 🧠💥
While my bias remains bearish, I'm also aware of the risk that the market could shift gears unexpectedly to run stops and shake out weak hands. This concept is fully broken down in the video — with examples of how to spot these traps and prepare accordingly 🎯
