USDCAD / U.S. Dollar – Canadian Dollar (4H) – ABC Bearish PatterUSDCAD / U.S. Dollar – Canadian Dollar (4H) – ABC Bearish Pattern Completion at PCZ
Pattern Overview:
Pattern Type: ABC Bearish (Potential Reversal)
Asset: USDCAD
Timeframe: 4H
Trade Type: Short Bias – Rejection observed near PCZ zone
🔎 Key Levels
XA: 1.37880 → 1.35574
AB: 1.35574 → 1.37742
BC: Completed right into the PCZ, aligning with 127.2% and 161.8% projection zones
Rejection confirmed below 1.3774, entering pullback
📐 Fibonacci Extensions & Key Ratios
127.2% Projection: 1.37368
161.8% Extension: 1.37855
Retracement Target Zone (PCZ/Support):
50.0% = 1.36842
61.8% = 1.36629
💡 Price Action & Setup
The price has completed a textbook ABC structure into a confluence projection zone (PCZ), showing signs of exhaustion at 1.3774. This area aligns with a previous swing high and fib confluence, now acting as resistance.
The first leg of the pullback is underway, and momentum is favoring a deeper move toward the 1.3680 – 1.3660 PCZ, which aligns with key fibs and 200 SMA support.
🧠 Market Sentiment
DXY consolidating near highs – potential exhaustion
Crude oil stabilizing supports CAD
CAD correlation is enhancing bearish weight on this pair post-ABC
📊 Next Potential Movement
Targeting the 1.3680–1.3660 support cluster
If PCZ fails to hold on any retest → potential continuation down toward 1.3600 swing
Resistance to watch: 1.3737–1.3750 (any candle close above this weakens setup)
🛡 Risk Management
Short entries from the 1.3760–1.3770 area are valid
Stop-loss ideally above 1.3790 (beyond 161.8%)
Scaling out near 1.3680 and 1.3660, both technical targets and 200 SMA confluence
📌 Conclusion
Price completed a high-probability ABC Bearish structure and is now reacting from a strong confluence zone. While confirmation is still unfolding, momentum favors downside, and all eyes are on the next leg toward the PCZ support range.
“Bearish patterns are warnings, not guarantees. But confluence zones give them authority.”
USDCAD trade ideas

USDCAD BUYLooking for USDCAD to push lower and activate orders underneath the daily swing low that is highlighted.
To have an entry we are looking to approach and take low in a corrective manner, to form the first 15minute swing low after taking the zone and then to push down one last time to activate more buy orders before pushing up to the high of the first consolidation highlighted on the chart.
Must see CVD absorption once the low is taken before looking for a 1 minute reversal for the entry.
Stoploss below what will be the newly formed low (allow 3 pips below this)

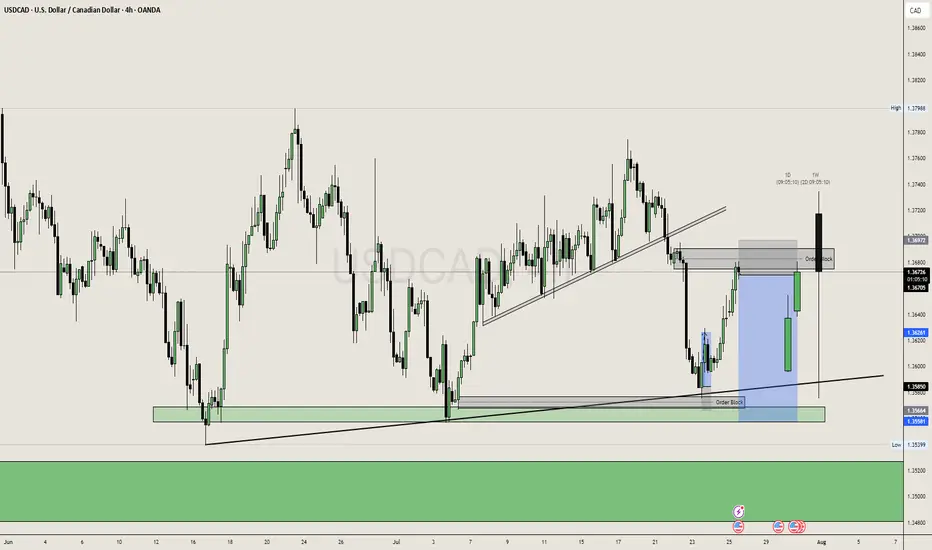
USCAD Q3 | D23 | W30 | Y25📊USCAD Q3 | D23 | W30 | Y25
Daily Forecast🔍📅
Here’s a short diagnosis of the current chart setup 🧠📈
Higher time frame order blocks have been identified — these are our patient points of interest 🎯🧭.
It’s crucial to wait for a confirmed break of structure 🧱✅ before forming a directional bias.
This keeps us disciplined and aligned with what price action is truly telling us.
📈 Risk Management Protocols
🔑 Core principles:
Max 1% risk per trade
Only execute at pre-identified levels
Use alerts, not emotion
Stick to your RR plan — minimum 1:2
🧠 You’re not paid for how many trades you take, you’re paid for how well you manage risk.
🧠 Weekly FRGNT Insight
"Trade what the market gives, not what your ego wants."
Stay mechanical. Stay focused. Let the probabilities work.
FRGNT

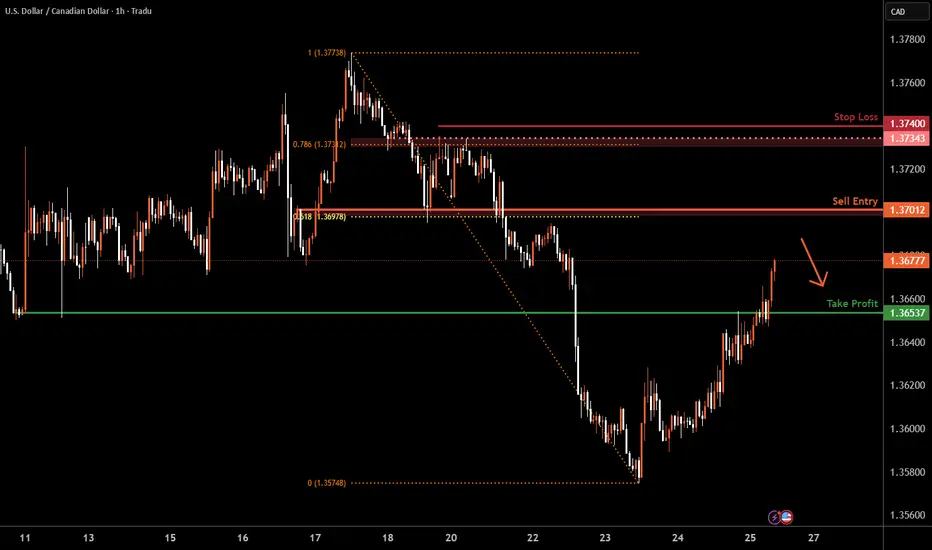
USD/CAD H4 | Potential bearish reversalUSD/CAD is rising towards an overlap resistance and could potentially reverse off this level to drop lower.
Sell entry is at 1.3701 which is an overlap resistance that aligns with the 61.8% Fibonacci retracement.
Stop loss is at 1.3740 which is a level that sits above the 78.6% Fibonacci retracement and an overlap resistance.
Take profit is at 1.3653 which is a pullback support.
High Risk Investment Warning
Trading Forex/CFDs on margin carries a high level of risk and may not be suitable for all investors. Leverage can work against you.
Stratos Markets Limited (tradu.com ):
CFDs are complex instruments and come with a high risk of losing money rapidly due to leverage. 66% of retail investor accounts lose money when trading CFDs with this provider. You should consider whether you understand how CFDs work and whether you can afford to take the high risk of losing your money.
Stratos Europe Ltd (tradu.com ):
CFDs are complex instruments and come with a high risk of losing money rapidly due to leverage. 66% of retail investor accounts lose money when trading CFDs with this provider. You should consider whether you understand how CFDs work and whether you can afford to take the high risk of losing your money.
Stratos Global LLC (tradu.com ):
Losses can exceed deposits.
Please be advised that the information presented on TradingView is provided to Tradu (‘Company’, ‘we’) by a third-party provider (‘TFA Global Pte Ltd’). Please be reminded that you are solely responsible for the trading decisions on your account. There is a very high degree of risk involved in trading. Any information and/or content is intended entirely for research, educational and informational purposes only and does not constitute investment or consultation advice or investment strategy. The information is not tailored to the investment needs of any specific person and therefore does not involve a consideration of any of the investment objectives, financial situation or needs of any viewer that may receive it. Kindly also note that past performance is not a reliable indicator of future results. Actual results may differ materially from those anticipated in forward-looking or past performance statements. We assume no liability as to the accuracy or completeness of any of the information and/or content provided herein and the Company cannot be held responsible for any omission, mistake nor for any loss or damage including without limitation to any loss of profit which may arise from reliance on any information supplied by TFA Global Pte Ltd.
The speaker(s) is neither an employee, agent nor representative of Tradu and is therefore acting independently. The opinions given are their own, constitute general market commentary, and do not constitute the opinion or advice of Tradu or any form of personal or investment advice. Tradu neither endorses nor guarantees offerings of third-party speakers, nor is Tradu responsible for the content, veracity or opinions of third-party speakers, presenters or participants.
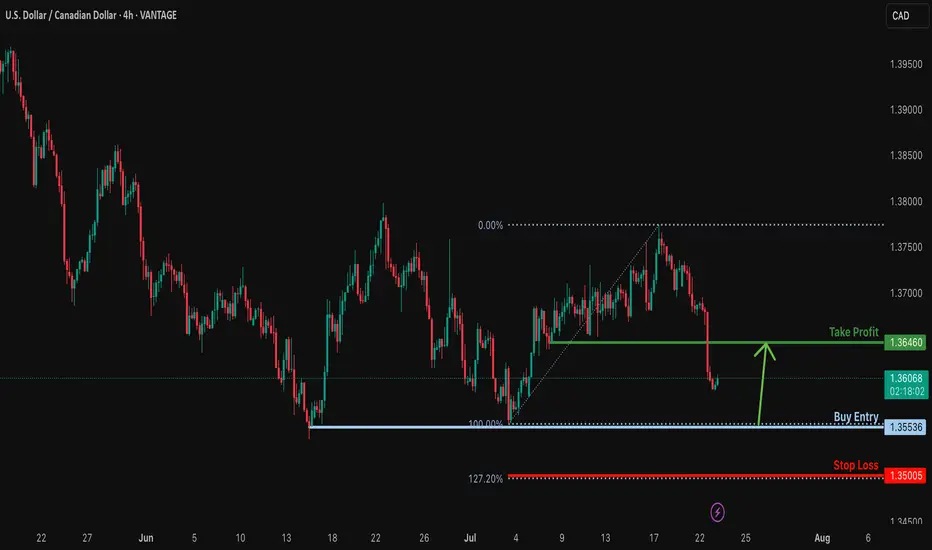
Bullish reversal?USD/CAD is faalling towards the support level which is a multi swing low support and could bounce from this level to our take profit.
Entry: 1.3553
Why we like it:
There is a multi swing low support.
Stop loss: 1.3500
Why we like it:
There is a support at the 127.2% Fibonacc extension.
Take profit: 1.3646
Why we like it:
There is a pullback resistance.
Enjoying your TradingView experience? Review us!
Please be advised that the information presented on TradingView is provided to Vantage (‘Vantage Global Limited’, ‘we’) by a third-party provider (‘Everest Fortune Group’). Please be reminded that you are solely responsible for the trading decisions on your account. There is a very high degree of risk involved in trading. Any information and/or content is intended entirely for research, educational and informational purposes only and does not constitute investment or consultation advice or investment strategy. The information is not tailored to the investment needs of any specific person and therefore does not involve a consideration of any of the investment objectives, financial situation or needs of any viewer that may receive it. Kindly also note that past performance is not a reliable indicator of future results. Actual results may differ materially from those anticipated in forward-looking or past performance statements. We assume no liability as to the accuracy or completeness of any of the information and/or content provided herein and the Company cannot be held responsible for any omission, mistake nor for any loss or damage including without limitation to any loss of profit which may arise from reliance on any information supplied by Everest Fortune Group.
Possibility of correction As long as the price does not stabilize above the green resistance area, there is a possibility of a trend change and the start of a downtrend.

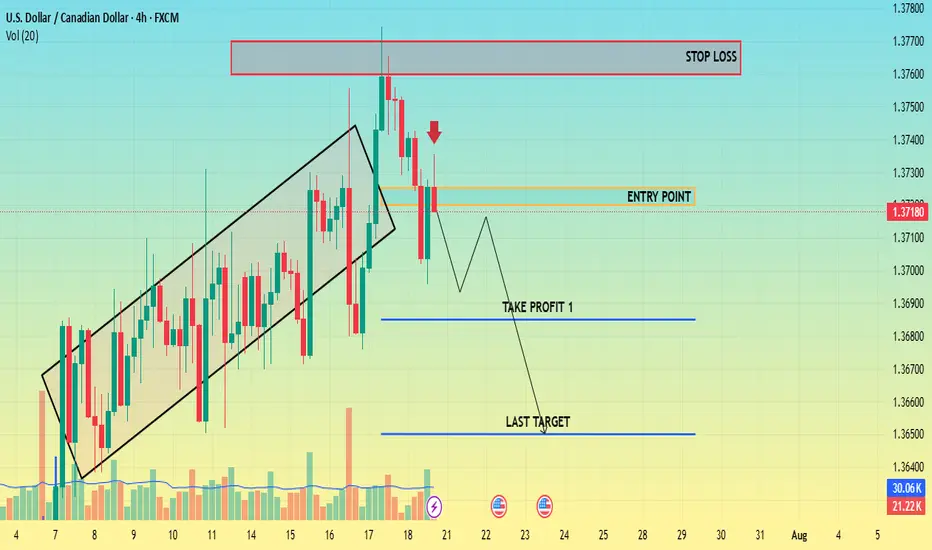
CHECK USDCAD SIGNAL READ CAPTAINShort (sell)
Entry Point: Around 1.37250 1.37200
Stop Loss: Around 1.37700
🎯 Target Levels
Take Profit 1:
1.36850
Take Profit 2:
1.36500
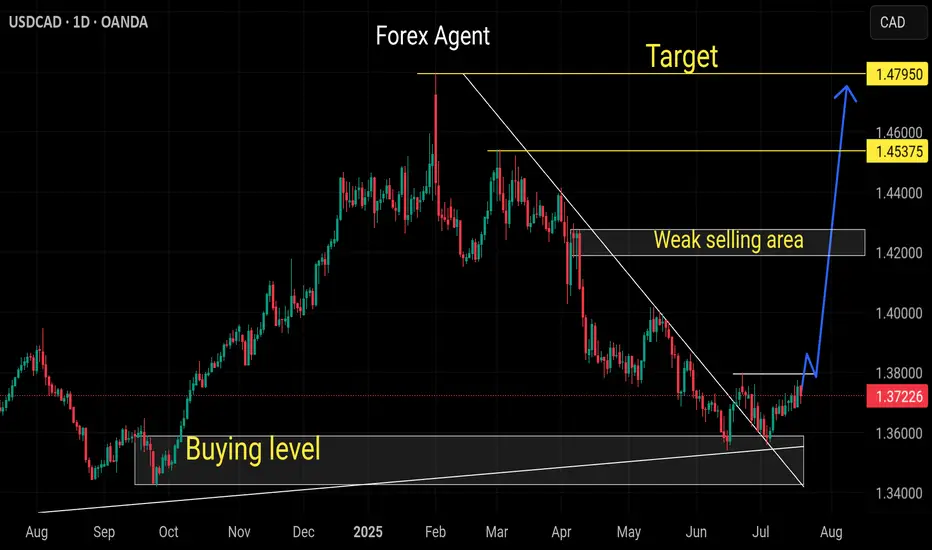
Buying usdcadUsdcad completed its bearish wave now ready for the bullish correction
Daily sell trend already breaks and Candel close above the sell trend
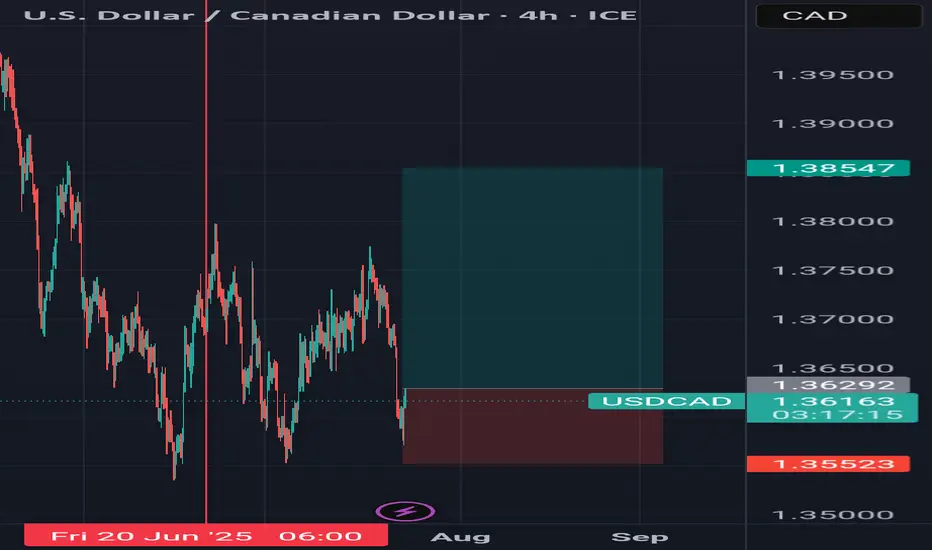
USDCAD Sell Move PossibleAs USDCAD is in Downtrend, we can expect a sell side move from this OB in NY Session towards low SSL.
Friday Closing also coming near so plan trade accordingly.
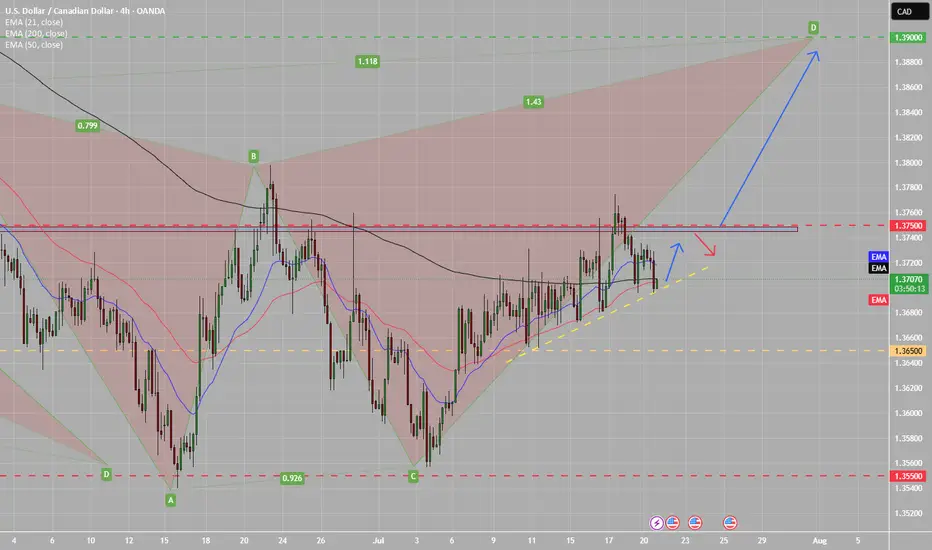
UC BULLISH C-D HARMONIC PATTERN Looking for price to finally break above the daily resistance for price to start a bullish rally towards Weekly resistance marked in green.
Buy usdcad Buy usdcad and gbpcad. You can set tp 1 at 1.37. Feel free to add Eurcad if daily candle closes as bullish on IDC chart. I'll keep you updated
USDCAD(20250721)Today's AnalysisMarket news:
Waller refused to comment on whether he would dissent at the July meeting, saying that the private sector was not performing as well as people thought, and said that if the president asked him to be the chairman of the Federal Reserve, he would agree.
Technical analysis:
Today's buying and selling boundaries:
1.3725
Support and resistance levels:
1.3785
1.3763
1.3748
1.3702
1.3687
1.3665
Trading strategy:
If the price breaks through 1.3725, consider buying, and the first target price is 1.3748
If the price breaks through 1.3702, consider selling, and the first target price is 1.3687

USDCAD SELL TRADEOpportunity to sell on USDCAD
ENTRY: 1.36800
STOP LOSS: 1.37000
TAKE PROFIT: 1.36100
Note: Higher Timeframe Zone level
Support turn to Resistance
Comment your opinion pls.
For Account Management. Contact me on X @shajudeakinoba1 Good Proift Splitting


USDCAD about to Burst soon!Consolidating in 1H and 30M.
Maybe something big is going to happen during the London Session.
We wait for a nice bearish candle to enter. Also, it will be nice to see price go below the blue line drawn, as it will give us further confirmation about the downwards move.
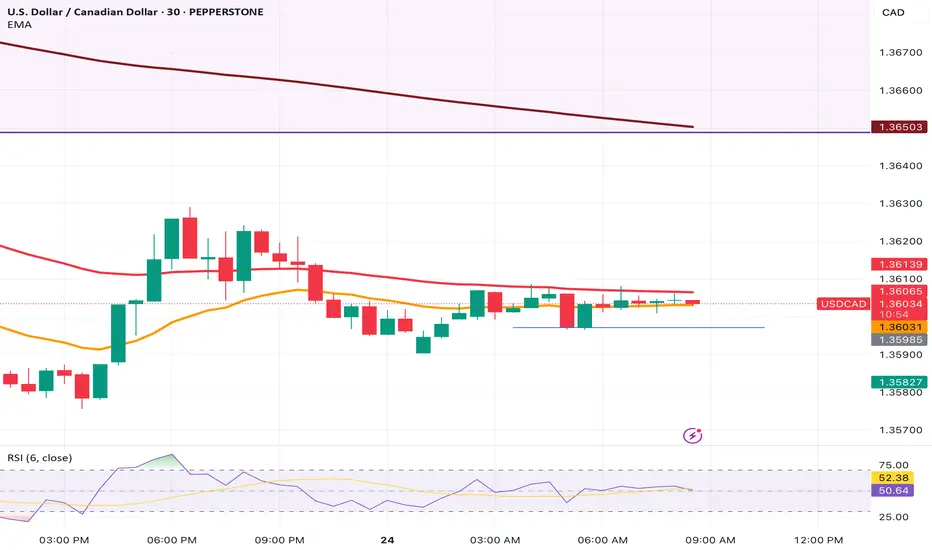
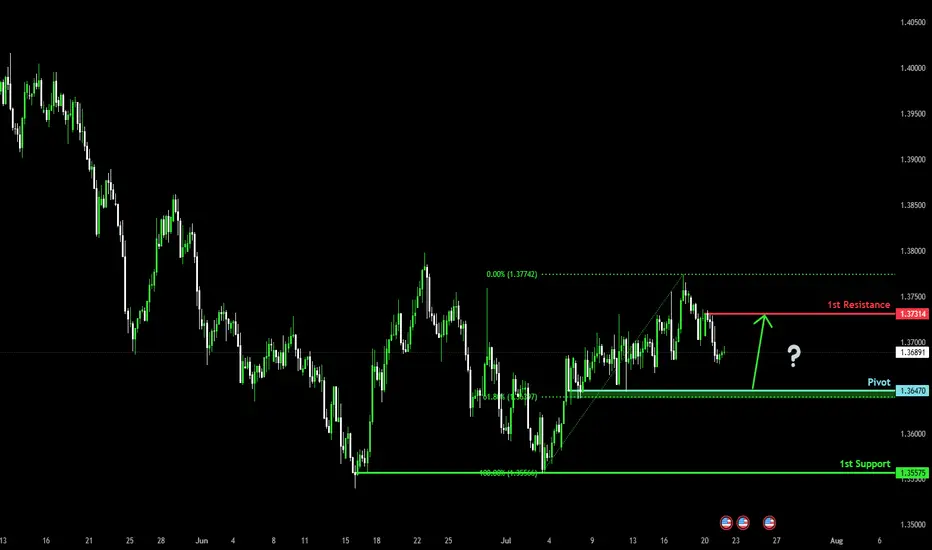
Falling towards pullback support?The Loonie (USD/CAD is falling towards the pivot, which has been identified as a pullback support that aligns with the 61.8% Fibonacci retracement and could bounce to the 1st resistance.
Pivot: 1.3647
1st Support: 1.3557
1st Resistance: 1.3731
Risk Warning:
Trading Forex and CFDs carries a high level of risk to your capital and you should only trade with money you can afford to lose. Trading Forex and CFDs may not be suitable for all investors, so please ensure that you fully understand the risks involved and seek independent advice if necessary.
Disclaimer:
The above opinions given constitute general market commentary, and do not constitute the opinion or advice of IC Markets or any form of personal or investment advice.
Any opinions, news, research, analyses, prices, other information, or links to third-party sites contained on this website are provided on an "as-is" basis, are intended only to be informative, is not an advice nor a recommendation, nor research, or a record of our trading prices, or an offer of, or solicitation for a transaction in any financial instrument and thus should not be treated as such. The information provided does not involve any specific investment objectives, financial situation and needs of any specific person who may receive it. Please be aware, that past performance is not a reliable indicator of future performance and/or results. Past Performance or Forward-looking scenarios based upon the reasonable beliefs of the third-party provider are not a guarantee of future performance. Actual results may differ materially from those anticipated in forward-looking or past performance statements. IC Markets makes no representation or warranty and assumes no liability as to the accuracy or completeness of the information provided, nor any loss arising from any investment based on a recommendation, forecast or any information supplied by any third-party.
USDCAD setting up for sell opportunitiesHello,
USDCAD is gearing up for a potential drop on the 8-hour timeframe. From a technical perspective, the pair is currently in a corrective phase after a strong bearish move from the recent highs. As price nears key moving averages, we anticipate the correction to complete, paving the way for another leg down. The MACD is also approaching the zero line, signaling that sellers could be preparing to take control.
On the fundamental side, this week is packed with high-impact events that could drive volatility. Key catalysts include:
Wednesday: FOMC meeting minutes release & a speech from President Trump.
Thursday: Initial jobless claims and crude oil inventory data.
Friday: S&P Global Manufacturing PMI and Global Services PMI.
These events are expected to influence the US dollar significantly. A weaker dollar could favor further downside in USDCAD. Additionally, trade policy remains a major market driver—Trump had initially imposed tariffs on Canada but later postponed them for a month, adding another layer of uncertainty.
With both technical and fundamental factors aligning, we maintain a bearish outlook on USDCAD in the near term. You can trade this pair using brokers that integrate with TradingView. tradingview.com/brokers/ such as TradeNation.
Good luck!

USD CAD longpossible scenario for usdcad lets see
when risk to reward ratio is good you dont have to worry just let the gut feeling flow
Please note: This is for educational purposes only and not a trading signal. These ideas are shared purely for back testing and to exchange views. The goal is to inspire ideas and encourage discussion. If you notice anything wrong, feel free to share your thoughts. In the end, to learn is to share !

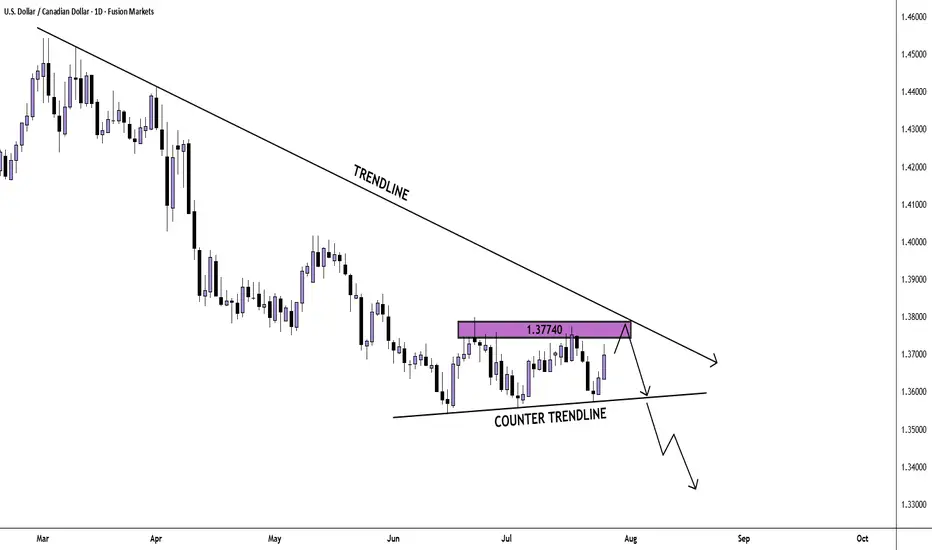
USD/CAD Daily Chart AnalysisFrom the bigger picture we see that sellers are dominating the market. Currently, price looks to be in a correction phase and twice has found resistance at the 1.37740 price point.
If price finds resistance there again, we may see a breakout and another bearish impulse.
If you agree with this analysis, look for a trade that meets your strategy rules.
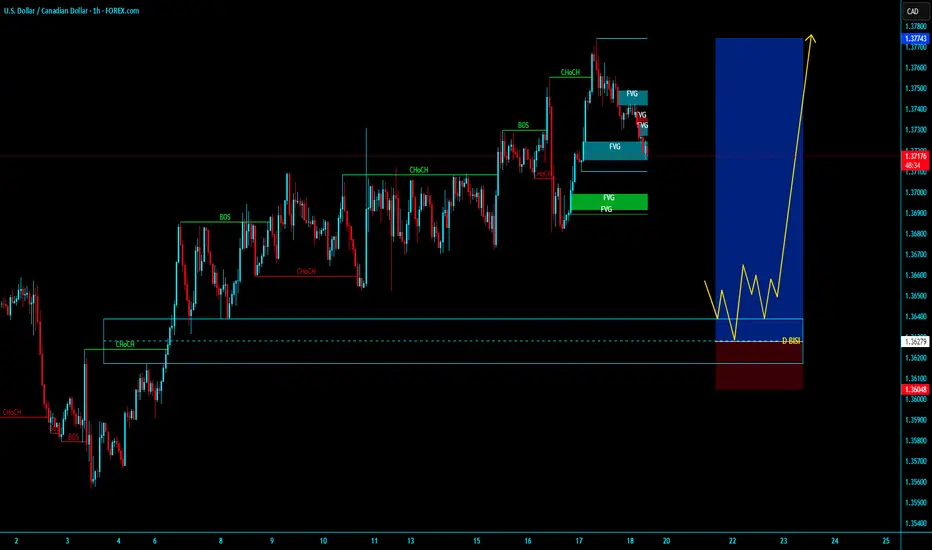
USDCAD BULLESH DAILY BISIUSDCAD BULLESH DAILY BISI
In daily TF market is bullesh market will creat trend line liquidity market first market will Run On Stop then tap daily BISI , going to LTF then valid mss with valid valid obi entry on this obi tight sl with 100 - 500 pips target holding over night , THANK YOU
KGB Priyabrat Behera
ICT TRADER & Advance mapping SMC trader
USDCAD bearish structureprice action, you gotta love structure thou. 🧭 Current Sentiment
Bias: Neutral to Bearish (subject to change based on upcoming U.S. data and oil prices)
Market Context: Consolidating in a tight range after recent USD weakness & steady CAD support from oil prices.

USDCAD bearish view
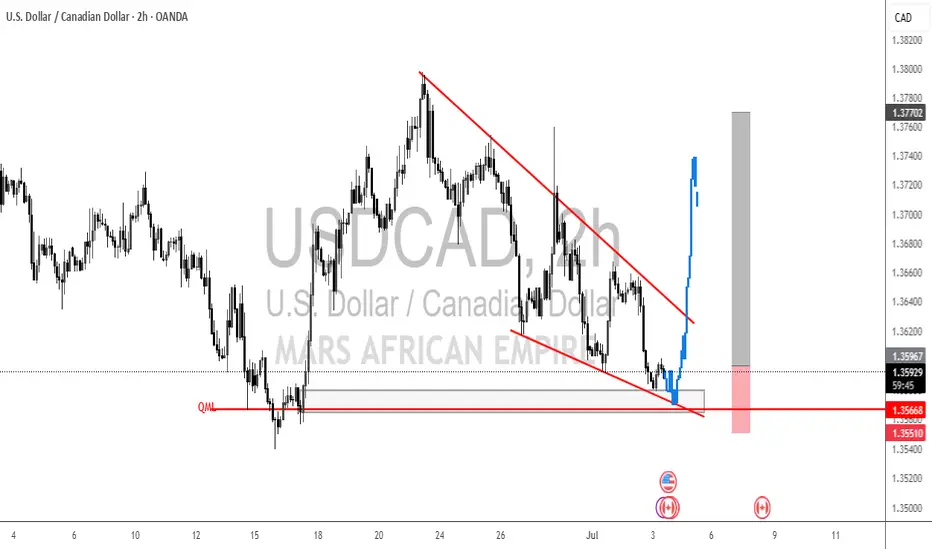
OANDA:USDCAD again on this pair, first analysis accurate, in new look having bearish view, price in PA moving, still we having nice structure, price is now come back in channel, looks like breaking first channel, which will take for confirmation and sign for bearish expectations.
SUP zone: 1.37400
RES zone: 1.36400, 1.36100
