USD/CAD.1week chart pattern.It looks like me discussing a trade setup for USD/CAD with:
Sell Entry: 1.36200
Target Point 1: 1.23504
Target Point 2: 2.31000 ← This seems like a mistake
Let’s break it down:
---
🔍 Trade Analysis:
Sell at 1.36200: This is a reasonable short entry, near recent resistance (depending on current market context).
Target Point 1 (1.23504): This is plausible, as it's a historically significant support level — a good long-term take-profit zone.
Target Point 2 (2.31000): This appears illogical for a short (sell) position — it's higher than the entry price. If you're shorting, you profit from a decline, not a rise.
---
✅ Corrected Setup (Sell Idea):
Sell USD/CAD @ 1.36200
Take Profit 1: 1.30000 (medium-term support)
Take Profit 2: 1.23500 (long-term support)
Stop Loss: 1.37200 (just above recent highs)
Would you like a chart analysis or backtest of this strategy?
USDCAD trade ideas

Bearish Bias Holds as Oil Rises & Rate Differentials NarrowUSDCAD – Bearish Bias Holds as Oil Rises & Rate Differentials Narrow
🌍 Macro & Fundamental Outlook
The Canadian Dollar (CAD) continues to gain ground this week, supported by two key drivers:
Crude oil prices surged due to Middle East tensions and renewed demand optimism — boosting CAD as a commodity-linked currency.
US-Canada yield spreads narrowed, following revised expectations that the Bank of Canada (BoC) may keep rates higher for longer, while the Fed is seen pausing.
Short-term event risks to watch:
🇨🇦 Canadian Manufacturing Sales data today at 13:30 GMT
🇨🇦 G7 Summit in Alberta from June 15–17, which may influence oil and energy policy sentiment
Our latest fair value estimate for USDCAD has shifted lower to 1.3613, reflecting tighter rate spreads and stronger oil. Technical structure remains tilted to the downside.
📉 Technical Outlook – M30 Chart
🔹 Structure:
Price remains in a short-term downtrend, with a well-defined descending trendline capping upside attempts.
The pair recently tested the EMA 89–200 zone and failed, suggesting continued bearish pressure.
🔹 Key Zones:
Dynamic Resistance: 1.3638 – 1.3660 (trendline + EMA cluster)
Support Area: 1.3592 → 1.3578
A break below 1.3578 could expose deeper downside toward 1.3420 (September lows)
🔹 Momentum Indicators:
RSI has bounced from oversold (30) but remains in bearish territory.
The current rebound looks corrective — potentially a dead cat bounce.
🧠 Market Sentiment
Flows favour commodity-backed currencies like CAD, especially with energy prices rising.
USD has weakened slightly as the Fed is expected to hold rates steady next week.
Sentiment is leaning toward "sell the rallies" on USDCAD for now.
🎯 Trade Setup Scenarios
🔻 SELL SCENARIO – If price retests and rejects 1.3638 – 1.3660
Entry: 1.3640 – 1.3655
Stop-Loss: 1.3685
Targets: 1.3592 → 1.3578 → 1.3510
🔺 BUY SCENARIO – If strong bullish reaction occurs at 1.3592 – 1.3578
Entry: 1.3580
Stop-Loss: 1.3545
Targets: 1.3620 → 1.3640
⚠️ Focus on trend continuation. Only consider buys if clear rejection or bullish confirmation appears at support.
✅ Conclusion
The current trend in USDCAD favours sellers, with fundamental momentum supporting CAD via higher oil and narrowing yield differentials. Key resistance at 1.3638–1.3660 remains the pivot zone to monitor. With Canadian data and the G7 Summit ahead, volatility could increase.

USDCAD Long – Wyckoff Spring PlaybookCause > Effect. Behavior > Breakouts.
We just printed a classic Spring + Test setup.
Here’s how the puzzle came together:
🔍 Accumulation Context:
Market ranged quietly for hours – demand building below the surface.
Spike down into previous demand zone with climax volume – the shakeout.
Quick reclaim of the zone with bullish absorption signals the Spring.
📈 Execution Plan:
Entry just above the spring low at 1.3617
Stop below spring at 1.3612
Targeting inefficiencies at 1.3645 and 1.3651 (prior supply pockets)
🎯 Why I Like This Setup:
Structure: Matches Wyckoff Spring logic (Phase C → D transition)
Volume: Shakeout came with high effort, followed by efficient reclaim
Timing: Happens in a zone where other traders might still be stuck short
> “In trading, the ones who recognize intent get in before confirmation.”
This trade idea isn’t about being right — it’s about understanding behavior.
I’m not reacting to candles. I’m tracking the motive behind them.

BUY USDCAD for bearish trend reversal STOP LOSS: 1.34966BUY USDCAD for bearish trend reversal
STOP LOSS: 1.34966
Regular Bullish Divergence
In case of Regular Bullish Divergence:
* The Indicator shows Higher Lows
* Actual Market Price shows Lower Lows
We can see a strong divergence on the MACD already and There is a strong trend reversal on the daily time frame chart.....
The daily time frame is showing strength of trend reversal from this strong level of Support so we are looking for the trend reversal and correction push from here.....
TAKE PROFIT : take profit will be when the trend comes to an end, feel from to send me a direct DM if you have any question about take profit or anything...
Remember to risk only what you are comfortable with... trading with the trend, patient and good risk management is the key to success here

possibility of uptrendIt is expected that a trend change will form within the current support area and we will witness the beginning of the upward trend. If the price breaks through the support area, a continuation of the downward trend to the next support area is possible.

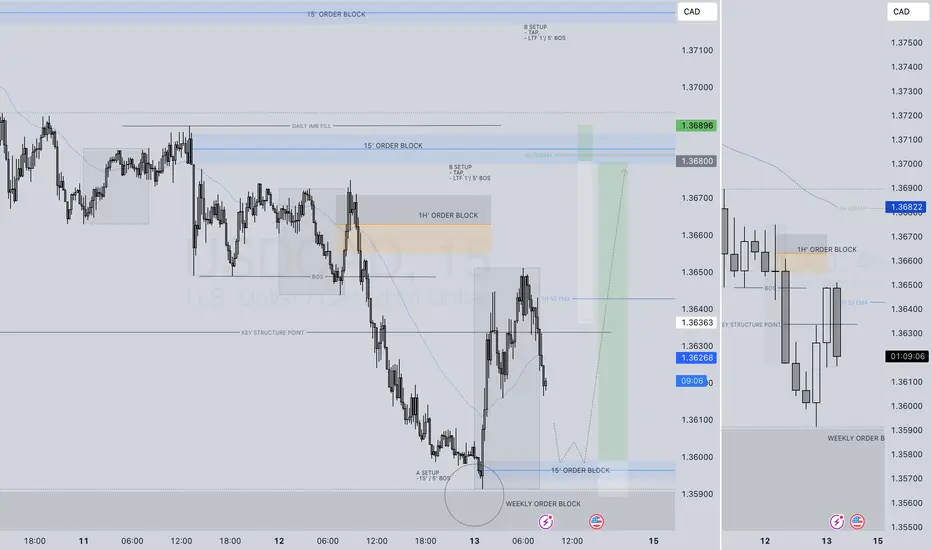
USDCAD LONG FORECAST Q2 W24 D13 Y25USDCAD LONG FORECAST Q2 W24 D13 Y25
Professional Risk Managers👋
Welcome back to another FRGNT chart update📈
Diving into some Forex setups using predominantly higher time frame order blocks alongside confirmation breaks of structure.
💡Here are some trade confluences📝
✅1H order block
✅HTF 50 EMA
✅Intraday bullish breaks of structure to be identified
✅15’ order block identified
🔑 Remember, to participate in trading comes always with a degree of risk, therefore as professional risk managers it remains vital that we stick to our risk management plan as well as our trading strategies.
📈The rest, we leave to the balance of probabilities.
💡Fail to plan. Plan to fail.
🏆It has always been that simple.
❤️Good luck with your trading journey, I shall see you at the very top.
🎯Trade consistent, FRGNT X
USD/CADUSDCAD is about to give us a nice opportunity to go long. lets patently wait for the setup.
Follow me for more long term trade that can make you a profitable trader. Trade responsibly.

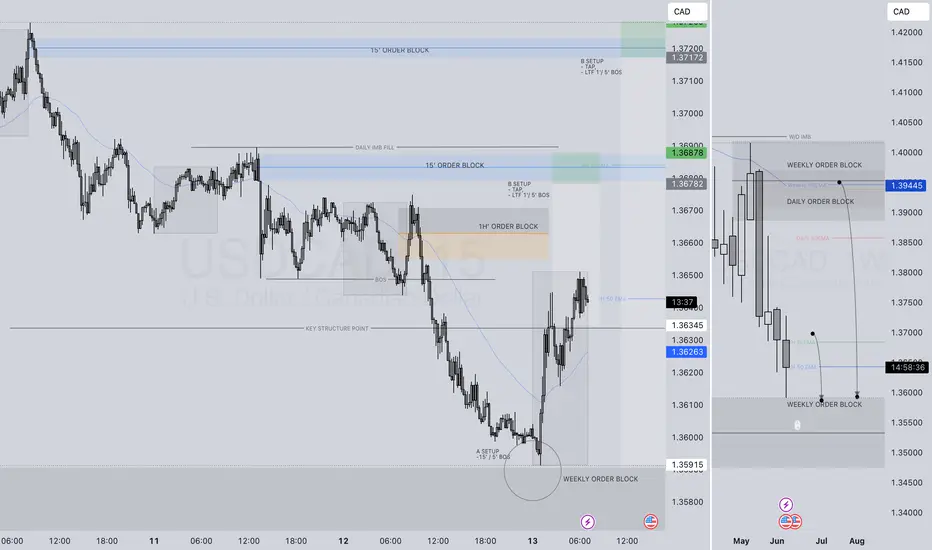
USDCAD SHORT FORECAST Q2 W24 D13 Y25USDCAD SHORT FORECAST Q2 W24 D13 Y25
Professional Risk Managers👋
Welcome back to another FRGNT chart update📈
Diving into some Forex setups using predominantly higher time frame order blocks alongside confirmation breaks of structure.
💡Here are some trade confluences📝
✅1H order block
✅HTF 50 EMA
✅Intraday bearish breaks of structure to be identified
✅15’ order block identified
🔑 Remember, to participate in trading comes always with a degree of risk, therefore as professional risk managers it remains vital that we stick to our risk management plan as well as our trading strategies.
📈The rest, we leave to the balance of probabilities.
💡Fail to plan. Plan to fail.
🏆It has always been that simple.
❤️Good luck with your trading journey, I shall see you at the very top.
🎯Trade consistent, FRGNT X
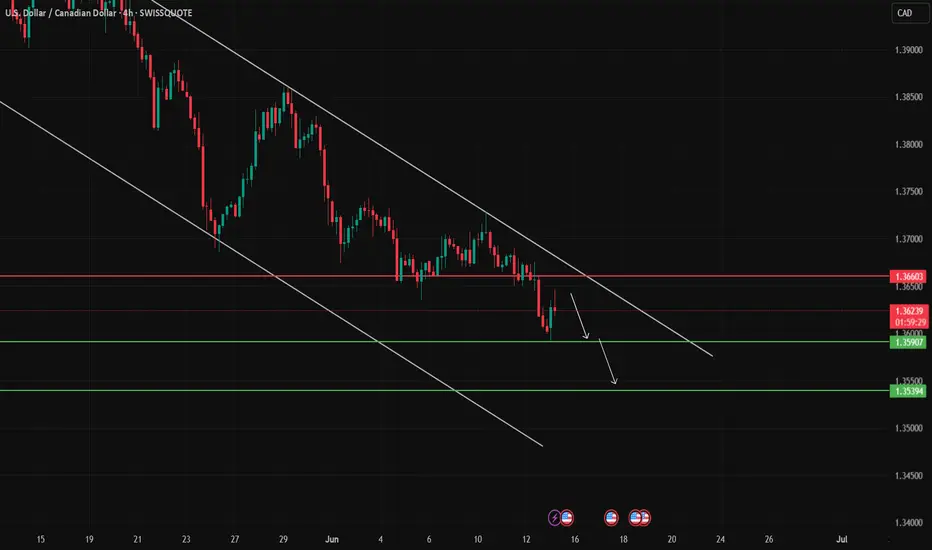
Technical Analysis The USD/CAD pair is moving within a clear descending channel on the 4-hour timeframe. Price failed to break the upper boundary of the channel and is now pushing lower from the 1.3660 resistance level. Currently, it's testing the 1.3590 support level. A confirmed break below this level could lead to the next target around 1.3539. The trend remains bearish unless the price breaks above the channel.
usd/cadTRADE 2 i belive this pair is already bullish in my opionion i just belive that it is retracing to a new price value which is the 1.346 which is at a daily support line follwed up by a 4hour support so i belive the market will hit this mark to follow up on the bullish side

USDCAD Wave Analysis – 12 June 2025- USDCAD broke key support level 1.3630
- Likely to fall to support level 1.3500
USDCAD currency pair recently broke the key support level 1.3630, which previously formed the daily Hammer reversal pattern at the start of June.
The breakout of the support level 1.3630 should accelerate the active impulse wave C of the ABC correction (2) from January.
USDCAD currency pair can be expected to fall to the next support level 1.3500 (target price for the completion of the active impulse wave C).

long time bearish signal for USD/CADfrom the technical USD/CAD is showing a long term bearish signal in weekly candlestick.
REASONS; 1] triple top pattern
2] ascending triangle pattern

USD/CAD Breaks Through Multi-year Trend Support USD/CAD broke through a key pivot zone last week at 1.3721/94- a region defined by the 38.2% retracement of the 2021 advance and the 61.8% retracement of the late-2023 advance. The subsequent decline is now extending more than 2.9% off the May highs with initial support within striking distance.
Weekly momentum has now dropped to the lowest levels since 2021 and a break of the 2021 uptrend (2022 trendline) threatens further losses ahead. Initial weekly support rests at the 1.618% extension of the February decline / 78.6% retracement of the late-2023 advance near 1.3504/23. Note that basic channel support converges on this threshold over the next few weeks and further highlights the technical significance of this zone (area of interest for possible downside exhaustion / price inflection IF reached). Subsequent support rests with the 2024 low-week clow (LWC) at 1.3360 and the 2023 LWC at 1.3218.
Weekly resistance is now eyed back at 1.3721 & 1.3795. Broader bearish invalidation is now lowered to the 52-week moving average / 2022 swing high near ~1.3961/78- a breach / close above the yearly channel would ultimately be needed to suggest a more significant low is in place.
Bottom line : USD/CAD has broken below multi-year uptrend support and threatens further losses in the weeks ahead. From a trading standpoint, look to reduce portions of short-exposure / lower protective stops on stretch towards 1.3523 IF reached- rallies should be limited to 1.3795 IF price is heading lower on this break with a close sub-1.35 needed to fuel the next major leg of the decline.
-MB

USDCAD SHORT BUYS LONG SELLUsdcad has been declining for a while and our daily time frame clearly is on a heavy sell. We are expecting loads of sells next week.

Will CAD bulls eventually fade away?During the North American session, the USD/CAD exchange rate continued its downward trend and is currently trading above 1.3600, approaching the support zone at 1.3600. If the exchange rate effectively holds the 1.3600 support zone, accompanied by RSI bottom divergence and MACD death cross repair signals, there may be a short-term technical rebound. The initial resistance above is still at 1.3700. If it can break through, it may open up space to 1.3800.
Humans need to breathe, and perfect trading is like breathing—maintaining flexibility without needing to trade every market swing. The secret to profitable trading lies in implementing simple rules: repeating simple tasks consistently and enforcing them strictly over the long term.

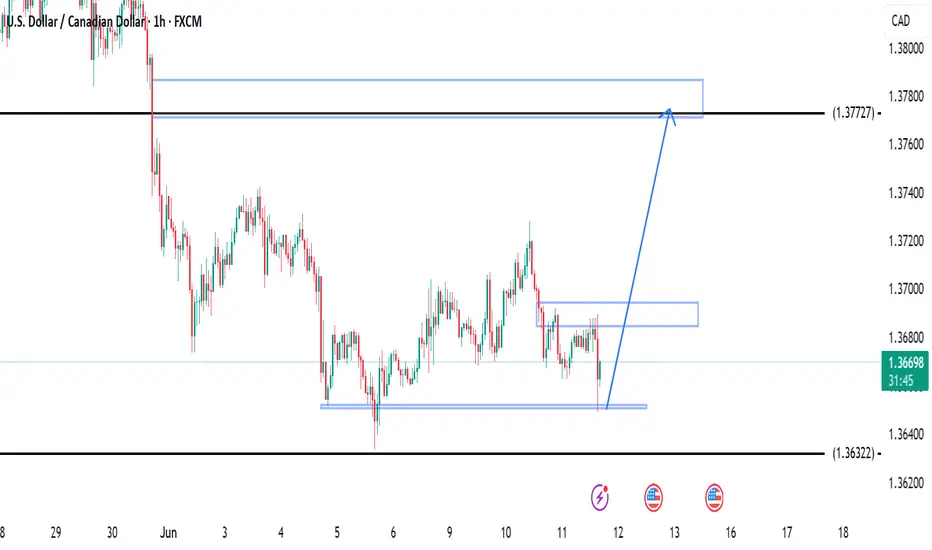
USDCAD Hits Support as Fed-Hawkish & BoC Cuts! Big Bounce ComingUSDCAD ( OANDA:USDCAD ) is trading at the Potential Reversal Zone(PRZ) and near the important Support line and Support lines .
In terms of Elliott Wave theory , it seems that USDCAD has managed to complete 5 main down waves and we can expect more up waves .
Also, we can see the Regular Divergence(RD+) between Consecutive Valleys .
I expect USDCAD to rise to at least 1.37860 CAD.
Fundamental View:
The Bank of Canada initiated its rate-cutting cycle , while the Federal Reserve remains firm with no immediate plans to ease.
Strong NFP data on Friday reinforced USD ( TVC:DXY ) strength .
Oil prices( BLACKBULL:BRENT ) may offer temporary support to CAD , but macro divergences clearly favor the dollar .
Note: Stop Loss(SL)= 1.36110 CAD
U.S Dollar/Canadian Dollar Analyze (USDCAD), 4-hour time frame.
Be sure to follow the updated ideas.
Do not forget to put a Stop loss for your positions (For every position you want to open).
Please follow your strategy; this is just my idea, and I will gladly see your ideas in this post.
Please do not forget the ✅' like '✅ button 🙏😊 & Share it with your friends; thanks, and Trade safe.

USDCAD Downtrend ResumesPrice continues to decline while respecting the daily resistance trendline. The next target is daily demand zone as shown and if it bounces in that zone and retraces it will continue to drop until weekly demand has been retested.

Usdcad Usdcad has been on a down trend I posted the signal few days ago and this is the result we are milking it
USD/CAD) Down Trand analysis Read The captionSMC trading point update
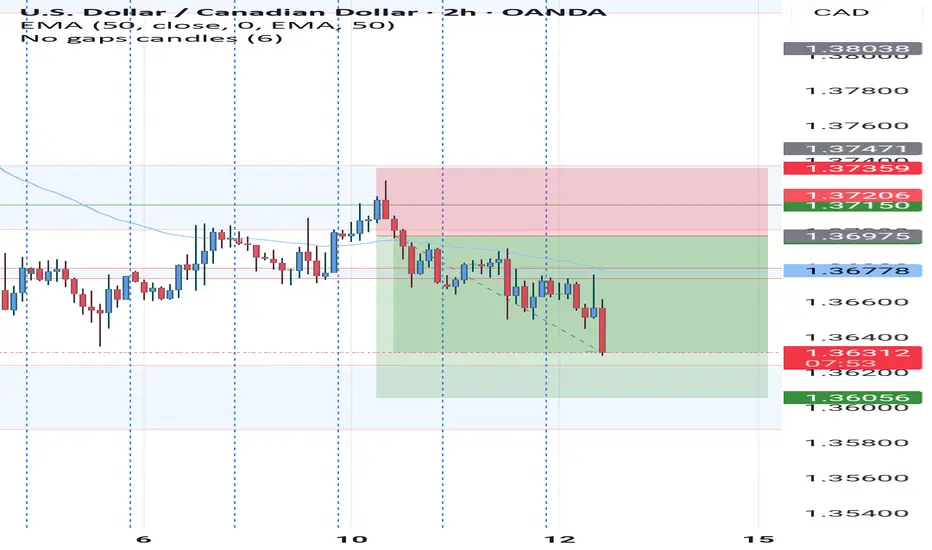
Technical analysis of USD/CAD (U.S. Dollar / Canadian Dollar) currency pair on the 2-hour timeframe, and it suggests a potential sell setup based on price action, key levels, and momentum indicators.
---
Chart Summary
Pair: USD/CAD
Timeframe: 2H
Current Price: 1.36432
EMA 200: 1.37436
Direction Bias: Bearish
Volume: 6.92K
Key Tool: EMA 200, RSI, Support/Resistance Zones
---
Technical Breakdown
1. Resistance Zone / Supply Area (~1.3680 - 1.3700)
The yellow box highlights a strong resistance zone.
Marked by three red arrows, where price has repeatedly rejected.
Indicates clear seller dominance in this area.
2. Break of Support Level
Price broke below the yellow support area and is now trading below it.
This signals a bearish breakout from a consolidation zone.
3. EMA 200 Trend Confirmation
EMA 200 (blue line) is sloping down.
Price is below the EMA, confirming bearish trend bias.
Acts as dynamic resistance.
4. Bearish Flag/Channel Break
A bearish flag or wedge pattern seems to have been broken downward.
The measured move (blue vertical line) suggests the projected drop.
---
Target Point
Target Price: 1.34951
This is based on the measured move from the resistance zone.
It aligns with the previous demand/support zone.
---
RSI (Relative Strength Index)
RSI (14) is 36.37, approaching the oversold zone.
This shows strong bearish momentum, but it also means price may stall or bounce slightly before continuing downward.
---
Trade Setup Idea
Entry: After confirmation of breakout below 1.3640
Stop Loss: Above 1.3700 (resistance zone)
Take Profit: 1.34951
Risk-to-Reward: ~1:2+
---
Risk Management & Caution
If price moves back into the yellow zone or breaks above 1.3700, the setup is invalidated.
Watch for high-impact news events (marked on the chart with U.S. flags) that may trigger volatility.
Mr SMC Trading point
---
Conclusion
This is a well-structured bearish idea based on:
Resistance rejections
Break of support
Downward EMA slope
Bearish RSI reading
It reflects strong downside potential toward 1.3495, offering a clean shorting opportunity for swing traders
Please support boost 🚀 this analysis)

USD/CAD BULLS WILL DOMINATE THE MARKET|LONG
Hello, Friends!
Bullish trend on USD/CAD, defined by the green colour of the last week candle combined with the fact the pair is oversold based on the BB lower band proximity, makes me expect a bullish rebound from the support line below and a retest of the local target above at 1.367.
Disclosure: I am part of Trade Nation's Influencer program and receive a monthly fee for using their TradingView charts in my analysis.
✅LIKE AND COMMENT MY IDEAS✅

USDCAD – Sell Into Resistance Amid Bearish ContinuationSell Limit
Entry: 1.3700
Target: 1.3600
Stop Loss: 1.3750
Duration: Intraday
Expires: 13/06/2025 06:00
Technical Overview
The broader trend remains bearish, and current price action does not indicate a reversal of the recent downtrend.
A correction toward resistance at 1.3700 offers a low-risk short entry.
A move below 1.3625 would confirm renewed bearish momentum, aligning with the measured move target of 1.3575.
The short-term RSI has turned negative, reinforcing downside pressure.
Traders should remain aware of upcoming U.S. data, with the PPI release at 13:30 UTC potentially triggering short-term volatility.
Key Technical Levels
Resistance: 1.3675 / 1.3700 / 1.3725
Support: 1.3625 / 1.3600 / 1.3575
Disclosure: I am part of Trade Nation's Influencer program and receive a monthly fee for using their TradingView charts in my analysis.

USDCAD SHORT FORECAST Q2 W24 D12 Y25USDCAD SHORT FORECAST Q2 W24 D12 Y25
Professional Risk Managers👋
Welcome back to another FRGNT chart update📈
Diving into some Forex setups using predominantly higher time frame order blocks alongside confirmation breaks of structure.
💡Here are some trade confluences📝
✅4H order block rejection
✅HTF 50 EMA
✅Intraday bearish breaks of structure to be identified
✅15’ order block identified
🔑 Remember, to participate in trading comes always with a degree of risk, therefore as professional risk managers it remains vital that we stick to our risk management plan as well as our trading strategies.
📈The rest, we leave to the balance of probabilities.
💡Fail to plan. Plan to fail.
🏆It has always been that simple.
❤️Good luck with your trading journey, I shall see you at the very top.
🎯Trade consistent, FRGNT X
