USDJPY:800+ PIPS Dropping Well Since Our First Idea!Dear Traders,
Since we posted our idea when price was trading at 158 we told you that this will be a massive dropped and since then price has proven us right, now we think there is another big drop is on the way. Please use proper risk management while trading.
USDCAD trade ideas

USDCAD Will Explode! BUY!
My dear followers,
This is my opinion on the USDCAD next move:
The asset is approaching an important pivot point 1.3654
Bias - Bullish
Safe Stop Loss - 1.3603
Technical Indicators: Supper Trend generates a clear long signal while Pivot Point HL is currently determining the overall Bullish trend of the market.
Goal - 1.3751
About Used Indicators:
For more efficient signals, super-trend is used in combination with other indicators like Pivot Points.
Disclosure: I am part of Trade Nation's Influencer program and receive a monthly fee for using their TradingView charts in my analysis.
———————————
WISH YOU ALL LUCK

USD/CAD As we keep moving upwards,more double bottoms will be activated and take profit levels will extend.Nice R/R

USDCAD Looking Solid Buy zoneUSD/CAD is currently in a potential buying zone, supported by the broader strength of the US dollar. While the support level appears to be holding, a clear confirmation is still lacking. A shift in market phase may be forming, but it remains unconfirmed at this stage.
Key Points to watch
Resistance 1.37300 / 1.37600
Support Levels 1.36500
you may see more details in the chart Ps Support with like and comments for more better analysis.

USDCAD → One step away from distributionFX:USDCAD is recovering amid the dollar's growth. Unemployment news is ahead. A return of the price to the buying zone may support the currency pair.
Against the backdrop of the dollar's growth, a change in the market phase is forming (unconfirmed). The price has stopped updating lows and is forming an eql, from which it is breaking out of the downtrend. The initial retest of liquidity at 1.366 may end in a correction. However, a quick retest and consolidation of the price above the level will confirm the change in sentiment
Resistance levels: 1.3686, 1.3732
Support levels: 1.3675, 1.366
Despite the fact that the price broke the downward resistance, the currency pair is still under pressure from sellers who are waiting for the price to fall from 1.3686. A breakout, a change in market sentiment to bullish, and consolidation above 1.3675-1.3686 will confirm readiness for a recovery. Zones of interest: eqh 1.3732
Best regards, R. Linda!

USD/CAD..30M chart bearish flag pattern.Looking at the chart I'm provided, here's a quick technical breakdown:
---
📉 Chart Analysis
Pair: Likely USDCAD (based on visible digits and style).
Pattern: Bearish rising channel has broken down.
Breakdown Confirmed: Price has clearly broken below the lower channel support, with bearish continuation signs.
Ichimoku Cloud: Price has moved below the Kumo (cloud), which confirms downside momentum.
Red Arrows & Levels: You've drawn a zigzag-style projection with two target zones marked.
---
🎯 Identified Target Levels (approximate)
Based on your chart's drawing and current price (1.3710):
1. Target 1: Around 1.3660
2. Target 2: Around 1.3620
These correspond to the two red horizontal lines marked "TARGET" in your chart.
---
✅ Summary
Sell Bias Active
Target 1: 1.3660
Target 2: 1.3620
Invalidation (Stop Loss suggestion): Above 1.3745–1.3755 zone (back inside channel or Kumo)
Would you like a more precise projection using Fibonacci levels or a cleaned-up chart version with these targets plotted clearly?

USDCAD WILL DELIVER BY FIREFX:USDCAD WeeklyTF and MontlyTF Buy analysis, Its surely going to be hit by the grace of God the Almighty.

possibility of uptrendThe price is expected to cross the resistance trend line and advance to the specified resistance area. Then, considering the price behavior in the resistance area, possible scenarios have been identified.
USDCAD Buy- Go for short term buy then manage your trade
- potentially go higher or significant reversing to the upside
- Refine entry with smaller SL for better RR, if your strategy allow
A Message To Traders:
I’ll be sharing high-quality trade setups for a period time. No bullshit, no fluff, no complicated nonsense — just real, actionable forecast the algorithm is executing. If you’re struggling with trading and desperate for better results, follow my posts closely.
Check out my previously posted setups and forecasts — you’ll be amazed by the high accuracy of the results.
"I Found the Code. I Trust the Algo. Believe Me, That’s It."

Potential bearish drop for the Loonie?The price is rising towards the pivot, which is an overlap resistance, and could drop to the 1st support.
Pivot: 1.3683
1st Support: 1.3590
1st Resistance: 1.3707
Risk Warning:
Trading Forex and CFDs carries a high level of risk to your capital and you should only trade with money you can afford to lose. Trading Forex and CFDs may not be suitable for all investors, so please ensure that you fully understand the risks involved and seek independent advice if necessary.
Disclaimer:
The above opinions given constitute general market commentary, and do not constitute the opinion or advice of IC Markets or any form of personal or investment advice.
Any opinions, news, research, analyses, prices, other information, or links to third-party sites contained on this website are provided on an "as-is" basis, are intended only to be informative, is not an advice nor a recommendation, nor research, or a record of our trading prices, or an offer of, or solicitation for a transaction in any financial instrument and thus should not be treated as such. The information provided does not involve any specific investment objectives, financial situation and needs of any specific person who may receive it. Please be aware, that past performance is not a reliable indicator of future performance and/or results. Past Performance or Forward-looking scenarios based upon the reasonable beliefs of the third-party provider are not a guarantee of future performance. Actual results may differ materially from those anticipated in forward-looking or past performance statements. IC Markets makes no representation or warranty and assumes no liability as to the accuracy or completeness of the information provided, nor any loss arising from any investment based on a recommendation, forecast or any information supplied by any third-party.

USD CAD at weekly support likely to re bound from here Price is consolidating in a tight range after prior upward move → suggesting bullish accumulation. If price breaks above 1.3770, a rally toward 1.3820 is likely. However, a breakdown below 1.3680 could attract sellers toward 1.3620.

Usdcad Sellprice is bearish still on the 4hr tf and is in a 4hr supply zone. there are supplies across the lower tfs within the 4hr zone. there is a particular one on the 15m tf that is strong. looking to sell once price trades below last ll.

USDCAD TREND REVERSAL OR CONTINUETION OF BEARISH TREND? The price has been making lower highs and lower lows, especially from late May into early June, indicating sustained downward momentum. There is a small bullish pullback (seen in the last few candles), but no strong reversal confirmation yet if price action form BOS and invers H & S then we can expect a short term bullish trend reversal.
USDCAD Potential DownsidesHey traders, in today's trading session we are monitoring USDCAD for a selling opportunity around 1.37500 zone, USDCAD is trading in a downtrend and currently is in a correction phase in which it is approaching the trend at 1.37500 support and resistance area.
Trade safe, Joe.

USD/CAD under pressure as RBC warns of dollar overvaluationRBC Global Asset Management has warned that the U.S. dollar appears significantly overvalued. The firm points to the ballooning U.S. budget deficit—now forecast to surpass $1.9 trillion this year—as a key factor behind its bearish outlook.
RBC's position might be reflected in the FX market with the USD/CAD under pressure. The pair has been forming lower highs and lower lows since late May, suggesting a potential continuation of the short-term downtrend.
Key support levels to watch might include 1.3640, 1.3600, and potentially 1.3560 if selling accelerates. On the upside, a recovery might need to break above 1.3720, with further resistance possibly around 1.3760 and 1.3820.


Bearish reversal off overlap resistance?USD/CAD is rising towards the resistance level which is an overlap resistance that lines up with the 23.6% and the 50% Fibonacci retracement and could reverse from this level to our take profit.
Entry: 1.3691
Why we like it:
There is an overlap resistance that lines up with the 23.6% and the 50% Fibonacci retracement.
Stop loss: 1.3738
Why we like it:
There is a pullback resistance level that is slightly below the 50% Fibonacci retracement.
Take profit: 1.3635
Why we like it:
There is a pullback support level.
Enjoying your TradingView experience? Review us!
Please be advised that the information presented on TradingView is provided to Vantage (‘Vantage Global Limited’, ‘we’) by a third-party provider (‘Everest Fortune Group’). Please be reminded that you are solely responsible for the trading decisions on your account. There is a very high degree of risk involved in trading. Any information and/or content is intended entirely for research, educational and informational purposes only and does not constitute investment or consultation advice or investment strategy. The information is not tailored to the investment needs of any specific person and therefore does not involve a consideration of any of the investment objectives, financial situation or needs of any viewer that may receive it. Kindly also note that past performance is not a reliable indicator of future results. Actual results may differ materially from those anticipated in forward-looking or past performance statements. We assume no liability as to the accuracy or completeness of any of the information and/or content provided herein and the Company cannot be held responsible for any omission, mistake nor for any loss or damage including without limitation to any loss of profit which may arise from reliance on any information supplied by Everest Fortune Group.


USDCAD BUY SIGNAL Entry Point: 1.36800USDCAD BUY SIGNAL
Entry Point: 1.36800
🎯 Target 1: 1.37500
🎯 Target 2: 1.38000
🎯 Final Target: 1.38300
⚠️ Risk Management is CRUCIAL
– Use a proper stop-loss every time
– Don’t overexpose your account
– Risk only what fits your strategy
📊 Trade Setup Insight:
– Price rebounding from support
– Bullish structure forming
– Momentum favoring upside push
✅ Book profits at each level
✅ Adjust SL to breakeven after T1
✅ Patience > Emotion in trading
📌 Consistency brings results
📌 Follow your system – not the crowd
📌 Capital protection = long-term success
📢 Educational purposes only – trade smart, trade safe!

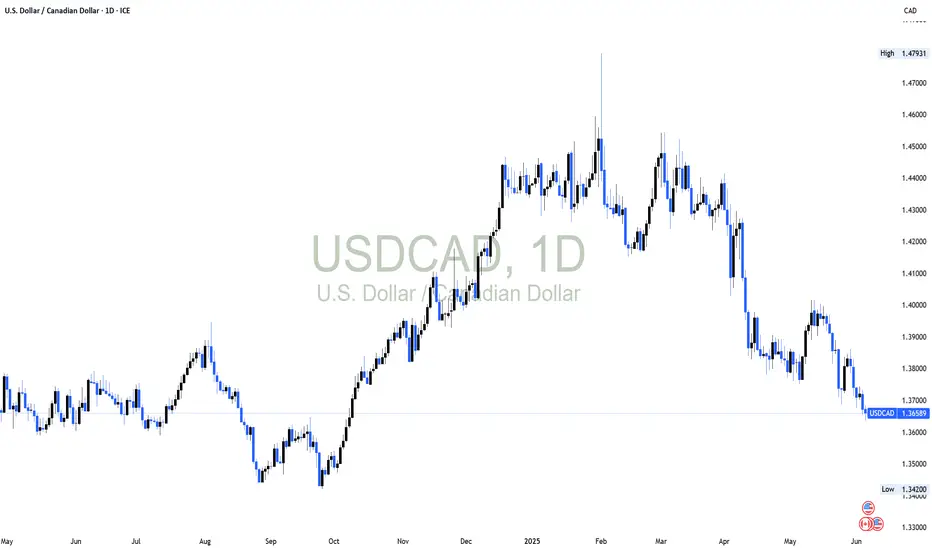
USDCAD SHORT TERM BULLISH CORRECTIONGenerally, the US Dollar is losing ground against major currencies. The decline is stemming from pending tariffs equilibrium and looming Fed rate cuts. On the USDCAD daily chart, the US Dollar is poised to decline further to the unmitigated zone. Once this demand zone is contacted we are likely to clearer price action direction on whether to buy or sell further. Our bias is a short term bullish market correction outlook once the unmitigated zone is contacted.
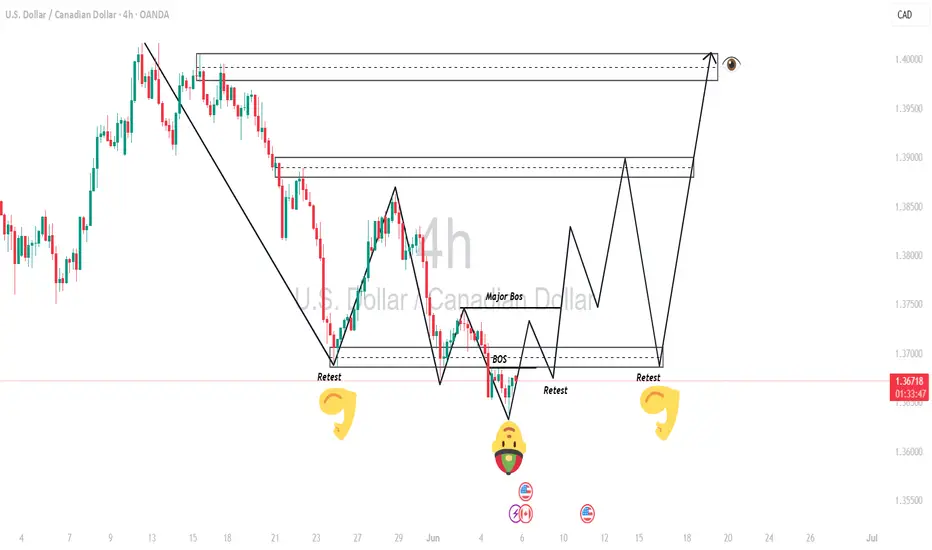
UCAD Bears Ready to Break 2 Month Long Falling Support??OANDA:USDCAD has been supported by a Falling Support Trend line since August 14th and here soon Price could potentially give us a Bearish Break to that Trend line!
Once a Breakout is validated, we could look for a Retest Set-Up for some Short Opportunities to take Price down to the Support Zone created by the August and September 2024 Lows.
An interesting fact to point out is if you observe the reaction of Price when it tests the Falling Support, we can see Price arc and the following reactions arc smaller, suggesting Bulls are losing strength on the push off of the Falling Support!
Price Action is being heavily driven by Fundamentals in the markets this week:
-USD-
ADP Non-Farm Employment - Previous 60K / Forecast 111K / Actual 37K
ISM Services PMI - Previous 51.6 / Forecast 52 / Actual 49.9
ISM Manufacturing PMI - Previous 48.7 / Forecast 49.3 / Actual 48.5
ISM Manufacturing Prices - Previous 69.8 / Forecast 70.2 / Actual 48.5
Unemployment Claims - Previous 239K / Forecast 236K / Actual 247K
*Average Hourly Earnings, Non-Farm Employment and Unemployment Rate are to be released tomorrow
-CAD-
BOC held Interest Rates @ 2.75%
Ivey PMI - Previous 47.9 / Forecast 48.3 / Actual 48.9
*Employment Change and Unemployment are to be released tomorrow
With BOC holding Interest Rates and the Federal Reserve possibly looking to cut rates because of a "softening labor market", this could fuel CAD to overcome the pair and put Bears in control to pull Prices lower!
www.tradingview.com

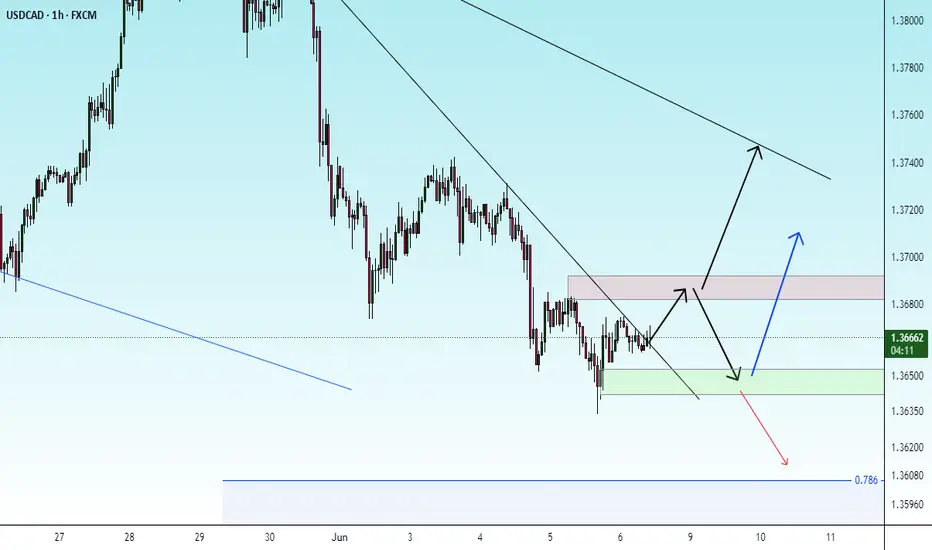
USD/CAD - Bearish Flag (04.06.2025)The USD/CAD Pair on the M30 timeframe presents a Potential Selling Opportunity due to a recent Formation of a Bearish Flag Pattern. This suggests a shift in momentum towards the downside in the coming hours.
Possible Short Trade:
Entry: Consider Entering A Short Position around Trendline Of The Pattern.
Target Levels:
1st Support – 1.3645
2nd Support – 1.3605
🎁 Please hit the like button and
🎁 Leave a comment to support for My Post !
Your likes and comments are incredibly motivating and will encourage me to share more analysis with you.
Best Regards, KABHI_TA_TRADING
Thank you.
Disclosure: I am part of Trade Nation's Influencer program and receive a monthly fee for using their TradingView charts in my analysis.

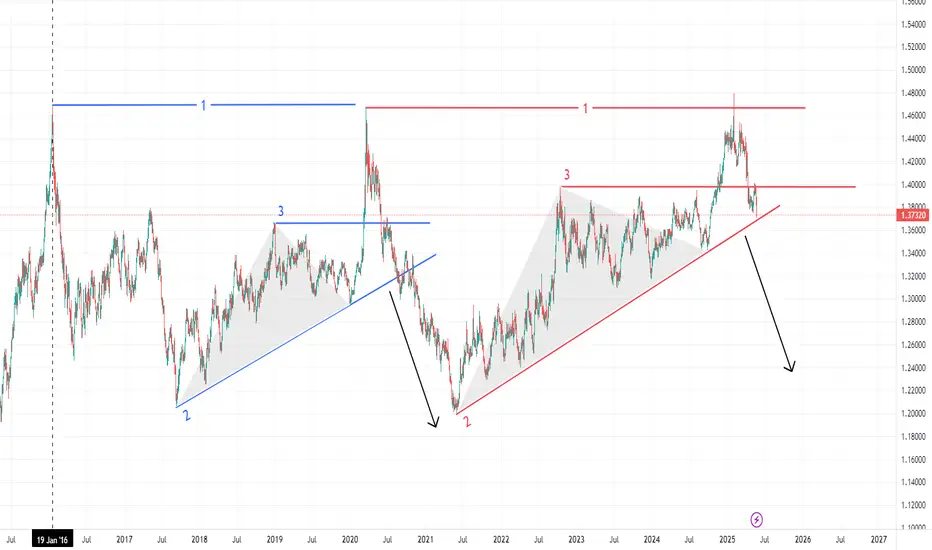
USDCAD A chance for Fall DownI see A chance for Fall down after breaks LEVEL 2 (trend line) similar to what happened before.
lets wait and see will happened next week.
Do you agree ? what's your idea ?