ENTRY USDCADDisclaimer:
This is merely a chart-based analytical trading idea and is not considered investment advice. Please manage your risks carefully and conduct your own research before making any trading decisions.
USDCAD trade ideas

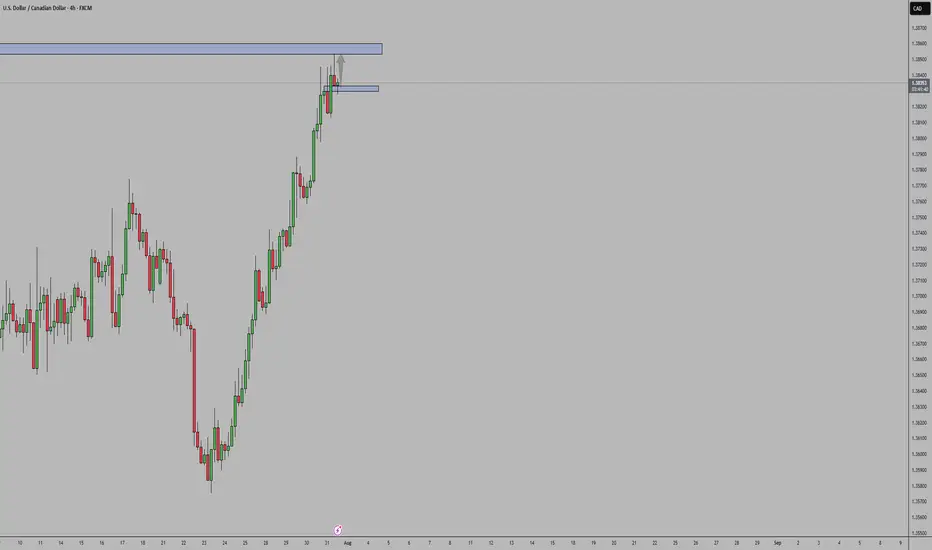
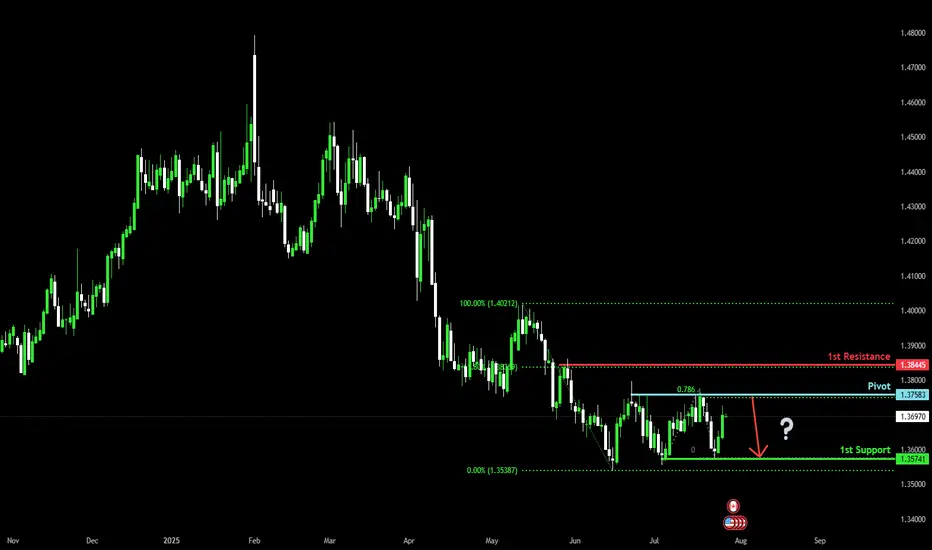
Heading into multi swing high resistance?The Loonie (USD/CAD) is rising towards the pivot and could reverse to the 1st support, which acts as a multi-swing high support.
Pivot: 1.3758
1st Support: 1.3574
1st Resistance: 1.3844
Risk Warning:
Trading Forex and CFDs carries a high level of risk to your capital and you should only trade with money you can afford to lose. Trading Forex and CFDs may not be suitable for all investors, so please ensure that you fully understand the risks involved and seek independent advice if necessary.
Disclaimer:
The above opinions given constitute general market commentary, and do not constitute the opinion or advice of IC Markets or any form of personal or investment advice.
Any opinions, news, research, analyses, prices, other information, or links to third-party sites contained on this website are provided on an "as-is" basis, are intended only to be informative, is not an advice nor a recommendation, nor research, or a record of our trading prices, or an offer of, or solicitation for a transaction in any financial instrument and thus should not be treated as such. The information provided does not involve any specific investment objectives, financial situation and needs of any specific person who may receive it. Please be aware, that past performance is not a reliable indicator of future performance and/or results. Past Performance or Forward-looking scenarios based upon the reasonable beliefs of the third-party provider are not a guarantee of future performance. Actual results may differ materially from those anticipated in forward-looking or past performance statements. IC Markets makes no representation or warranty and assumes no liability as to the accuracy or completeness of the information provided, nor any loss arising from any investment based on a recommendation, forecast or any information supplied by any third-party.
USD/CAD(20250730)Today's AnalysisMarket News:
According to a Reuters/Ipsos poll, Trump's approval rating has fallen to 40%, the lowest level since his second term.
Technical Analysis:
Today's Buy/Sell Levels:
1.3762
Support and Resistance Levels:
1.3820
1.3798
1.3784
1.3739
1.3725
1.3704
Trading Strategy:
If the price breaks above 1.3784, consider a buy entry, with the first target price at 1.3798. If the price breaks below 1.3762, consider a sell entry, with the first target price at 1.3739.

USDCAD Analysis – July 16, 2025
Following the ceasefire between Iran and Israel, oil prices have weakened, reducing support for the Canadian dollar, which is closely tied to crude. As a result, CAD could remain among the weaker currencies over the next two weeks.
Meanwhile, the US dollar may gain strength following the CPI data released on July 15, 2025, potentially setting up a favorable swing opportunity for USDCAD bulls.
🟥 High-Risk Setup – R:R 7.0
This aggressive setup targets a sharp upside move with a tight stop loss, aiming for a high reward relative to the risk. It's suitable for traders comfortable with volatility and willing to accept a lower probability for a higher payout.
🟦 Moderate-Risk Setup – R:R 2.5
A more balanced scenario with a wider stop and a closer target, offering a higher probability of success and smoother trade management. This setup aligns well with swing trading strategies seeking consistent results.
Both setups are based on the current price action structure visible on the chart.
Trade safe, manage your risk, and follow your plan. ✅

Uptrend is coming. Opportunity for buyers✏️ OANDA:USDCAD is trading close to the upper boundary of the triangle pattern. There is a high possibility that the current bullish momentum will break the upper boundary and form an uptrend for the USDCAD pair. The important price zone for the sellers at the moment is 1.075. If the buyers are strong enough to push the price above 1.075, the sellers will only be really interested in the price zone of 1.340, the high of the pair in May.
📉 Key Levels
Buy trigger: Reject and Trading above 1.365
BUY DCA Break 1.375
Target: 1.400
Leave your comments on the idea. I am happy to read your views.


USD_CAD BULLISH BREAKOUT|LONG|
✅USD_CAD is going up
Now and the pair made a bullish
Breakout of the key horizontal
Level of 1.3800 and the breakout
Is confirmed so we are bullish
Biased and we will be expecting
A further bullish move up
LONG🚀
✅Like and subscribe to never miss a new idea!✅
Disclosure: I am part of Trade Nation's Influencer program and receive a monthly fee for using their TradingView charts in my analysis.

USDCAD's Opportunity Bell Is Ringing — Don’t Miss Out!Hey there, my valued friends!
I’ve prepared a fresh USDCAD analysis just for you.
📌 If the 1.37245 level breaks, the next target will be 1.38000.
Every single like you send my way is the biggest motivation behind sharing these analyses.
🙌 Huge thanks to each and every one of you who supports me!
Would you like to add a visual or a catchy headline to boost engagement even more? I can help with that too.

A New Day, A New Opportunity: USDCAD Buy StrategyGood morning Traders,
USDCAD has reached a key support zone between 1.37531 and 1.37592.
I'm opening a buy position from this level, aiming for the 1.37887 target.
Feel free to adjust your stop-loss based on your own margin and risk tolerance.
Your likes are my biggest source of motivation when sharing analysis. Thanks to everyone who supports with a simple like!

USDCAD SELLUSD/CAD rallies further, approaches 1.3900 on higher levies to Canada
The US Dollar keeps marching higher, as the Canadian Dollar struggles after Trump decided to increase tariffs to Canada to 35% from the previous 25%, escalating the trading tension with one of its main trading partners. The US President justified his decision on Canada’s alleged reluctance to cooperate on curbing the traffic of fentanyl and other drugs across the US border
The year will be politically marked by Trump’s return to the White House. A Republican government is seen as positive for financial markets, but Trump’s pledge to cut taxes and impose tariffs on foreign goods and services may introduce uncertainty to both the political and economic landscape.
Canada’s political crisis peaked in late 2024 with a no-confidence vote against Prime Minister Justin Trudeau, leading to snap elections and a weakened Liberal minority government. Policy uncertainty and economic challenges dominate 2025’s outlook, raising concerns over market stability and investor confidence.
The BoC is set to continue easing interest rates through 2025, at least at a faster pace than the Fed is expected to, which could apply pressure on CAD’s already-rising rate differential.
SUPPORT 1.38444
SUPPORT 1.38039
SUPPORT 1.37621
RESISTANCE 1.38889
RESISTANCE 1.39049

USDCAD Wave Analysis – 31 July 2025
- USDCAD broke resistance zone
- Likely rise to resistance level 1.3900
USDCAD currency pair recently broke the resistance zone located between the resistance level 1.3785 (upper border of the sideways price range from the start of June) and the 50% Fibonacci correction of the downward impulse from May.
The breakout of this resistance zone accelerated the active impulse wave 3, which belongs to medium-term impulse wave (B) from the start of July.
USDCAD currency pair can be expected to rise further to the next resistance level 1.3900 (target price for the completion of the active impulse wave 3).

USD-CAD Short From Resistance! Sell!
Hello,Traders!
USD-CAD went up and
Retested a horizontal
Resistance of 1.3800
From where we are
Already seeing a local
Bearish pullback and
As we are locally bearish
Biased so we will be
Expecting a local move down
Sell!
Comment and subscribe to help us grow!
Check out other forecasts below too!
Disclosure: I am part of Trade Nation's Influencer program and receive a monthly fee for using their TradingView charts in my analysis.

USD/CAD - 6C1! : Trade update FundamentalThe US dollar index (DXY) gained strength against major currencies on Monday following a landmark trade agreement between the United States and the European Union. During the meeting in Scotland on Sunday, President Donald Trump and European Commission President Ursula von der Leyen announced a new trade framework, which includes a 15% import tariff on EU goods—half of the 30% rate Trump had initially threatened to impose starting August 1.
The DXY opened higher at the start of the week, and it’s clear that most currencies are likely to see a decline in response. This trend also extends to pairs like the 6C1! (USDCAD), where the USD has been increasing its long positions. Last week, non-commercial traders added to their holdings, while commercial traders remain at their highest levels since 2021. Based on this setup, we are maintaining a bullish outlook and expect the continuation of our long position strategy.
Previous Idea :
✅ Please share your thoughts about USD/CAD in the comments section below and HIT LIKE if you appreciate my analysis. Don't forget to FOLLOW ME; you will help us a lot with this small contribution.

USD/CAD Unless oil rockets, then the pair has room to rise.From June till now, we’ve been in a range-bound market, with multiple failed attempts to break lower.
But now we’re seeing higher lows forming, and price is bouncing off my fvp zone @ 1.36600 . So if the Fed stays patient and oil stays weak or sideways, USD/CAD bulls have the upper hand. I am expecting a bearish retest soon to develop @ Key Bullish FVP Zone: 1.36600, but if 1.3577 gets violated with strength, then scratch the long idea — it might be time for CAD bulls to party instead.
Extreme Discount Zone: Just below at 1.36000,
If the price dips into this area, it could be a liquidity hunt. But if not, then the bulls will have to come in and drive the market to the
1st Take Profit Target: 1.38400

USD/CAD SHORT FROM RESISTANCE
Hello, Friends!
It makes sense for us to go short on USD/CAD right now from the resistance line above with the target of 1.376 because of the confluence of the two strong factors which are the general downtrend on the previous 1W candle and the overbought situation on the lower TF determined by it’s proximity to the upper BB band.
Disclosure: I am part of Trade Nation's Influencer program and receive a monthly fee for using their TradingView charts in my analysis.
✅LIKE AND COMMENT MY IDEAS✅

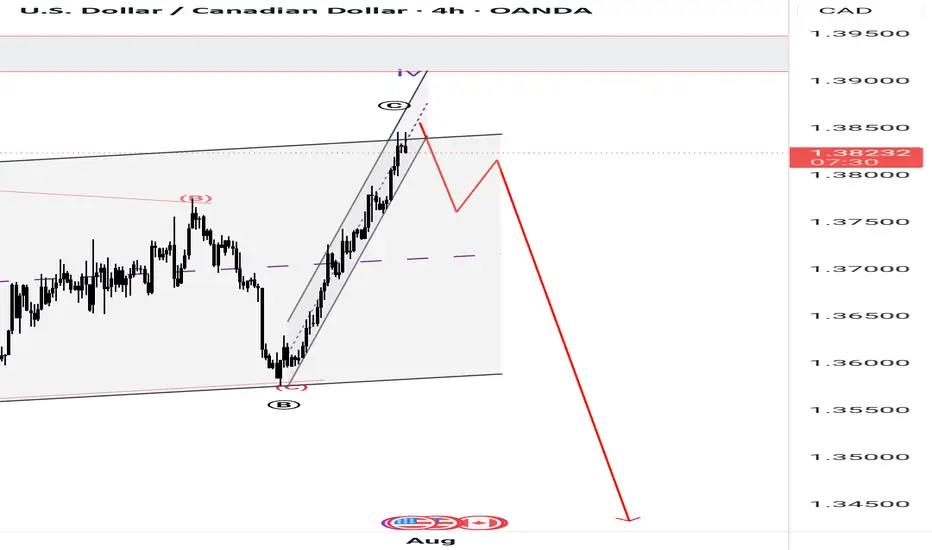
Potential BEARSAfter a prolonged and a complex correction, it looks out to be a FLAT CORRECTION with wave B producing a flat correction as well in a lower degree hence making it all complex. But at the moment we have a perfect channel AB=CD correction which prompts a continuation to the south. Fingers crossed 🤞 as the market rejects a resistance of the channel.
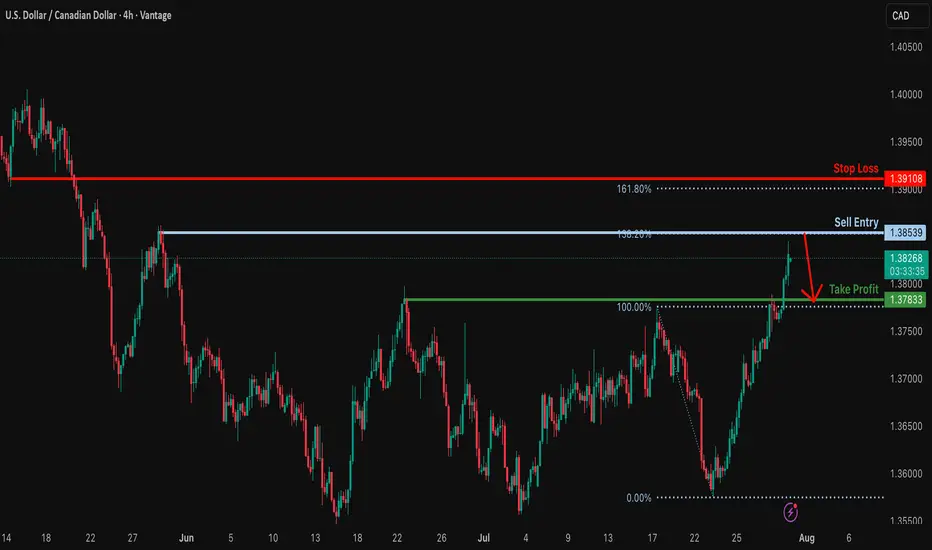
Could the Loonie reverse from here?The price is rising towards the resistance level, which is a swing high resistance that aligns with the 138.2% Fibonacci extension and could potentially reverse from this level to our take-profit.
Entry: 1.3853
Why we like it:
There is a swing high resistance that lines up with the 138.2% Fibonacci extension.
Stop loss: 1.3910
Why we like it:
There is a pullback resistance that is slightly above the 161.8% Fibonacci extension.
Take profit: 1.3783
Why we like it:
There is a pullback support.
Enjoying your TradingView experience? Review us!
Please be advised that the information presented on TradingView is provided to Vantage (‘Vantage Global Limited’, ‘we’) by a third-party provider (‘Everest Fortune Group’). Please be reminded that you are solely responsible for the trading decisions on your account. There is a very high degree of risk involved in trading. Any information and/or content is intended entirely for research, educational and informational purposes only and does not constitute investment or consultation advice or investment strategy. The information is not tailored to the investment needs of any specific person and therefore does not involve a consideration of any of the investment objectives, financial situation or needs of any viewer that may receive it. Kindly also note that past performance is not a reliable indicator of future results. Actual results may differ materially from those anticipated in forward-looking or past performance statements. We assume no liability as to the accuracy or completeness of any of the information and/or content provided herein and the Company cannot be held responsible for any omission, mistake nor for any loss or damage including without limitation to any loss of profit which may arise from reliance on any information supplied by Everest Fortune Group.
USD/CAD Eyes Breakout Above 1.38 as Weekly MACD Flashes BullishUSD/CAD Eyes Breakout Above 1.38 as Weekly MACD Flashes Bullish Signal
USD/CAD Weekly Technical Outlook
The pair is approaching a key resistance zone around 1.3800 . A weekly close above this level could signal a push toward the 1.4000 handle, opening the door for a longer-term bullish breakout and potential buy-and-hold scenario.
From the downside, a break below 1.3500 would likely trigger Canadian dollar strength, possibly driving the pair much lower.
MACD Confirmation:
The weekly MACD is crossing above the histogram from below, which is typically a bullish momentum signal. This supports the idea of a developing uptrend and could mark the beginning of a sustained move higher—especially if accompanied by strong volume.
Fundamental Backdrop:
The recent surge in U.S. Treasury demand reflects heightened risk-off sentiment and USD strength, which may continue to support the upside in USD/CAD in the near term.

USDCAD Is Bearish! Sell!
Please, check our technical outlook for USDCAD.
Time Frame: 7h
Current Trend: Bearish
Sentiment: Overbought (based on 7-period RSI)
Forecast: Bearish
The market is trading around a solid horizontal structure 1.377.
The above observations make me that the market will inevitably achieve 1.369 level.
P.S
We determine oversold/overbought condition with RSI indicator.
When it drops below 30 - the market is considered to be oversold.
When it bounces above 70 - the market is considered to be overbought.
Disclosure: I am part of Trade Nation's Influencer program and receive a monthly fee for using their TradingView charts in my analysis.
Like and subscribe and comment my ideas if you enjoy them!

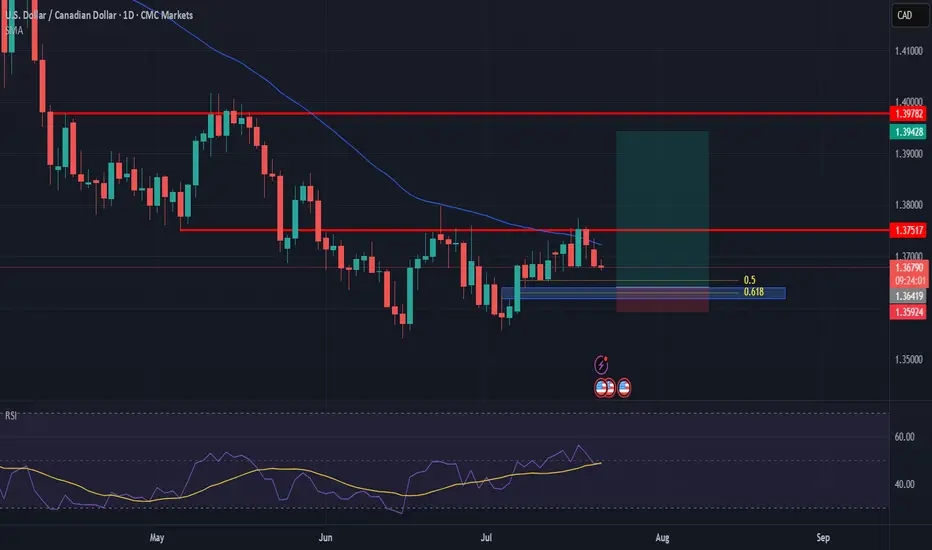
USDCAD possible 300pips ideaWe have this double bottom formation, re-tested the neckline at 1.3750
We could see a higher low forming around the 50% to 61% fib.
So area of interest to go long here would be at 1.3650 to 1.3620
Will update if oportunity to get in shows up.
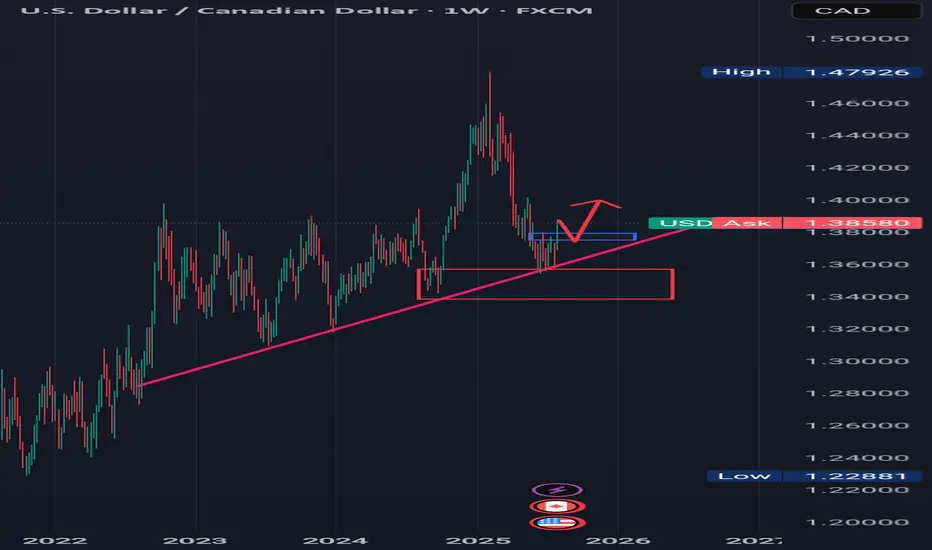
TREND REVERSAL CONFIRMATION Looking at the weekly timeframe for USDCAD, we can see that price action has respected a rising trendline and also reacted to a weekly bullish order block.
The Sell momentum for USDCAD has come to an end, so now we saw price action accumulating around the rising trend line and bullish order block.
Now there's a minor resistance which is indicated with a small blue rectangle in which price action has broken to the upside, I'm expecting price to complete an impulse correction leg or retrace to the blue rectangle or minor resistance and then from there continue to the upside.
........,...,.............................................
Please share your thoughts on this analysis, do you think the downward trend is over.
USDCAD BUY OPPORTUNITY Price is looking quite interesting for a buy opportunity from the current market price. We can see how price recently rebounded from the dynamic resistance and support trendline. It’s signaling a possible buy opportunity.

USDCADSupport Zone: Price has retested a strong support area
Price Action: The retest held — buyers defended it, showing rejection wicks / bullish candles.
Bias: Bullish while support holds → look for continuation to next resistance.
Invalidation: Bias weakens if support breaks and closes below the zone.
So as long as price stays above the retested support, USD/CAD remains bullish.