Weekly bearish Wolfewave PatternBears have already reached the 3:1 ratio target.
Those who are holding longer and are scaling out are still in play for the deeper targets.
USDCAD trade ideas

USDCAD - Continuation Trading Using Structure, Fibs & VolumeWHAT I'M LOOKING AT
After ending the week with a lower low & a lower close below a recent level of structure support, I'm predicting a potential bearish trend continuation opportunity here on the $USDCAD.
MY PREDICTION
If this prediction is correct I would expect a move down to the $1.35 psychological level (or right around it) as we have a confluence from both our Fibonacci extension & a spike in horizontal volume.
HOW TO GET INVOLVED
To get involved in this move I'll be looking for a a potential retracement/pullback followed by a clear sign of reversal. The 2 price levels that I have on my radar are $1.3750's & $1.3800's
If you have any questions, comments, or just want to share your views, please do so below!
Akil

USDCAD Short Setup – Support Broken, More Downside Ahead?Bias: ✅ Strong Sell
Timeframe: 4H
Pair: USDCAD
Week: 26–30 May 2025
⸻
🔍 Technical Setup:
USDCAD just broke a major support zone around 1.3732, opening the door for continued downside into the next demand zone.
• Entry: Break and retest or continuation below 1.3732
• Stop Loss: Above resistance at 1.3813
• Take Profit: Next support near 1.3467
• Risk-Reward Ratio: ~3.9R
• Structure: Lower highs, clean breakdown, bearish momentum
⸻
🧠 Macro Confluence:
• 📉 USD Weakness: Dovish Fed, weak macro outlook (Investogenie Score 1.8 ↓)
• 🇨🇦 CAD Recovery: Hawkish BoC, conditional score surged from 2 → 10
• 📊 Seasonals: CAD favored
• 🧾 COT: Net bearish shift in USD, CAD corrective phase expected
• ⚠️ News Risk: CAD GDP & US GDP this week could accelerate the move
⸻
⚠️ Risk Notes:
• Watch for FOMC and GDP reports before scaling positions
• Break & close confirmed – trail stops on lower timeframe
⸻
📌 Momentum is in favor – ride the breakdown, but stay data-aware.
Share setups or feedback below 👇

USDCAD short Market structure bearish on HTFs 3
Entry at Weekly and Daily AOi
Weekly Rejection At AOi
Daily Rejection At AOi
Previous Structure point Weekly
Around Psychological Level 1.38500
H4 Candlestick rejection
Rejection from Previous structure
Levels 5.11
Entry 105%
REMEMBER : Trading is a Game Of Probability
: Manage Your Risk
: Be Patient
: Every Moment Is Unique
: Rinse, Wash, Repeat!
: Christ is King.

How to Rob the Bank (of Canada) – Legally! (USD/CAD Swing Trade)🌍 Hello Global Traders! 🌟
Money Makers, Risk Takers, and Market Shakers! 🤑💸✈️
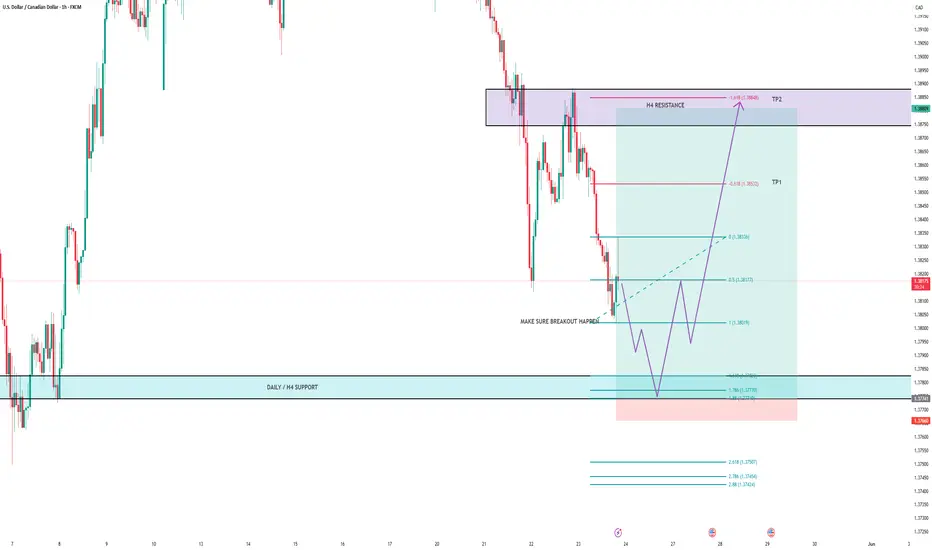
Dive into our USD/CAD "The Loonie" Forex heist, crafted with the signature 🔥Thief Trading Style🔥, blending sharp technicals and deep fundamentals. Follow the strategy outlined in the TradingView chart, focusing on a long entry targeting the high-risk MA Zone. Expect a wild ride with overbought conditions, consolidation, and potential trend reversals where bearish players lurk. 🏆💰 Celebrate your wins, traders—you’ve earned it! 💪🎉
Entry 📈: The vault’s open! Grab bullish opportunities at any price, but for precision, set buy limit orders on a 15 or 30-minute timeframe near swing lows or highs for pullback entries.
Stop Loss 🛑:
📍 Place your Thief SL at the recent swing low on the 4H timeframe (1.38500) for scalping or day trades.
📍 Adjust SL based on your risk tolerance, lot size, and number of open orders.
Target 🎯: Aim for 1.42500
💵 USD/CAD "The Loonie" is riding a bullish wave, fueled by key market drivers. ☝
Unlock the full picture—dive into Fundamentals, Macro Insights, COT Reports, Quantitative Analysis, Sentiment Outlook, Intermarket Trends, and Future Targets. Check 👉🌎🔗.
⚠️ Trading Alert: News & Position Management 📰🚨
News can shake the market hard. Protect your trades by:
Avoiding new entries during news releases.
Using trailing stops to lock in profits and shield running positions.
📌 Markets move fast—stay sharp, keep learning, and adapt your strategy as conditions evolve.
💖 Power up our heist! 🚀 Tap the Boost Button to amplify our Thief Trading Style and make stealing profits a breeze. Join our crew, grow stronger, and conquer the markets daily with ease. 🏆🤝❤️
Catch you at the next heist, traders—stay ready! 🤑🐱👤🤩

USDCAD: Weekly AnalysisThe last week sharp fall of the pair was not irrelated to US-Iran negotiations.
Possible war in Persian Gulf means higher prices in oil and more raises in CAD.
The indicated levels are determined based on the most reaction points and the assumption of approximately equal distance between the zones.
Some of these points can also be confirmed by the mathematical intervals of Murray.
You can enter with/without confirmation. IF you want to take confirmation you can use LTF analysis, Spike move confirmation, Trend Strength confrimation and ETC.
SL could be placed below the zone or regarding the LTF swings.
TP is the next zone or the nearest moving S&R, which are median and borders of the drawn channels.
*******************************************************************
Role of different zones:
GREEN: Just long trades allowed on them.
RED: Just Short trades allowed on them.
BLUE: both long and short trades allowed on them.
WHITE: No trades allowed on them! just use them as TP points

USDCAD: Bearish Continuation Ahead 🇺🇸🇨🇦
USDCAD completed a consolidation within a horizontal range.
A violation of its support and a daily candle close below that
is a strong bearish signal.
I believe that the price may drop lower next week
and reach at least 1.3655 level.
❤️Please, support my work with like, thank you!❤️
I am part of Trade Nation's Influencer program and receive a monthly fee for using their TradingView charts in my analysis.

USDCAD SHORTThe price broke the structure with impulse move and retraced. The price found resistance in previous low (inside resistance), where we have a 38.2% Fibonacci retarcement level, as well as 50MA, after that price broke the correction, so i expect the price move further to the downside.
ENTRY: 1.3860
TP 1.3800
SL 1.3889
#technicalanalysis #usdcad #short

Follow Iran news to take advantage of USDCAD:Dear Traders,
follow Iran news! Really do that! Again, Trump negotiations could change everything!
How? It's all about oil! any war in the Middle east could rise the oil prices and Loonie will pump!
So, any bad news about the US-Iran negotiations, I'll take long trades with cautions. and I'll be ready to take short from any possible Zones.
If everything goes normal, I'm ready to take Long/Short after confirmation from the Green and the Blue zones.
Expectations: (Just for normal situations, A war in middle east I'll short the pair)
The Green zone is not suitable for short trades.
The White zone is not suitable for any trades.
After all, 71Billion $ for Canda economy is considerable. Persian Gulf is one of the most important energy hubs of the world.

USDCADKey Reasons for CAD Strengthening Today
Market-Wide US Dollar Weakness
The CAD gained sharply against the USD, rising about 1% and reaching seven-month highs, largely driven by broad US dollar weakness rather than strong Canadian data alone.
Renewed tariff threats from US President Donald Trump against the EU and tech companies fueled risk-off sentiment, weakening the USD and benefiting the CAD as a commodity-linked currency.
Mid-Tier Canadian Economic Data and Oil Prices
Although Canadian economic data this week has been mostly mid-tier and not spectacular, the market focused on stable fundamentals like retail sales and trade balance, which support the currency.
Canada’s oil prices, a major export driver, remain supportive, helping underpin the CAD’s value.
Inflation and Interest Rate Expectations
Canada’s inflation remains somewhat elevated but controlled, with the Bank of Canada (BoC) expected to maintain relatively higher interest rates compared to other economies. This attracts capital inflows and supports the CAD.
The BoC’s stance contrasts with expectations of US Federal Reserve easing, contributing to the interest rate differential favoring the CAD.
Improved Trade Outlook and Economic Resilience
Talks between US and Canadian officials have eased some trade uncertainties, reducing risks to Canadian exports.
Canada’s trade deficit narrowed recently, and GDP growth showed resilience in key sectors, supporting market confidence in the CAD.
Risk-On Sentiment and Global Capital Flows
Investors’ risk appetite improved amid easing fears of a US recession and trade war escalation, leading to increased demand for risk-sensitive currencies like the CAD.
Risk-On Market Sentiment Encourages investment in CAD
USD and CAD Interest Rate Differential and 10-Year Bond Prices (May 2025)
Interest Rate Differential
The US 10-year Treasury yield is approximately 4.54% (recent 2025 data).
The Canadian 10-year Government Bond yield is slightly lower, around 3.50% to 3.60% (typical range in early 2025).
This creates an interest rate differential of roughly 0.9% to 1.0% in favor of the US.
Impact of Interest Rate Differential
The widening interest rate gap, with US yields higher than Canadian yields by about 1 percentage point, has contributed to a modest depreciation of the Canadian dollar (CAD) against the US dollar (USD) since late 2024.
Investors find US assets more attractive due to higher yields, leading to capital flows into USD and downward pressure on CAD.
The Bank of Canada’s expected policy rate is around 2.5% by end-2025, while the US Federal Reserve’s expected rate is higher near 3.75–4.0%, reinforcing the yield advantage for USD assets.
10-Year Bond Prices
Bond prices move inversely to yields. With US 10-year yields higher, US bond prices have declined relative to Canadian bonds.
The higher US yields reflect tighter monetary policy and stronger economic outlook compared to Canada, where monetary policy is expected to be more accommodative.
This divergence in bond prices and yields supports the USD’s relative strength versus CAD
USD/CAD Exchange Rate and Market Sentiment
USD/CAD has been trading in a broad range in 2025, with forecasts varying between 1.25 and 1.45 for the year.
The Canadian dollar is considered overvalued by about 9 cents relative to the USD, according to some models.
Market analysts expect the USD to maintain moderate strength against CAD due to the interest rate differential and divergent monetary policies.
Summary Table
Metric USD CAD
10-Year Bond Yield (%) ~4.54% ~3.50–3.60%
Interest Rate Differential +0.9% to 1.0% (USD over CAD) —
Bond Price Trend Lower (due to higher yield) Higher (due to lower yield)
Exchange Rate (USD/CAD) Stronger USD Weaker CAD
Conclusion
Today’s CAD strength was largely driven by broad US dollar weakness amid renewed trade tensions and tariff threats, combined with stable Canadian economic fundamentals and supportive oil prices. While Canadian data was not overwhelmingly strong, it was sufficient to maintain investor confidence, especially against a weakening USD, resulting in a notable rally in the Canadian dollar.
The higher US 10-year bond yields relative to Canada’s have contributed to a significant interest rate differential (~1%), favoring USD assets. This has led to USD strength against CAD and lower US bond prices compared to Canadian bonds. The ongoing divergence in monetary policy outlooks between the Federal Reserve and the Bank of Canada underpins this trend, influencing currency flows and bond market dynamics in 2025.

USDCAD: 1D Death Cross signals more selling.USDCAD is almost oversold on its 1D technical outlook (RSI = 31.307, MACD = -0.005, ADX = 41.498) as it is having one of the strongest red 1D candles of 2025, which is dominated by a Channel Down pattern. The market formed today a 1D Death Cross and since the new bearish wave started on a 1D MA200 rejection, we expect the selling to continue despite the oversold technical condition. Short and aim for a new -3.80% decline TP = 1.35000.
## If you like our free content follow our profile to get more daily ideas. ##
## Comments and likes are greatly appreciated. ##

USD/CAD 1.4000 Rejection -> 2025 LowsUSD-weakness was back in a big way this week and even as other pairs had yielded to the USD-breakout into last Monday, with fresh lows in EUR/USD and fresh highs in USD/JPY - USD/CAD retained its bearish structure with a hold of resistance right at the 1.4000 level.
Price is now 250ish pips lower as sellers have went back to work and there's potential for breakdown scenarios given this hold near support following a pullback to the big figure. For those looking to work with pullbacks, there's now resistance potential at prior swing lows 1.3814 and then 1.3846, and USD/CAD remains one of the more attractive venues for a continuation of Dollar weakness as we move towards the final week of May trade. - js

USDCAD Wave Analysis – 23 May 2025
- USDCAD reversed from strong resistance area
- Likely to fall to support level 1.3755
USDCAD currency pair recently reversed down from the strong resistance area between the round resistance level 1.4000 intersecting with the upper daily Bollinger Band and the resistance trendline of the daily down channel from March.
The downward reversal from this resistance area started the C-wave of the active ABC correction (2).
USDCAD currency pair can be expected to fall to the next support level 1.3755 (the former low from the start of May and the target for the completion of the active ABC correction (2)).

USDCAD Is Bullish! Buy!
Take a look at our analysis for USDCAD.
Time Frame: 10h
Current Trend: Bullish
Sentiment: Oversold (based on 7-period RSI)
Forecast: Bullish
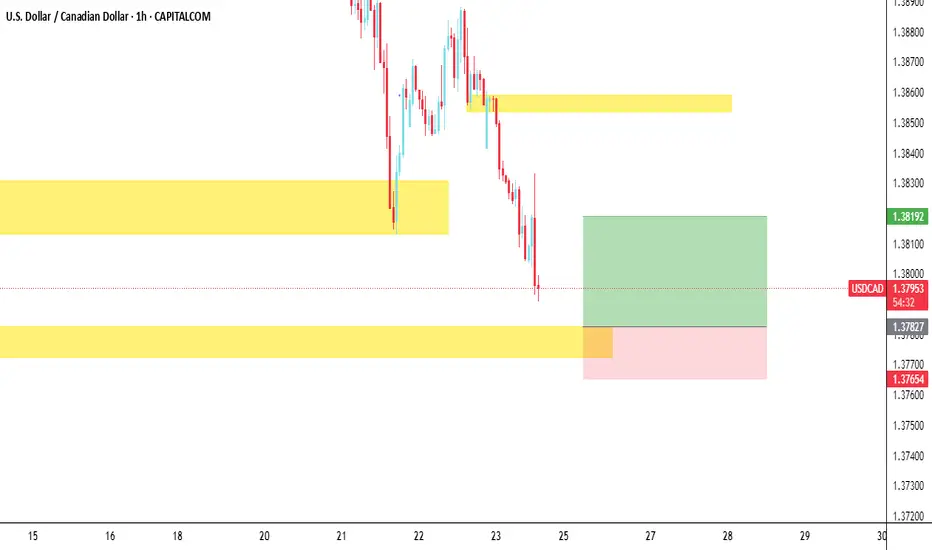
The market is on a crucial zone of demand 1.379.
The oversold market condition in a combination with key structure gives us a relatively strong bullish signal with goal 1.387 level.
P.S
The term oversold refers to a condition where an asset has traded lower in price and has the potential for a price bounce.
Overbought refers to market scenarios where the instrument is traded considerably higher than its fair value. Overvaluation is caused by market sentiments when there is positive news.
Disclosure: I am part of Trade Nation's Influencer program and receive a monthly fee for using their TradingView charts in my analysis.
Like and subscribe and comment my ideas if you enjoy them!

USD/CAD - Triangle Breakout (23.05.2025)The USD/CAD Pair on the M30 timeframe presents a Potential Selling Opportunity due to a recent Formation of a Triangle Breakout Pattern. This suggests a shift in momentum towards the downside in the coming hours.
Possible Short Trade:
Entry: Consider Entering A Short Position around Trendline Of The Pattern.
Target Levels:
1st Support – 1.3792
2nd Support – 1.3760
🎁 Please hit the like button and
🎁 Leave a comment to support for My Post !
Your likes and comments are incredibly motivating and will encourage me to share more analysis with you.
Best Regards, KABHI_TA_TRADING
Thank you.
Disclosure: I am part of Trade Nation's Influencer program and receive a monthly fee for using their TradingView charts in my analysis.

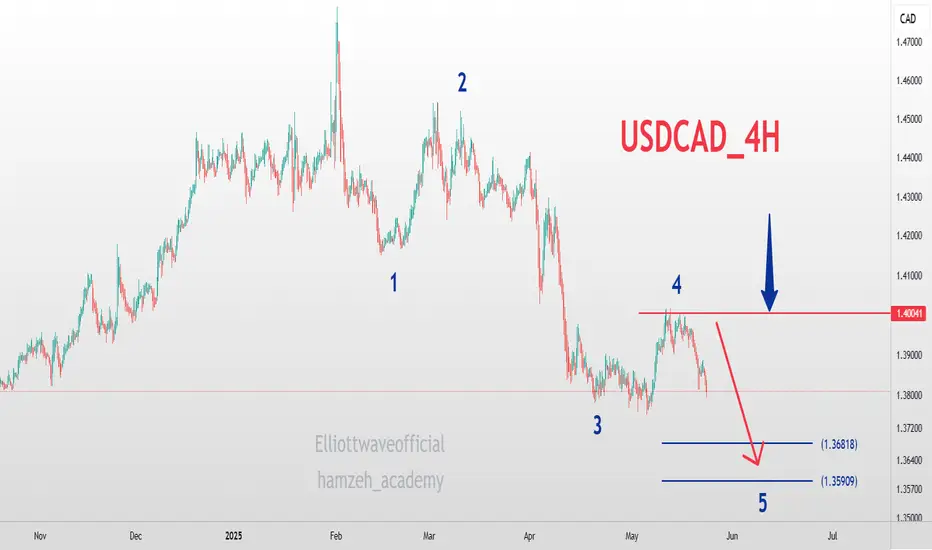
USDCAD_4H_SellCanadian Dollar Analysis Four-hour and medium-term time frame Elliott Wave Analysis Style Five waves down, with the top of wave 4 at 1.4000 and we are currently in wave 5 down towards the targets of 1.3680 and 1.3600
USDCAD WAITING FOR ACCURATE ZONE TO GO UPHi Traders,
Here my analysis on FX:USDCAD . Im waiting for the data release by Canada , Waiting to reach the blue zone before execute the trade.
Canada is forecast to record a decline in retail sales figures for March along with core data readings.
Have a Good Day Trader
USDCAD Massive Long! BUY!
My dear subscribers,
USDCAD looks like it will make a good move, and here are the details:
The market is trading on 1.3814 pivot level.
Bias - Bullish
My Stop Loss - 1.3784
Technical Indicators: Both Super Trend & Pivot HL indicate a highly probable Bullish continuation.
Target - 1.3877
About Used Indicators:
The average true range (ATR) plays an important role in 'Supertrend' as the indicator uses ATR to calculate its value. The ATR indicator signals the degree of price volatility.
Disclosure: I am part of Trade Nation's Influencer program and receive a monthly fee for using their TradingView charts in my analysis.
———————————
WISH YOU ALL LUCK

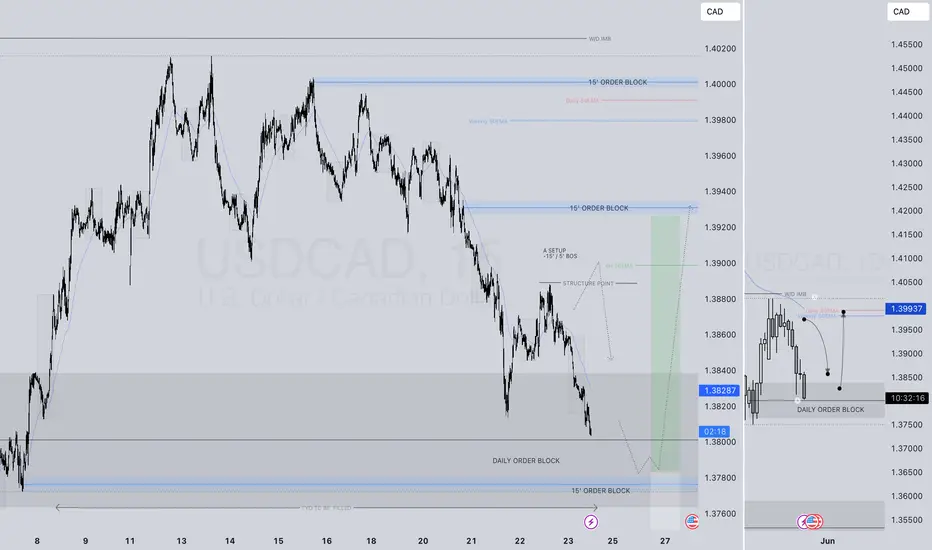
PERHAPS... USDCAD LONG FORECAST Q2 W21 D23 Y25PERHAPS... A REVERSAL BACK TO THE HTF 50EMA's
USDCAD LONG FORECAST Q2 W21 D23 Y25
Professional Risk Managers👋
Welcome back to another FRGNT chart update📈
Diving into some Forex setups using predominantly higher time frame order blocks alongside confirmation breaks of structure.
Let’s see what price action is telling us today!
💡Here are some trade confluences📝
✅Daily Order Block
✅Tokyo ranges to be filled
✅15' order block identified
✅Weekly 50 EMA
✅Daily 50 EMA
🔑 Remember, to participate in trading comes always with a degree of risk, therefore as professional risk managers it remains vital that we stick to our risk management plan as well as our trading strategies.
📈The rest, we leave to the balance of probabilities.
💡Fail to plan. Plan to fail.
🏆It has always been that simple.
❤️Good luck with your trading journey, I shall see you at the very top.
🎯Trade consistent, FRGNT X
USD/CAD Rate Drops Towards Yearly LowsUSD/CAD Rate Drops Towards Yearly Lows
The USD/CAD chart is currently showing clear signs of a bearish trend, characterised by a sequence of lower highs and lower lows (A→B→C→D→E→F→G).
This week’s decline suggests the downward structure may continue to develop, putting the current yearly low around the 1.3770 level at risk.
Why Is USD/CAD Falling?
On one hand, the US dollar remains under pressure:
→ Following last week’s downgrade of US debt ratings by Moody’s, investor attention has shifted to the country’s $36 trillion debt burden.
→ A tax bill backed by Donald Trump — recently passed in the Republican-controlled House of Representatives — could add trillions more to the national debt. Market participants may be increasingly concerned about the US’s fiscal outlook, prompting a shift towards safe-haven assets.
On the other hand, the Canadian dollar has strengthened this week relative to other major currencies. Tuesday’s CPI figures from Canada came in above analysts’ expectations and may be seen as a sign that the inflation surge could delay any potential rate cuts by the Bank of Canada.
USD/CAD Technical Analysis
In early May, we outlined a descending channel on the USD/CAD chart — a structure that remains relevant today.
The current price is hovering near the channel’s median line, which could indicate a temporary balance between supply and demand. However, with Canadian retail sales data due at 15:30 GMT+3 today, the risk of increased volatility remains high. A new weekly low cannot be ruled out.
This article represents the opinion of the Companies operating under the FXOpen brand only. It is not to be construed as an offer, solicitation, or recommendation with respect to products and services provided by the Companies operating under the FXOpen brand, nor is it to be considered financial advice.

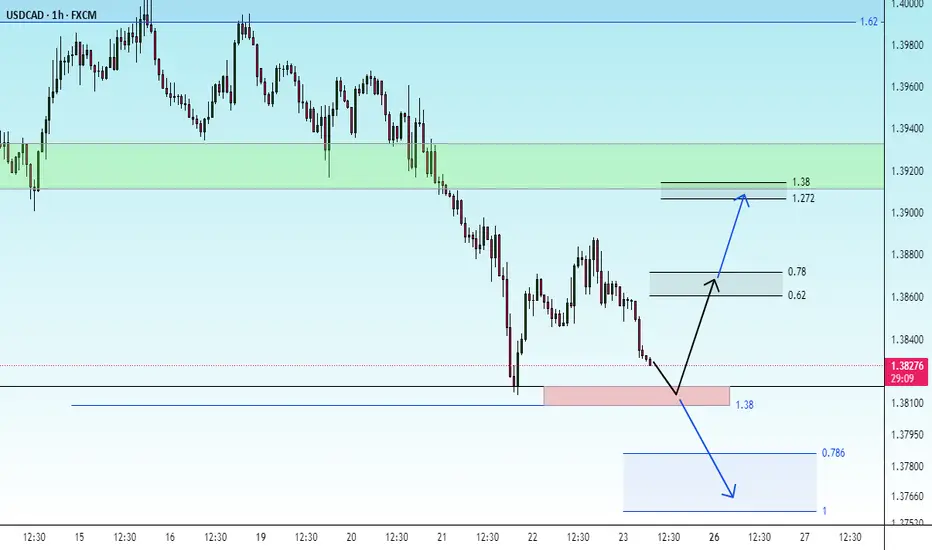
check the trendIt is expected that a trend change will occur within the specified support area and we will witness the beginning of an upward trend. Otherwise, if the support area is broken, the continuation of the downward trend is likely.
USDCAD taking two trades hear
reason behind that is simple market in down trend making LL LH as of now its in LL Zone and theirs no strong LH so just capturing that move with two trades
