USDCAD Bears Gain Momentum Below Resistance WallUSDCAD 8D TECHNICAL ANALYSIS
OVERALL TREND
📉 DOWNTREND — Confirmed by multiple moving averages stacked bearishly and recent breakdown from a Pivot High at 1.46560. The Trend Score reads -0.10, signaling growing bearish sentiment, though the current downtrend confidence is moderate (4.8%).
🔴RESISTANCE ZONE
🔴 1.47937 — PIVOT HIGH | SELL STOPLOSS
🔴 1.46560 — SELL ORDER 2
🔴 1.43772 — SELL ORDER 1
🎯ENTRIES & TARGETS
🎯 1.38464 — SELL ORDER & TP 1
🎯 1.34004 — SELL ORDER & TP 2 | Mid-Pivot
🎯 1.30718 — SELL ORDER & TP 3
🎯 1.25643 — EXIT SELL | TP 4
🟢SUPPORT ZONE
🟢 1.24442 — BUY ORDER 1
🟢 1.21463 — BUY ORDER 2
🟢 1.20070 — PIVOT LOW | BUY STOPLOSS
📊INDICATOR SUMMARY
RSI @ 37 — Near oversold, but neutral
MACD — Bearish divergence confirmed (Sell)
Momentum — Weak bullish rebound (Buy)
Stochastic %K — Neutral but nearing oversold (14.64)
Major Moving Averages — Mostly bearish alignment (20/30/50/100/200 EMAs & SMAs all showing Sell)
🤓STRUCTURAL NOTES
Bearish engulfing candle near 1.43772 resistance confirms sell-side pressure
Price rejected near the Pivot High zone (1.46560) and has broken below short-term support
EMA/SMA crossover downward confirms bearish acceleration
Volume Weighted MA also supports a downside continuation
TRADE OUTLOOK 🔎
📉 Short Bias — Valid below 1.43772 with target zones between TP1 @ 1.38464 and TP4 @ 1.25643
📈 Long setups only initiate below 1.24442 support bounce with confluence at the BUY STOP zone (1.20070)
👀 Watch price action at 1.38464 and 1.34004 — key decision zones for mid-trend reversal or continuation
🧪STRATEGY RECOMMENDATION
CONSERVATIVE APPROACH (Trend-Following):
— Entry: 1.43772 retest
— TP Levels: 1.38464 / 1.34004 / 1.30718 / 1.25643
— SL: Above 1.46560
AGGRESSIVE APPROACH (Breakout Pullback):
— Entry: On break and close below 1.38464
— TP: 1.34004 / 1.30718 / 1.25643
— SL: Above 1.40900
“Discipline | Consistency | PAY-tience™” — Let the chart speak and the setup confirm.
USDCAD trade ideas

USDCAD Long 4/24/2025USD/CAD Long Setup – 4H Demand Bounce + Fib Confluence Ahead of Jobless Claims
Looking to long USD/CAD based on a confluence of technical structure and macro catalysts.
Daily Chart:
Yesterday printed a bullish engulfing candle, signaling strong buyer intent and continuation of the broader uptrend.
4H Chart:
Price pulled back into a 61.8% Fibonacci retracement of the recent leg, aligning perfectly with a well-defined 4H demand zone.
Importantly, no 4H candle has closed below the body of the previous bullish engulfing, suggesting buyers are holding control.
Trade Expectation:
Expecting this to be a correction within a trend, not a reversal — looking for a continuation that retests the highs and pushes for a breakout beyond 1.3900.
Fundamental Catalyst:
Today’s U.S. unemployment claims release will be the key driver. A lower-than-expected print could fuel USD strength and send this pair accelerating to new short-term highs.
Target Zone:
First target is a retest of the recent high; extended target is a break above 1.3900, which opens the door to higher timeframe expansion.
Stop: Just below the 4H demand zone, respecting the structural invalidation of the Fib level.
This is a clean trend-continuation play with both technical alignment and fundamental tailwinds.

USDCAD buy setupHello! Friends,
Greetings. Please leave a Like if you like the idea.
Before start talking about technical Let's share your LOVE by giving me LIKES to support this work. Thanks in advance.

USD/CAD BUYERS WILL DOMINATE THE MARKET|LONG
Hello, Friends!
We are now examining the USD/CAD pair and we can see that the pair is going down locally while also being in a downtrend on the 1W TF. But there is also a powerful signal from the BB lower band being nearby indicating that the pair is oversold so we can go long from the support line below and a target at 1.387 level.
Disclosure: I am part of Trade Nation's Influencer program and receive a monthly fee for using their TradingView charts in my analysis.
✅LIKE AND COMMENT MY IDEAS✅

usdcad buy signal. Don't forget about stop-loss.
Write in the comments all your questions and instruments analysis of which you want to see.
Friends, push the like button, write a comment, and share with your mates - that would be the best THANK YOU.
P.S. I personally will open entry if the price will show it according to my strategy.
Always make your analysis before a trade

USDCAD (Long Setup)will be setting up my long scale in on usdcad here first entry at 1:2rr. this is not financial advice. happy trading
33

USDCAD at Risk? COT Turns Bearish📊 COT Overview – CAD & USD Futures
🇨🇦 Canadian Dollar (CAD)
Asset Managers: Still net short, but recovering fast → from -150K to nearly -50K.
Leveraged Money: Strong bullish reversal from -100K to -30K and climbing.
✅ Interpretation: Institutions are flipping bullish on CAD → Bearish pressure on USDCAD.
🇺🇸 US Dollar (USD)
Asset Managers: Cutting long exposure since March.
Leveraged Money: Losing conviction → neutral to slightly long.
⚠️ Interpretation: USD is structurally weakening → adding to the USDCAD bearish bias.
🧠 Technical Analysis
Price has returned to the key demand zone (1.3700–1.3850) for the third test.
Candles are compressing → signal of upcoming volatility.
RSI remains weak, no bullish divergence → no clear reversal yet.
📌 Key Levels:
Support: 1.3700 → A confirmed break opens space toward 1.3550–1.3480.
Resistance: 1.3950–1.4100
🎯 Trade Scenarios
🔻 Breakdown trade below 1.3700 → Target: 1.3480
🔁 Pullback short on rejection from 1.3950–1.4000 → SL above 1.4100
🔼 Long only with a bullish engulfing weekly close + RSI divergence
✅ Summary
COT Bias: Bearish USDCAD → CAD strengthening, USD weakening
Technical Structure: Support under pressure, breakout likely
Preferred Play: Short continuation on breakdown or pullback rejection

USD/CAD(20250424)Today's AnalysisMarket News:
The United States hit a 16-month low in April. The total number of new home sales in the United States in March was an annualized to a new high since September 2024.
Technical analysis:
Today's buying and selling boundaries:
1.3861
Support and resistance levels:
1.3966
1.3927
1.3901
1.3820
1.3794
1.3755
Trading strategy:
If the price breaks through 1.3901, consider buying, the first target price is 1.3927
If the price breaks through 1.3861, consider selling, the first target price is 1.3820

BUYING MOVEMENT IS TAKING PLACE ON USDCADIn this video I will be sharing my USDCAD analysis today, by providing my complete technical analysis by using candlesticks in order to have confidence over the market/control over your emotion no matter what the fundamentals are saying concerning the market, so you can watch it and improve your forex trading skill.

USDCAD SHORT Market structure bearish on HTFs 3
entry at both Daily and Weekly AOi
Weekly Rejection At AOi
Daily Rejection at AOi
Previous Daily Structure point
Around Psychological Level 1.38500
H4 Candlestick rejection
Rejection from Previous structure
Levels 4.49
Entry 105%
REMEMBER : Trading is a Game Of Probability
: Manage Your Risk
: Be Patient
: Every Moment Is Unique
: Rinse, Wash, Repeat!
: Christ is King.

Potential bullish rise?USD/CAD has reacted off the resistance level which is an overlap resistance and could rise from this level to our take profit.
Entry: 1.3844
Why we like it:
There is an overlap resistance level.
Stop loss: 1.3781
Why we like it:
There is a pullback support level.
Take profit: 1.4029
Why we like it:
There is a pullback resistance level that lines up with the 50% Fibonacci retracement.
Enjoying your TradingView experience? Review us!
Please be advised that the information presented on TradingView is provided to Vantage (‘Vantage Global Limited’, ‘we’) by a third-party provider (‘Everest Fortune Group’). Please be reminded that you are solely responsible for the trading decisions on your account. There is a very high degree of risk involved in trading. Any information and/or content is intended entirely for research, educational and informational purposes only and does not constitute investment or consultation advice or investment strategy. The information is not tailored to the investment needs of any specific person and therefore does not involve a consideration of any of the investment objectives, financial situation or needs of any viewer that may receive it. Kindly also note that past performance is not a reliable indicator of future results. Actual results may differ materially from those anticipated in forward-looking or past performance statements. We assume no liability as to the accuracy or completeness of any of the information and/or content provided herein and the Company cannot be held responsible for any omission, mistake nor for any loss or damage including without limitation to any loss of profit which may arise from reliance on any information supplied by Everest Fortune Group.

Daily Price Action: USDCAD Wednesday 4/23/2025In this video, we will be looking into the potential price action of USDCAD.

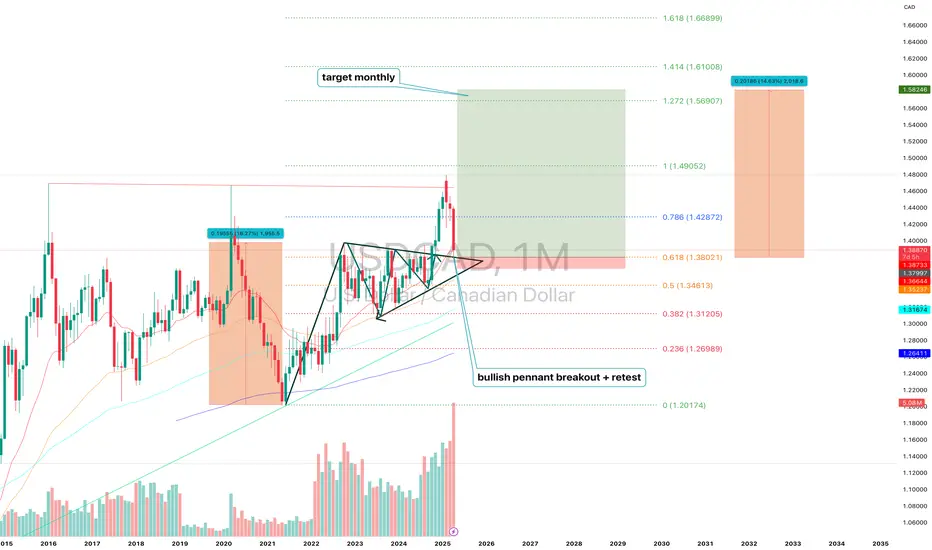
USDCAD (1M) Bullish Pennant Structure and H ProjectionUSDCAD (1M) — Technical and Fundamental Analysis: Bullish Pennant Structure and H Projection
On the monthly chart of USDCAD, a bullish pennant structure has been formed and confirmed with a breakout followed by a clean retest of the upper boundary. The price broke out of the consolidation zone with momentum and is currently holding above the key support at 1.3802. The structure remains active: the first target based on the projected move is 1.4905. If the impulse continues and the market structure remains intact, extended targets lie at 1.5690 (1.272), 1.6100 (1.414), and 1.6689 (1.618) Fibonacci expansions. Technically, the 1.3802 level (0.618 retracement) is the critical support. If this zone holds, the bullish scenario remains valid. The nearest resistance is 1.4287 (0.786), and a confirmed break above this level would likely trigger the next phase toward 1.49. Volume increased during the breakout, confirming strong buyer interest.
Fundamentally, the setup is supported by diverging monetary policies: the Bank of Canada has signaled a more dovish stance due to slowing inflation and economic softness, while the Federal Reserve remains more neutral and cautious about rate cuts. In addition, oil prices — a key factor for the Canadian dollar — are under pressure, weakening the CAD further. Broader macro uncertainty and the global demand for USD as a reserve and safe-haven asset continue to support the dollar, strengthening the USDCAD pair.
Conclusion: As long as the price holds above the 1.38 zone and confirms above 1.4287, the bullish structure remains in play with a target of 1.4905 and potential extensions to 1.5690–1.6100.
USDCAD Short 4/23/2025USD/CAD Short Setup – Break of Daily Demand + Textbook Triangle Unwind
This short is built off both macro fundamentals and multi-timeframe technical precision.
Daily Chart:
USD/CAD has been steadily breaking structure to the downside. Yesterday's close was significant — we broke below a major daily demand zone at 1.38221, signaling a shift in longer-term sentiment.
Today’s price action has already retested yesterday’s high into that broken zone — a classic break-and-retest setup.
4H Chart:
A clear 5-wave triangle correction is printing — text-book stuff. We’re nearing the breakout point. Price is pressing against the lower boundary, and momentum looks ready to shift.
A potential Evening Star pattern is forming right now, supported by an inside bar and a follow-up bearish hammer — a stacked reversal signal.
1H Chart:
Structure confirms the 4H — all signs point toward a correction completing and a new impulsive leg down beginning.
Fundamentals:
Later today, the U.S. Flash Manufacturing PMI is expected to show contraction — a negative for the dollar. If the data misses expectations, it could amplify the bearish move on USD/CAD.
We’re also tracking oil closely — further CAD strength via crude would accelerate the downside here.
Trade Plan:
Entry: Current area near the 1.382 retest
SL: Above triangle high
TP1: 1:1 R:R – partial take profit (75%)
TP2: Let the remaining 25% run with structure-based trailing
If the setup confirms post-PMI, this could be a strong follow-through play after a major HTF breakdown.

USDCAD buy setup H1Hello! Friends,
Greetings. Please leave a Like if you like the idea.
Before start talking about technical Let's share your LOVE by giving me LIKES to support this work. Thanks in advance.


USDCAD INTRADAY Downtrend continuation below 1.4060. The USDCAD pair is exhibiting a bearish sentiment, reinforced by the ongoing downtrend. The key trading level to watch is at 1.4060, which represents the current intraday swing low and the falling resistance trendline level.
In the short term, an oversold rally from current levels, followed by a bearish rejection at the 1.4060 resistance, could lead to a downside move targeting support at 1.3780, with further potential declines to 1.3730 and 1.3630 over a longer timeframe.
On the other hand, a confirmed breakout above the 1.4060 resistance level and a daily close above that mark would invalidate the bearish outlook. This scenario could pave the way for a continuation of the rally, aiming to retest the 1.4080 resistance, with a potential extension to 1.4160 levels.
Conclusion:
Currently, the USDCAD sentiment remains bearish, with the 1.4060 level acting as a pivotal resistance. Traders should watch for either a bearish rejection at this level or a breakout and daily close above it to determine the next directional move. Caution is advised until the price action confirms a clear break or rejection.
This communication is for informational purposes only and should not be viewed as any form of recommendation as to a particular course of action or as investment advice. It is not intended as an offer or solicitation for the purchase or sale of any financial instrument or as an official confirmation of any transaction. Opinions, estimates and assumptions expressed herein are made as of the date of this communication and are subject to change without notice. This communication has been prepared based upon information, including market prices, data and other information, believed to be reliable; however, Trade Nation does not warrant its completeness or accuracy. All market prices and market data contained in or attached to this communication are indicative and subject to change without notice.

USDCAD...SHORTOANDA:USDCAD
Analysis complete — scenarios outlined. The zone could be a decision point for . Price reaction here may define the next move.
If price breaks and pulls back to retest, a reversal setup might emerge.

USDCAD BUY*Trendline unbroken
* Weak sell side continuity
* Buying targeting reference point following a lower low broken
* Volume imbalance recovered

uptrendThe downtrend is expected to end at the current support area and we will see the start of the upward trend.
Otherwise, the downtrend is likely to continue to the next support levels.

USD/CAD H1 | Rising into a multi-swing-high resistanceUSD/CAD is rising towards a multi-swing-high resistance and could potentially reverse off this level to drop lower.
Sell entry is at 1.3849 which is a multi-swing-high resistance that aligns with the 38.2% Fibonacci retracement.
Stop loss is at 1.3915 which is a level that sits above the 61.8% Fibonacci retracement and an overlap resistance.
Take profit is at 1.3735 which is a support level that aligns with the 161.8% Fibonacci extension.
High Risk Investment Warning
Trading Forex/CFDs on margin carries a high level of risk and may not be suitable for all investors. Leverage can work against you.
Stratos Markets Limited (tradu.com):
CFDs are complex instruments and come with a high risk of losing money rapidly due to leverage. 63% of retail investor accounts lose money when trading CFDs with this provider. You should consider whether you understand how CFDs work and whether you can afford to take the high risk of losing your money.
Stratos Europe Ltd (tradu.com):
CFDs are complex instruments and come with a high risk of losing money rapidly due to leverage. 63% of retail investor accounts lose money when trading CFDs with this provider. You should consider whether you understand how CFDs work and whether you can afford to take the high risk of losing your money.
Stratos Global LLC (tradu.com):
Losses can exceed deposits.
Please be advised that the information presented on TradingView is provided to Tradu (‘Company’, ‘we’) by a third-party provider (‘TFA Global Pte Ltd’). Please be reminded that you are solely responsible for the trading decisions on your account. There is a very high degree of risk involved in trading. Any information and/or content is intended entirely for research, educational and informational purposes only and does not constitute investment or consultation advice or investment strategy. The information is not tailored to the investment needs of any specific person and therefore does not involve a consideration of any of the investment objectives, financial situation or needs of any viewer that may receive it. Kindly also note that past performance is not a reliable indicator of future results. Actual results may differ materially from those anticipated in forward-looking or past performance statements. We assume no liability as to the accuracy or completeness of any of the information and/or content provided herein and the Company cannot be held responsible for any omission, mistake nor for any loss or damage including without limitation to any loss of profit which may arise from reliance on any information supplied by TFA Global Pte Ltd.
The speaker(s) is neither an employee, agent nor representative of Tradu and is therefore acting independently. The opinions given are their own, constitute general market commentary, and do not constitute the opinion or advice of Tradu or any form of personal or investment advice. Tradu neither endorses nor guarantees offerings of third-party speakers, nor is Tradu responsible for the content, veracity or opinions of third-party speakers, presenters or participants.

USDCAD: Breakout & Bearish Continuation 🇺🇸🇨🇦
USDCAD broke and closed below a key intraday/daily horizontal support cluster.
I expect a bearish trend continuation after its retest.
Next goal - 1.376
❤️Please, support my work with like, thank you!❤️
I am part of Trade Nation's Influencer program and receive a monthly fee for using their TradingView charts in my analysis.

USDCADUSDCAD
- Completed " 12345 " Impulsive Waves
- Break of Structure
- Fibonacci Level - 38.20% - 50.00%
- Order Block
- Bullish Channel as an corrective pattern in Short Time Frame
