USD/CADThis is a trade setup for USD/CAD, based on volume and trend analysis.
Entry Price: 1.38614
Stop-Loss (SL): 1.38514
Take-Profit (TP): 1.38864
The trade is intended to be executed instantly at the mentioned price, in alignment with both volume behavior and the current trend direction.
Disclaimer: This setup is shared purely for backtesting purposes and to document trade ideas. It is not financial advice. Always perform your own analysis before making any trading decisions.
USDCAD trade ideas

USD/CAD potential leg up setuppotential setup. Trade Plan following Road Map:
-wait for pull back zone to enter.
-pull trigger on reversal signal. monitor declining volume as confirmation- "a spike in volume for pull back ending
-target 1 zone - 1.40 area. SL lock in +/- 50% of gains at key areas of structure on 15 minute chart.
-target 2 zone - on route to T2Z use 14 ema and 34 ema as trend continuation on 5 minute and 15 minute chart - key structure: SL zone

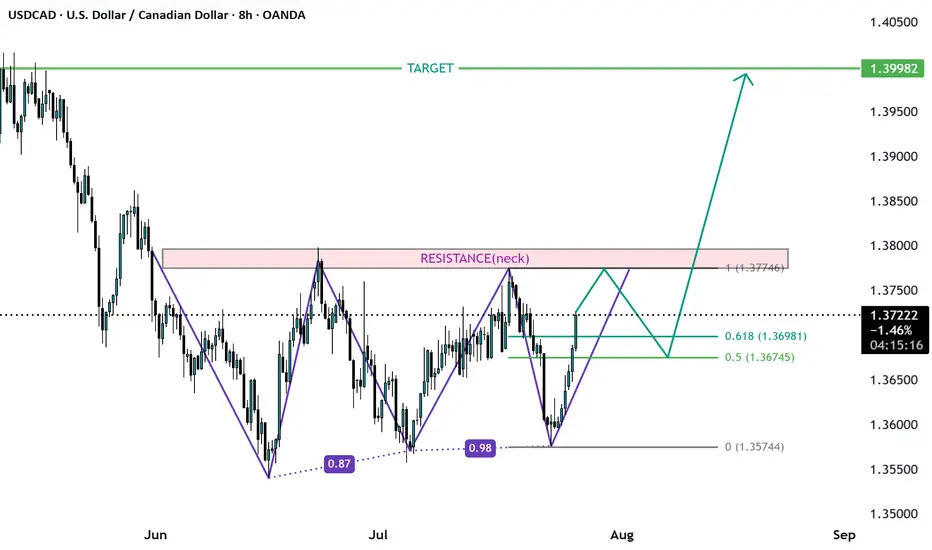
USDCAD Triple Bottom? Ready for long run?USDCAD formed a triple bottom on high time frame and is likely to Reach target of 1.4. the third bottom is also formed and is about finish soon the pattern. Enter the trade when the neck is broken or if the price come to 0.5 fib level from this bottom level.
USDCAD resistance breakout at 1.3767The USDCAD remains in a bullish trend, with recent price action showing signs of a corrective pullback within the broader uptrend.
Support Zone: 1.3730 – a key level from previous consolidation. Price is currently testing or approaching this level.
A bullish rebound from 1.3730 would confirm ongoing upside momentum, with potential targets at:
1.3830 – initial resistance
1.3860 – psychological and structural level
1.3890 – extended resistance on the longer-term chart
Bearish Scenario:
A confirmed break and daily close below 1.3730 would weaken the bullish outlook and suggest deeper downside risk toward:
1.3716 – minor support
1.3690 – stronger support and potential demand zone
Outlook:
Bullish bias remains intact while the WTI Crude holds above 1.3730. A sustained break below this level could shift momentum to the downside in the short term.
This communication is for informational purposes only and should not be viewed as any form of recommendation as to a particular course of action or as investment advice. It is not intended as an offer or solicitation for the purchase or sale of any financial instrument or as an official confirmation of any transaction. Opinions, estimates and assumptions expressed herein are made as of the date of this communication and are subject to change without notice. This communication has been prepared based upon information, including market prices, data and other information, believed to be reliable; however, Trade Nation does not warrant its completeness or accuracy. All market prices and market data contained in or attached to this communication are indicative and subject to change without notice.

Buy usdcadOur last buying idea already running 100+ pips in buy
In my view usdcad ready to break this resistance
It can be today and next month candel
Weekly and monthly already oversold pair
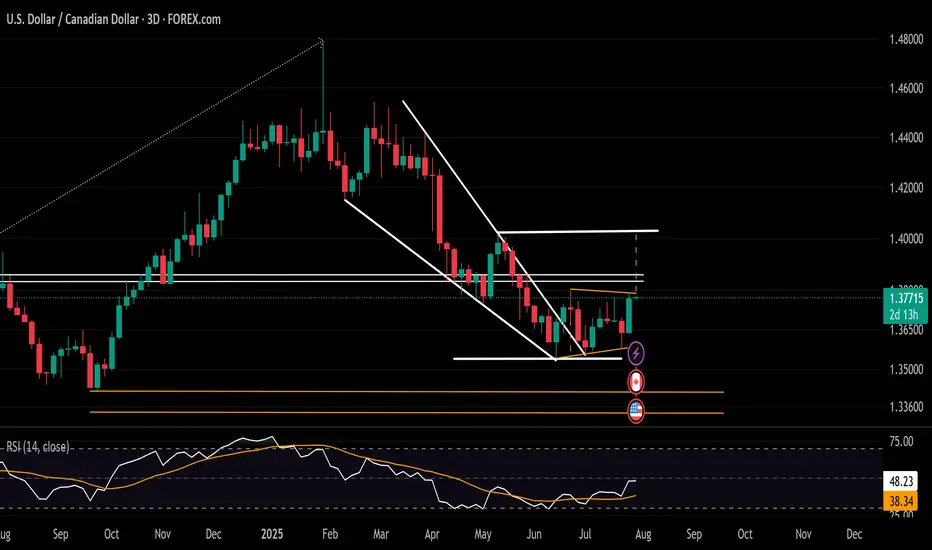
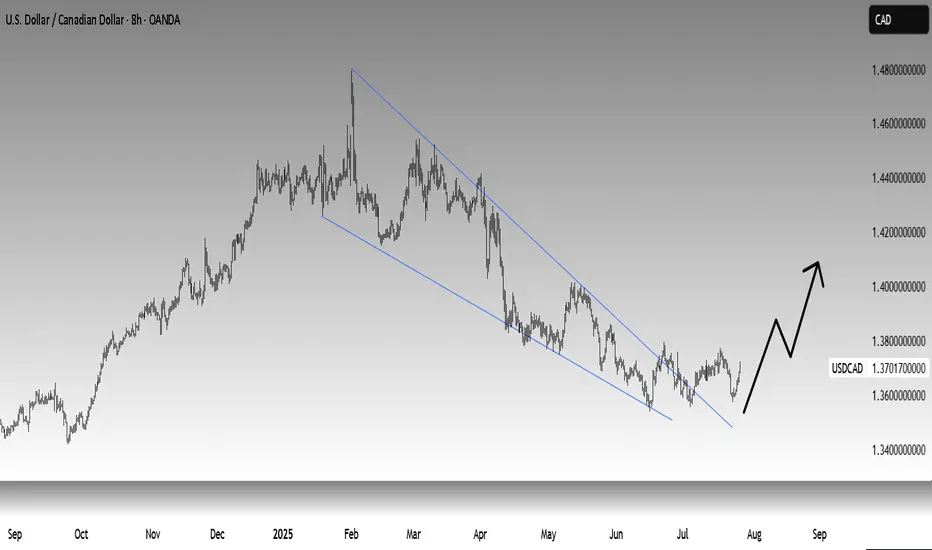
USDCAD Rebound Steadies Ahead of BOC and FOMC MeetingsAligned with the DXY holding above the 96 support and approaching the 100-resistance, the USDCAD is maintaining a rebound above the 1.3540 level.
It has maintained a hold beyond the boundaries of a contracting downtrend across 2025 and is aiming for the 1.38 resistance to confirm a steeper bullish breakout.
A sustained move above 1.38, which connects lower highs from June and July, while the RSI holds below the 50 neutral line, could extend gains toward the 1.40 level.
From the downside, should the breakout above 1.38 fail, the pair may remain trapped within the consolidation range extending from June, with initial support seen at 1.3580.
Written by Razan Hilal, CMT
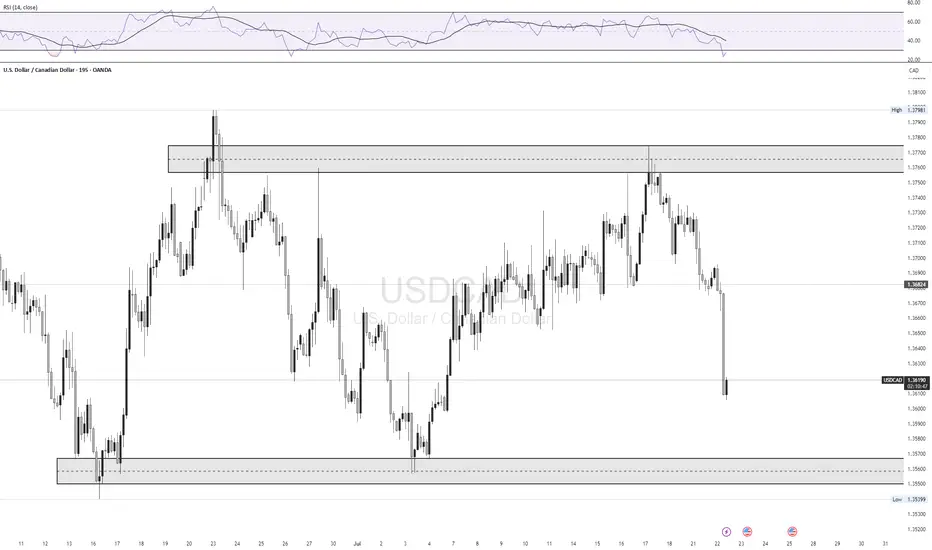
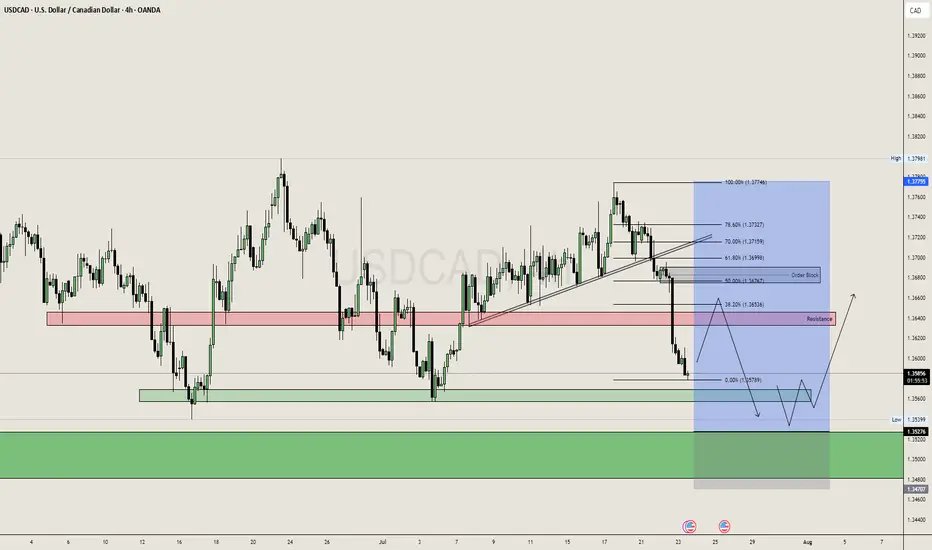
USD/CAD LongLooking for a retest of 1.35600 zone for a bounce back up to 1.37650 supply zone
FX:USDCAD
Check the trend Given that there is a possibility of a triangle pattern forming, it is expected that the price will change direction at the current resistance level and a downtrend will begin. If the price consolidates above the green resistance level, the uptrend will likely continue.

USDCAD Bounce May Face Strong ResistanceUSDCAD is attempting to bounce back, supported by a stronger U.S. dollar index. The recent trade deals with Japan and the Eurozone have prompted traders to position more favorably toward the dollar. The sharp decline in EURUSD is also putting upward pressure on USDCAD.
This week will be crucial for both the U.S. and Canada, with a flood of economic data and major central bank events ahead. The Federal Reserve and the Bank of Canada are both expected to hold rates at tomorrow’s meetings. Although pressure from Trump is unlikely to sway FOMC members into a rate cut, the new trade deals do reduce policy uncertainty, which could increase the likelihood of a rate cut in September. Any minor hint of this scenario will likely be interpreted as dovish by the markets.
The Bank of Canada, in contrast, is expected to remain firmly dovish as tariffs continue to weigh heavily on growth. Meanwhile, Trump’s recent comments regarding Canadian tariffs are unlikely to boost economic confidence in Canada, although Carney is actively pushing for an improved trade agreement.
Aside from central bank meetings, both countries will release GDP data this week. Canada’s economy is expected to contract by 0.1% in May, with GDP figures arriving alongside employment change and the U.S. PCE report. A strong surprise from Canada could help limit the effect of the rising dollar index on USDCAD.
In the U.S., GDP, PCE, and payrolls data will make this one of the most unpredictable weeks for markets in recent months.
USDCAD is currently testing its 100-week moving average. The immediate resistance levels are 1.3786 and 1.3850, both marked as “1” in the chart as the first resistance area. If dollar index strength continues after the initial shock, the second resistance zone defined by the May top and the 50-week moving average will become the next target.
If dollar dominance persists in the medium term, the ultimate target would be 1.4170. This area is likely to act as strong resistance, as it includes the midpoint of the March to July pullback, the 23.6% Fibonacci retracement level of the 2021 to 2025 uptrend, and the February dip.
As long as this resistance holds, any upward moves can be considered potential selling opportunities. However, it remains uncertain which of the resistance levels will mark the top.

USDCAD USDCAD has entered a range since the start of June.
retesting very strong resistance levels again.
creating a rising wedge reversal at this key high level of resistance.
looking for a sell off

USDCAD 1H buyHello friends. If the price in USDCAD returns to the specified area on the 1h timeframe, it is suitable for a buy position.
This is just a theory

USD/CAD Institutional Buy Zone – Thief Trading Alert!🔥 USD/CAD "LOONIE BANK HEIST" 🔥 – THIEF TRADING STYLE (BULLISH SNIPER PLAN)
💸 ATTENTION: Market Robbers & Profit Pirates!
"Steal Like a Pro – Escape Before the Cops Arrive!"
🎯 MASTER TRADE PLAN (Based on Thief Trading Tactics):
Entry Zone (Pullback Heist):
📌 Pullback-1: Market Maker Trap Zone (1.35400+) – Wait for retest!
📌 Pullback-2: Institutional Buy Zone (1.33500+) – Confirm bullish momentum!
"Patience = Perfect Heist Timing. Don’t rush—ambush the trend!"
🎯 Profit Target: 1.38100 (or escape earlier if momentum fades).
🛑 Stop Loss (Escape Route): Nearest 4H Swing Low (wick/close) – Adjust based on risk & lot size!
🚨 SCALPERS’ WARNING:
"Only snipe LONG! Big pockets? Strike now. Small stack? Join swing robbers & trail your SL!"
📉 WHY THIS HEIST? (Bullish Triggers):
Technical + Fundamental alignment (COT, Macro, Sentiment).
Overbought but institutional demand holding strong.
"Bears are trapped—time to rob their stops!"
⚠️ CRITICAL ALERT:
News = Volatility = Police Ambush!
Avoid new trades during high-impact news.
Trailing SL = Your Getaway Car! Lock profits before reversals.
💥 BOOST THIS HEIST!
"Hit 👍, 🔔 Follow, and 🚀 Boost to fuel our next robbery! Let’s drain the banks together!"
🔮 NEXT HEIST COMING SOON… Stay tuned, partner! 🎭💰

USDCAD – Bullish OutlookThe US Dollar continues to show strength against the Canadian Dollar. Price closed firmly at 1.3700, signaling strong bullish momentum and potential continuation.
📈 Trade Idea: Long USDCAD
🔹 Entry: 1.3700
🔹 Targets:
First Target: 1.3800
Second Target: 1.3900
Extended Target: 1.4000+
Strong USD fundamentals, coupled with technical strength on higher timeframes, support further upside in this pair. Watching for bullish follow-through and potential breakout above recent resistance.
USDCAD analysis 1day frame We have bat 🦇 pattern and also ob ..I expect from this area 1.35114-1.34500 go buy for long to the targets in the chart

USDCAD Wave Analysis – 25 July 2025
- USDCAD rising inside sideways price range inside
- Likely to reach resistance level 1.3800
USDCAD currency pair recently reversed from the key support level 1.3575 (which is the lower boundary of the sideways price range inside which the price has been trading from June).
The upward reversal from the support level 1.3575 created the daily Japanese candlesticks reversal pattern Morning Star.
USDCAD currency pair can be expected to rise to the next resistance level 1.3800 (upper border of this sideways price range, top of wave (2)).

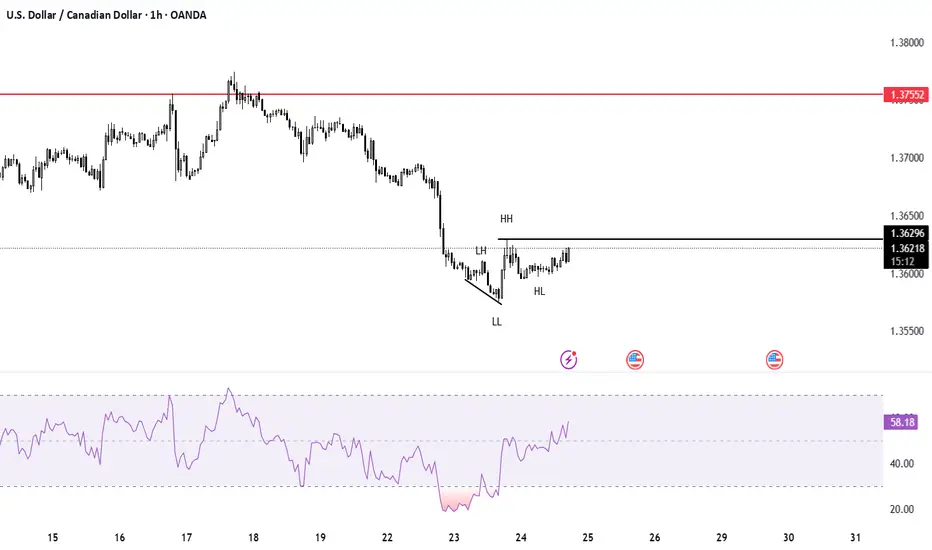
USDCAD SELLUSD/CAD rallies to 1.3680 as the market focuses on a hawkish Fed
The US Dollar extends its recovery for the second consecutive day, supported by strong US data. Upbeat US business activity and Jobless Claims support the Fed's "wait and see" rhetoric. In Canada, the weak Retail Sales data keep hopes for a BoC rate cut alive.
The year will be politically marked by Trump’s return to the White House. A Republican government is seen as positive for financial markets, but Trump’s pledge to cut taxes and impose tariffs on foreign goods and services may introduce uncertainty to both the political and economic landscape.
Canada’s political crisis peaked in late 2024 with a no-confidence vote against Prime Minister Justin Trudeau, leading to snap elections and a weakened Liberal minority government. Policy uncertainty and economic challenges dominate 2025’s outlook, raising concerns over market stability and investor confidence.
The BoC is set to continue easing interest rates through 2025, at least at a faster pace than the Fed is expected to, which could apply pressure on CAD’s already-rising rate differential.
SUPPORT 1.36991
SUPPORT 1.36739
SUPPORT 1.36495
RESISTANCE 1.37346
RESISTANCE 1.37455

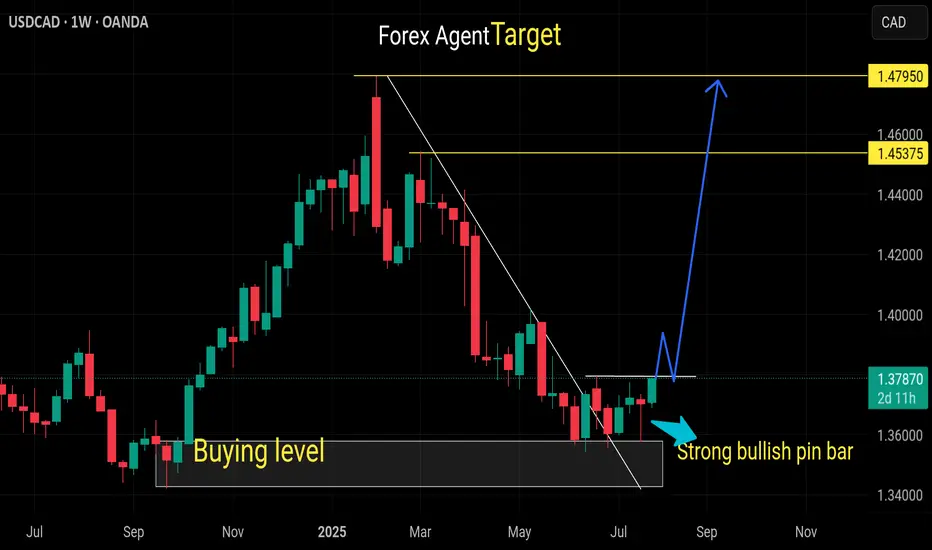
Long USDCADUCAD has showed good candlestick formation, rejects on trendline. I am going to buy this, targeting to fibo 4.23.

usdcad swing trade long3 bull points
Rsi div
Trend reversal
Double bottom at 1D timeframe
RRR 1:2
hold for more longer but with proper risk management..
USDCAD, we can see a pullbackUSDCAD is in Range in Daily, and daily range is enough to capture 200-250 pips. So keeping that in mind we can plan a buy trade USDCAD from the Daily Demand Area 1.3500 - 1.3550 Area.
And 1H Trend is Bearish So we can also look for the Sell from the 1.3650 aka Resistance Zone (4H), but after this selling move it is risky to sell at current price i.e. 1.3580 So wait for fib area or look for buys only from Demand Zone.
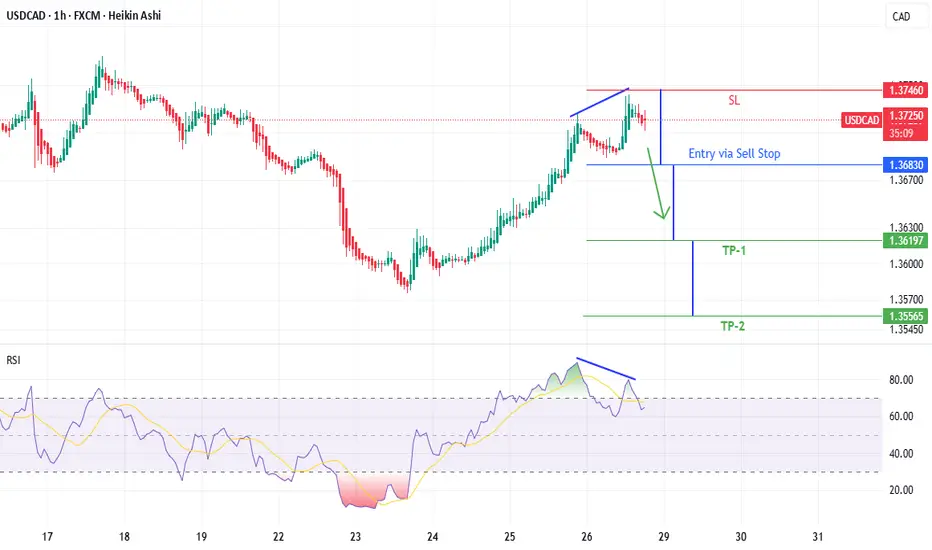
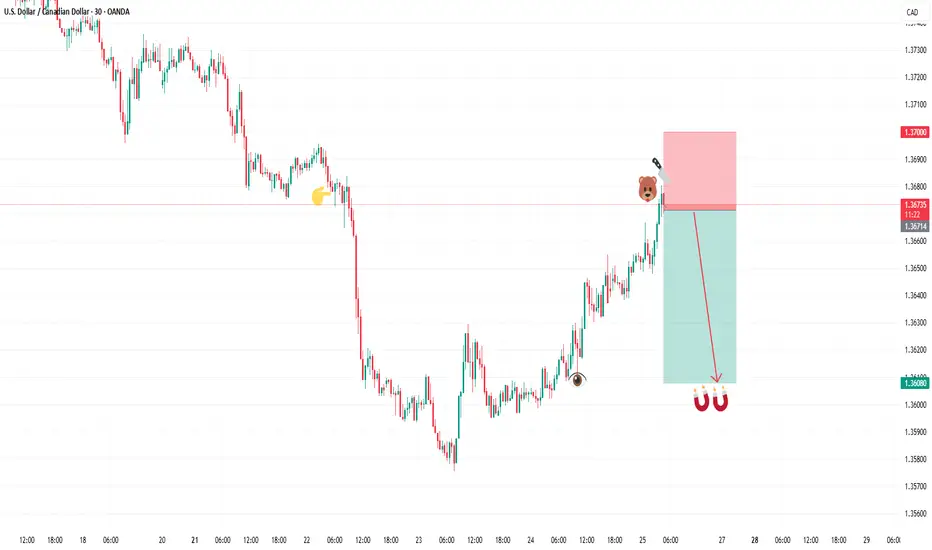
SELL USDCADIn todays session we are monitoring USDCAD for selling opportunities, we have our first entry at 1.36719 and our target is 1.36080 our stop is above 1.3700 , use proper risk management and risk what you can afford. Cheers fam.
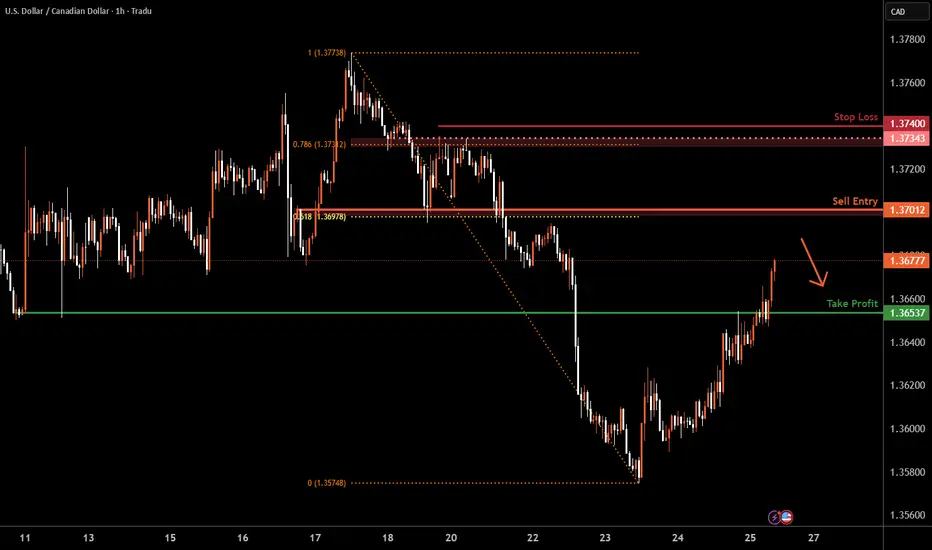
USD/CAD H4 | Potential bearish reversalUSD/CAD is rising towards an overlap resistance and could potentially reverse off this level to drop lower.
Sell entry is at 1.3701 which is an overlap resistance that aligns with the 61.8% Fibonacci retracement.
Stop loss is at 1.3740 which is a level that sits above the 78.6% Fibonacci retracement and an overlap resistance.
Take profit is at 1.3653 which is a pullback support.
High Risk Investment Warning
Trading Forex/CFDs on margin carries a high level of risk and may not be suitable for all investors. Leverage can work against you.
Stratos Markets Limited (tradu.com ):
CFDs are complex instruments and come with a high risk of losing money rapidly due to leverage. 66% of retail investor accounts lose money when trading CFDs with this provider. You should consider whether you understand how CFDs work and whether you can afford to take the high risk of losing your money.
Stratos Europe Ltd (tradu.com ):
CFDs are complex instruments and come with a high risk of losing money rapidly due to leverage. 66% of retail investor accounts lose money when trading CFDs with this provider. You should consider whether you understand how CFDs work and whether you can afford to take the high risk of losing your money.
Stratos Global LLC (tradu.com ):
Losses can exceed deposits.
Please be advised that the information presented on TradingView is provided to Tradu (‘Company’, ‘we’) by a third-party provider (‘TFA Global Pte Ltd’). Please be reminded that you are solely responsible for the trading decisions on your account. There is a very high degree of risk involved in trading. Any information and/or content is intended entirely for research, educational and informational purposes only and does not constitute investment or consultation advice or investment strategy. The information is not tailored to the investment needs of any specific person and therefore does not involve a consideration of any of the investment objectives, financial situation or needs of any viewer that may receive it. Kindly also note that past performance is not a reliable indicator of future results. Actual results may differ materially from those anticipated in forward-looking or past performance statements. We assume no liability as to the accuracy or completeness of any of the information and/or content provided herein and the Company cannot be held responsible for any omission, mistake nor for any loss or damage including without limitation to any loss of profit which may arise from reliance on any information supplied by TFA Global Pte Ltd.
The speaker(s) is neither an employee, agent nor representative of Tradu and is therefore acting independently. The opinions given are their own, constitute general market commentary, and do not constitute the opinion or advice of Tradu or any form of personal or investment advice. Tradu neither endorses nor guarantees offerings of third-party speakers, nor is Tradu responsible for the content, veracity or opinions of third-party speakers, presenters or participants.