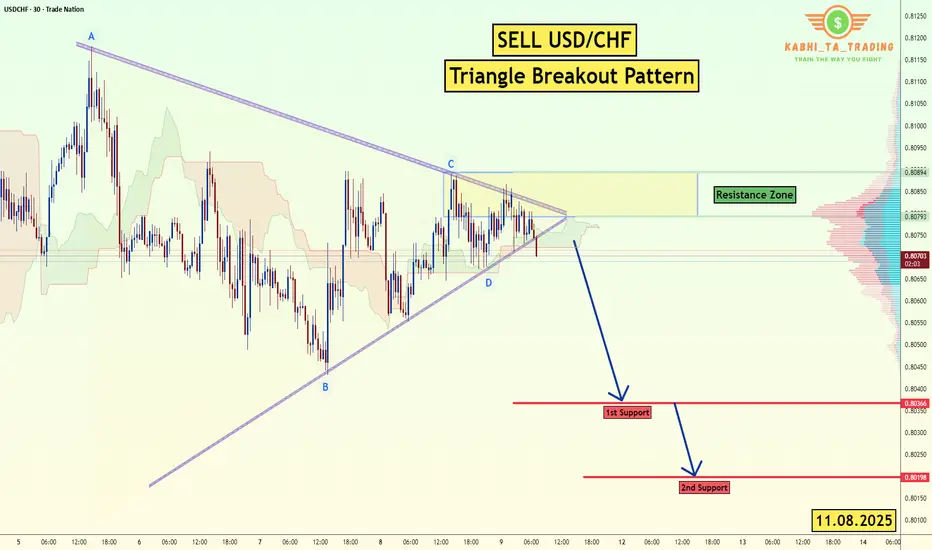
USD/CHF - Triangle Breakout (11.08.2025)The USD/CHF Pair on the M30 timeframe presents a Potential Selling Opportunity due to a recent Formation of a Triangle Breakout Pattern. This suggests a shift in momentum towards the downside in the coming hours.
Possible Short Trade:
Entry: Consider Entering A Short Position around Trendline Of The Pattern.
Target Levels:
1st Support – 0.8036
2nd Support – 0.8019
🎁 Please hit the like button and
🎁 Leave a comment to support for My Post !
Your likes and comments are incredibly motivating and will encourage me to share more analysis with you.
Best Regards, KABHI_TA_TRADING
Thank you.
Disclosure: I am part of Trade Nation's Influencer program and receive a monthly fee for using their TradingView charts in my analysis.
USDCHF trade ideas
USDCHF - Important Breakout!Hello Traders !
The USDCHF price failed to create a new lower low!
The lower high is broken (change of character).
So, I expect a bullish move🚀
______________
TARGET: 0.81555🎯

Target Locked: USDCHF Buy Trade with High ConvictionHey Guys,
I'm planning a buy trade on USDCHF from the pullback zone between 0.80028 and 0.80625. My target level is 0.83390.
I'm quite optimistic about this setup. But remember—forex markets do what they want; we simply make educated guesses.
That’s why risk management is key. Protect your capital.
And one more thing: every single like from you is my biggest motivation to keep sharing analysis. Huge thanks to everyone supporting me!

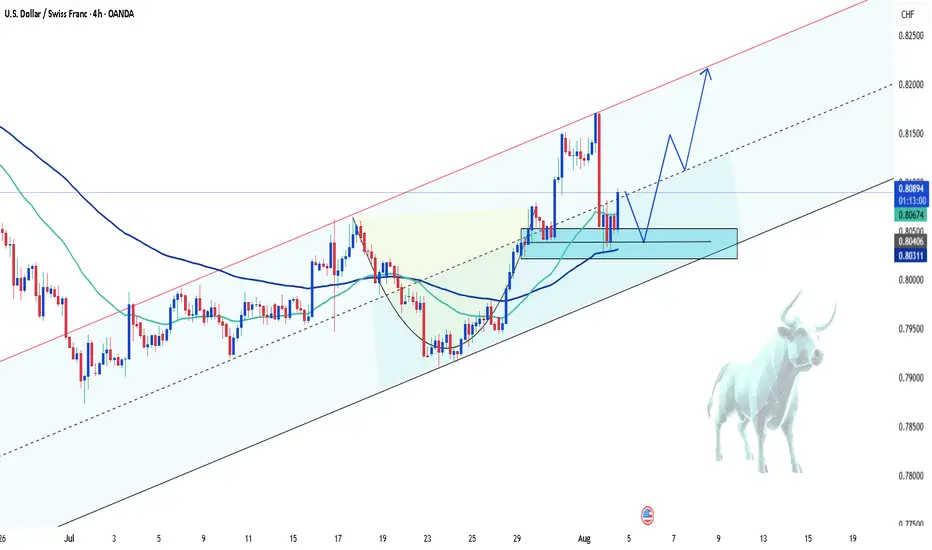
Is USDCHF correction over?✏️USDCHF in the medium term is still in an uptrend. After a retest wave of Fibonacci 0.5 some buying pressure was present in the European session today with the confirmation of the H4 candle Full bullish force. The reaction at Fibonacci is also the support zone for break out in the past. This is considered an important point in the structure of the bullish wave. The BUY point is triggered with the expectation that USDCHF will break the peak of last week and head towards higher levels.
📉 Key Levels
BUY now 0.80800 (confirmation of candle at the support zone)
BUY DCA trigger Break the peak 0.816
Target 0.830
Leave your comments on the idea. I am happy to read your views.

USDCHF – Bullish comeback in progress?Hey everyone! What’s your take on the current trend of USDCHF?
While the pair experienced a recent dip, take a step back and look at the bigger picture — doesn’t it still seem to be moving within an ascending channel?
Right now, USDCHF is hovering around 0.8092 and starting to bounce back. The recovery appears to be supported by a newly formed support zone and the confluence of the EMA 34 and 89. The pair seems to be eyeing the recent high, with potential to climb further toward the upper boundary of the channel.
My current bias? Bullish.
What about you — do you see the same opportunity?
Drop a comment and hit like if you’re on the same page!
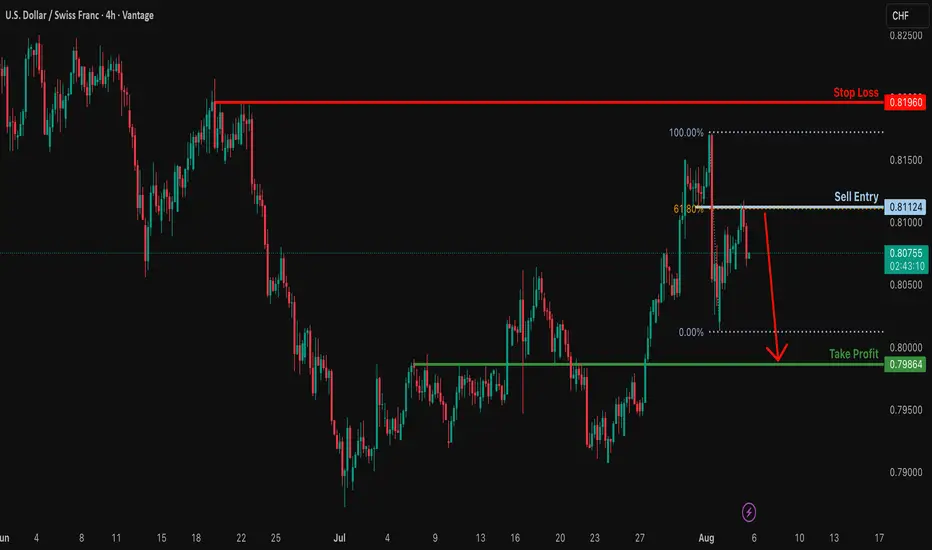
Potential bearish drop?USD/CHF has rejected off the resistance level which is a pullback resistance that lines up with the 61.8% Fibonacci retracement and could drop from this level to our take profit.
Entry: 0.8112
Why we like it:
There is a pullback resistance that lines up with the 61.8% Fibonacci retracement.
Stop loss: 0.8196
Why we like it:
There is a swing high resistance.
Take profit: 0.7986
Why we like it:
There is a pullback support.
Enjoying your TradingView experience? Review us!
Please be advised that the information presented on TradingView is provided to Vantage (‘Vantage Global Limited’, ‘we’) by a third-party provider (‘Everest Fortune Group’). Please be reminded that you are solely responsible for the trading decisions on your account. There is a very high degree of risk involved in trading. Any information and/or content is intended entirely for research, educational and informational purposes only and does not constitute investment or consultation advice or investment strategy. The information is not tailored to the investment needs of any specific person and therefore does not involve a consideration of any of the investment objectives, financial situation or needs of any viewer that may receive it. Kindly also note that past performance is not a reliable indicator of future results. Actual results may differ materially from those anticipated in forward-looking or past performance statements. We assume no liability as to the accuracy or completeness of any of the information and/or content provided herein and the Company cannot be held responsible for any omission, mistake nor for any loss or damage including without limitation to any loss of profit which may arise from reliance on any information supplied by Everest Fortune Group.
USDCHF false breakout, price range capped by 0.8130The USD/CHF pair is currently trading with a bearish bias, aligned with the broader downward trend. Recent price action shows a retest of the falling resistance, suggesting a temporary relief rally within the downtrend.
Key resistance is located at 0.8130, a prior consolidation zone. This level will be critical in determining the next directional move.
A bearish rejection from 0.8130 could confirm the resumption of the downtrend, targeting the next support levels at 0.7970, followed by 0.7930 and 0.7900 over a longer timeframe.
Conversely, a decisive breakout and daily close above 0.8130 would invalidate the current bearish setup, shifting sentiment to bullish and potentially triggering a move towards 0.8160, then 0.8200.
Conclusion:
The short-term outlook remains bearish unless the pair breaks and holds above 0.8045. Traders should watch for price action signals around this key level to confirm direction. A rejection favours fresh downside continuation, while a breakout signals a potential trend reversal or deeper correction.
This communication is for informational purposes only and should not be viewed as any form of recommendation as to a particular course of action or as investment advice. It is not intended as an offer or solicitation for the purchase or sale of any financial instrument or as an official confirmation of any transaction. Opinions, estimates and assumptions expressed herein are made as of the date of this communication and are subject to change without notice. This communication has been prepared based upon information, including market prices, data and other information, believed to be reliable; however, Trade Nation does not warrant its completeness or accuracy. All market prices and market data contained in or attached to this communication are indicative and subject to change without notice.

USDCHFHello Traders! 👋
What are your thoughts on USDCHF?
USD/CHF has broken above its descending trendline and cleared a resistance zone, signaling a potential trend reversal and growing bullish momentum.
After some minor consolidation and a pullback to the breakout zone, we expect the pair to continue its rally toward the next identified targets.
The broken resistance now acts as new support, and as long as price remains above this area, the bullish outlook remains valid.
Is USD/CHF ready to extend higher toward its next targets? Share your view below! 🤔👇
Don’t forget to like and share your thoughts in the comments! ❤️
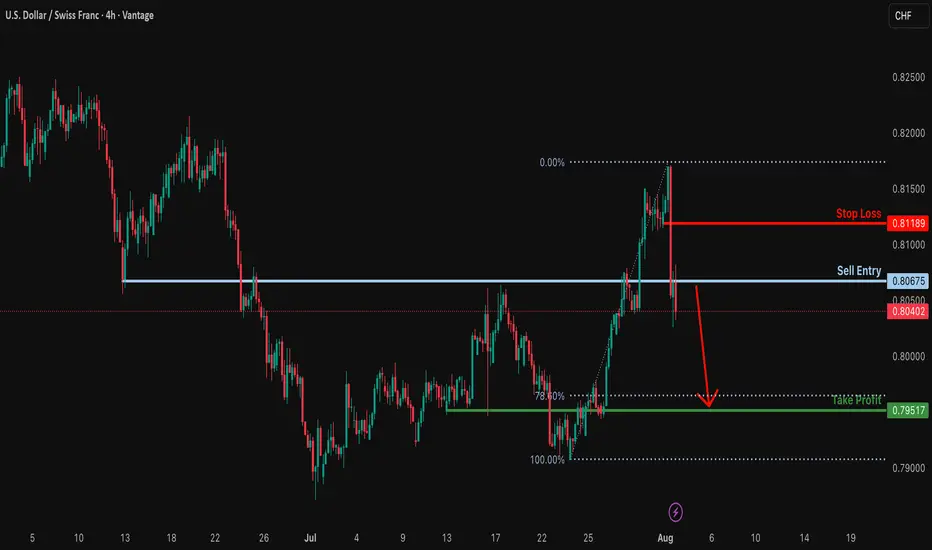
Potential bearish drop?USD/CHF has reacted off the sell entry, which is a pullback resistance, and could drop from this level to our take profit.
Entry: 0.8067
Why we like it:
There is a pullback resistance.
Stop loss: 0.8118
Why we like it:
There is a pullback resistance.
Take profit: 0.7951
Why we like it:
There is a pullback support level that is slightly below the 78.6% Fibonacci retracement.
Enjoying your TradingView experience? Review us!
Please be advised that the information presented on TradingView is provided to Vantage (‘Vantage Global Limited’, ‘we’) by a third-party provider (‘Everest Fortune Group’). Please be reminded that you are solely responsible for the trading decisions on your account. There is a very high degree of risk involved in trading. Any information and/or content is intended entirely for research, educational and informational purposes only and does not constitute investment or consultation advice or investment strategy. The information is not tailored to the investment needs of any specific person and therefore does not involve a consideration of any of the investment objectives, financial situation or needs of any viewer that may receive it. Kindly also note that past performance is not a reliable indicator of future results. Actual results may differ materially from those anticipated in forward-looking or past performance statements. We assume no liability as to the accuracy or completeness of any of the information and/or content provided herein and the Company cannot be held responsible for any omission, mistake nor for any loss or damage including without limitation to any loss of profit which may arise from reliance on any information supplied by Everest Fortune Group.
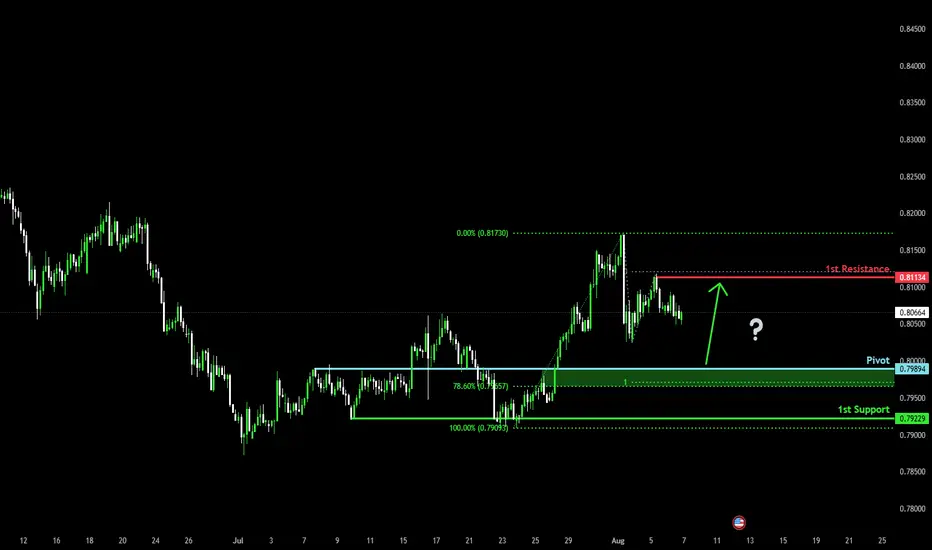
Bullish bounce off?The Swissie (USD/CHF) is falling towards the pivot and could bounce to the 1st resistance which acts as a pullback resistance.
Pivot: 0.7989
1st Support: 0.7922
1st Resistance: 0.8113
Risk Warning:
Trading Forex and CFDs carries a high level of risk to your capital and you should only trade with money you can afford to lose. Trading Forex and CFDs may not be suitable for all investors, so please ensure that you fully understand the risks involved and seek independent advice if necessary.
Disclaimer:
The above opinions given constitute general market commentary, and do not constitute the opinion or advice of IC Markets or any form of personal or investment advice.
Any opinions, news, research, analyses, prices, other information, or links to third-party sites contained on this website are provided on an "as-is" basis, are intended only to be informative, is not an advice nor a recommendation, nor research, or a record of our trading prices, or an offer of, or solicitation for a transaction in any financial instrument and thus should not be treated as such. The information provided does not involve any specific investment objectives, financial situation and needs of any specific person who may receive it. Please be aware, that past performance is not a reliable indicator of future performance and/or results. Past Performance or Forward-looking scenarios based upon the reasonable beliefs of the third-party provider are not a guarantee of future performance. Actual results may differ materially from those anticipated in forward-looking or past performance statements. IC Markets makes no representation or warranty and assumes no liability as to the accuracy or completeness of the information provided, nor any loss arising from any investment based on a recommendation, forecast or any information supplied by any third-party.
USDCHF SELLWe have officially gotten a change of trend as proven by the transition from a sequence of higher highs and higher lows to a lower low and lower high. Stacked on top of this sequence is a pullback for a retest of a key level confirming our setup.
USDCHF - BULLISH MOVE!Hello Traders !
The USDCHF price formed a rectangle pattern.
The resistance level (0.80966 - 0.80888) is broken!
So, I expect a bullish move🚀
______
TARGET: 0.81555🎯

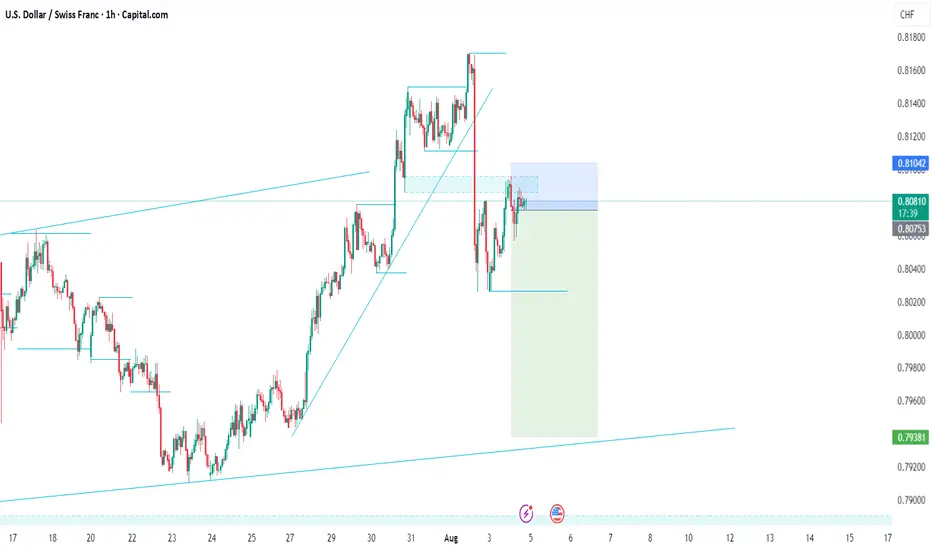
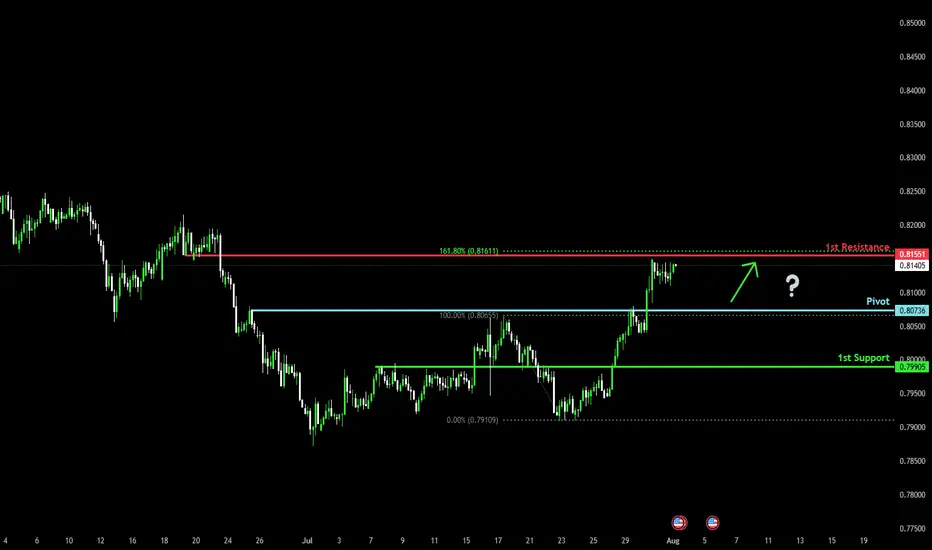
Bullish bounce off pullback support?The Swissie (USD/CHF) is falling towards the pivot, which acts as a pullback support and could bounce to the 1st resistance, which lines up with the 161.8% Fibonacci extension.
Pivot: 0.8073
1st Support: 0.7990
1st Resistance: 0.8155
Risk Warning:
Trading Forex and CFDs carries a high level of risk to your capital and you should only trade with money you can afford to lose. Trading Forex and CFDs may not be suitable for all investors, so please ensure that you fully understand the risks involved and seek independent advice if necessary.
Disclaimer:
The above opinions given constitute general market commentary, and do not constitute the opinion or advice of IC Markets or any form of personal or investment advice.
Any opinions, news, research, analyses, prices, other information, or links to third-party sites contained on this website are provided on an "as-is" basis, are intended only to be informative, is not an advice nor a recommendation, nor research, or a record of our trading prices, or an offer of, or solicitation for a transaction in any financial instrument and thus should not be treated as such. The information provided does not involve any specific investment objectives, financial situation and needs of any specific person who may receive it. Please be aware, that past performance is not a reliable indicator of future performance and/or results. Past Performance or Forward-looking scenarios based upon the reasonable beliefs of the third-party provider are not a guarantee of future performance. Actual results may differ materially from those anticipated in forward-looking or past performance statements. IC Markets makes no representation or warranty and assumes no liability as to the accuracy or completeness of the information provided, nor any loss arising from any investment based on a recommendation, forecast or any information supplied by any third-party.
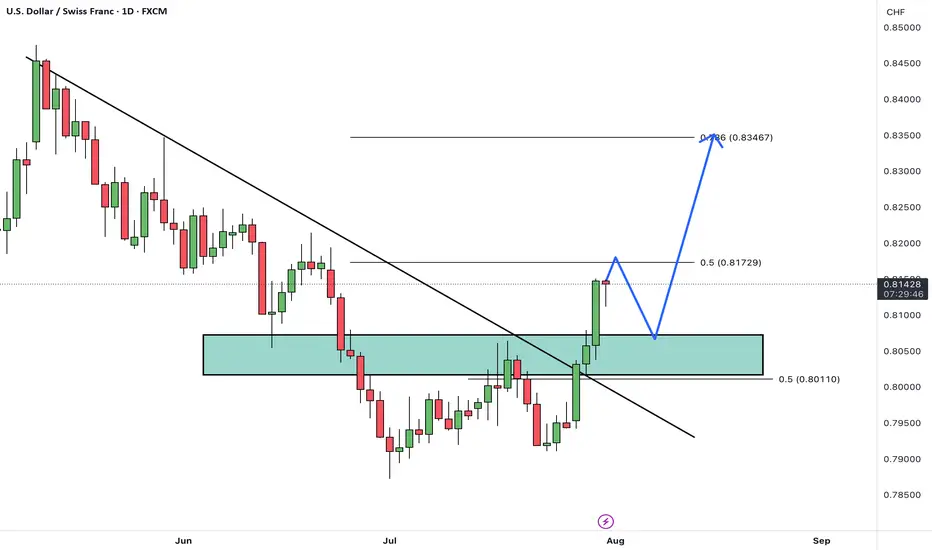
USDCHF: The Necessary Return to the Manipulation ZoneIn the market, some zones act like magnets, pulling the price back to them. After a powerful move down, USDCHF has left behind a critical manipulation zone—a place where large capital needs to return to close their books before the real trend continues. This analysis is about waiting patiently at that exact spot.
The USDCHF pair continues to be in a global downtrend . After another powerful impulse down on the higher timeframe, the instrument corrected to the 78.6% Fibonacci level of the daily structure. This level, in conjunction with a daily order block, acted as strong resistance and pushed the price down, breaking the 4H corrective structure (BOS).
The interaction with the 78.6% level was accompanied by a manipulation in the form of a new daily order block , with a 4H order block residing inside it. If large capital intends to continue the downtrend, they will first need to close the losing long positions used to conduct the Buy-to-Sell (BTS) manipulation . This makes it a strong Point of Interest (POI) and a magnet for the price.
An additional argument for a short setup forming in this POI is that an untouched daily FVG remains slightly below. The mitigation of this FVG will be the minimum target if a setup is confirmed according to one of the two scenarios, provided the price reaches the POI before this rebalancing occurs.
Two Potential Short Scenarios
SCENARIO 1: Entry from the 61.8% Local Fib
This scenario involves the mitigation of the lower boundary of the daily order block in conjunction with reaching the 61.8% level of the local correction , and a reversal reaction from this confluence.
SCENARIO 2: Entry from the 78.6% Local Fib
If the 61.8% local level is broken, the second scenario comes into play, with the mitigation of the 4H order block in conjunction with the 78.6% level of the local correction , and a reversal reaction from there.
► Invalidation: A break of this level with the price finding acceptance above it would invalidate the short idea from this POI. In that case, the correction on the higher timeframe would continue higher, aiming to capture additional liquidity, at least from the June 19th high, which is also the daily structure's break level.
~~~~~~~~~~~~~~~~~~~~~~~~~~~~~~~~~~~~~~~~~~~~~~~~~~~~~~~~~~~~~~~~~
The principles and conditions for forming the manipulation zones I show in this trade idea are detailed in my educational publication, which was chosen by TradingView for the "Editor's Picks" category and received a huge amount of positive feedback from this insightful trading community. To better understand the logic I've used here and the general principles of price movement in most markets from the perspective of institutional capital, I highly recommend checking out this guide if you haven't already. 👇
P.S. This is not a prediction of the exact price direction. It is a description of high-probability setups that become valid only if specific conditions are met when the price reaches the marked POI. If the conditions are not met, the setups are invalid. No setup has a 100% success rate, so if you decide to use this trade idea, always apply a stop-loss and proper risk management. Trade smart.
~~~~~~~~~~~~~~~~~~~~~~~~~~~~~~~~~~~~~~~~~~~~~~~~~~~~~~~~~~~~~~~~~
If you found this analysis helpful, support it with a Boost! 🚀
Have a question or your own view on this idea? Share it in the comments. 💬
► Follow me on TradingView to get real-time updates on THIS idea (entry, targets & live trade management) and not to miss my next detailed breakdown.
~~~~~~~~~~~~~~~~~~~~~~~~~~~~~~~~~~~~~~~~~~~~~~~~~~~~~~~~~~~~~~~~~

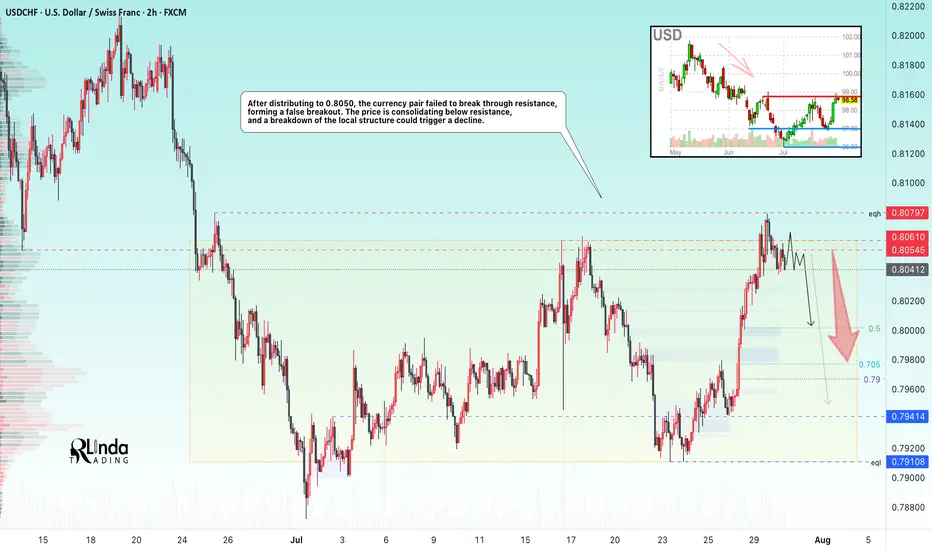
USDCHF → The resistance retest ended with a false breakoutFX:USDCHF tested resistance at 0.805 - 0.806 and formed a false breakout without the possibility of continuing growth. The global trend is downward...
Against the backdrop of the dollar's growth (reaction to news), the currency pair also moved to distribution to 0.8050. The price failed to break through resistance, forming a false breakout. USDCHF is consolidating below resistance, and a breakdown of the local structure could trigger a decline.
The dollar index is also facing fairly strong resistance and may continue its downward trend, which will also affect the decline in the USDCHF price.
Resistance levels: 0.805, 0.806, 0.81
Support levels: 0.800, 0.794, 0.791
If, within the current consolidation, the price begins to fall and break the local structure, then we can expect the decline to continue towards the specified targets!
Best regards, R. Linda!
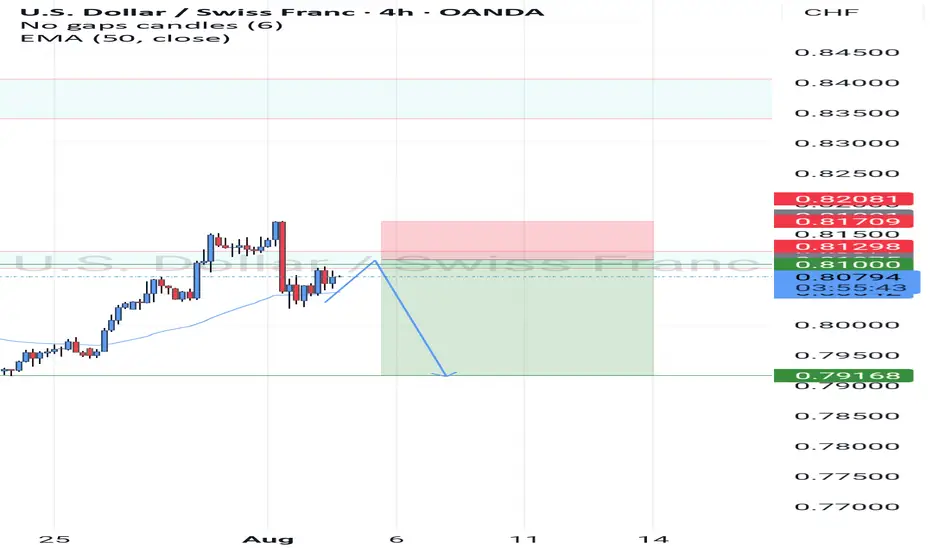
USD/CHF Sets the Stage for a Classic Wolfe Wave Rally
---
As anticipated, the USD/CHF pair has completed a textbook **Wolfe Wave pattern**, ticking all the structural boxes from wave 1 to wave 5. The early signs of bullish momentum are already unfolding—confirming what we’ve been tracking.
✨ **Wave Logic at Work**
The candles have begun their journey upward, aiming straight for the **dashed line connecting waves 1 and 4**—the ultimate Wolfe Wave price target. This line isn't just a projection—it's the magnetic path that often pulls price toward equilibrium.
🔎 **Why This Setup Matters**
- Pattern confirmation aligns perfectly with our expectations
- Market structure supports continued upward pressure
- Momentum builds as price respects wave symmetry
💡 **Outlook**
We maintain our bullish bias, watching for USD/CHF to stretch confidently toward the dashed line target. Until then, the candles speak the language of precision and possibility.
---

Buy usdchfStrong buy expected because bears not looking strong enough for. More sell
Already gonna change the trend
Monthly demand level
Bullish correction just started now

Buy usdchfStrong bullish continue from fresh support level
Our last buying idea already running 200+ pips
More bullish correction expected minimum 500+ pips

USD/CHF H8 AnalysisUSD/CHF has broken and closed above the bearish trendline and has printed a higher low and a higher high.
Price is currently testing previous resistance and MAY now become support.
Look for a trade that meets your strategy rules.

Usdchf As we can see we hv price creating more lower high and lower low so we are expecting a retracment and a change of structure on the 4h then we sell
USDCHF Is Very Bearish! Short!
Take a look at our analysis for USDCHF.
Time Frame: 1h
Current Trend: Bearish
Sentiment: Overbought (based on 7-period RSI)
Forecast: Bearish
The price is testing a key resistance 0.808.
Taking into consideration the current market trend & overbought RSI, chances will be high to see a bearish movement to the downside at least to 0.804 level.
P.S
Overbought describes a period of time where there has been a significant and consistent upward move in price over a period of time without much pullback.
Disclosure: I am part of Trade Nation's Influencer program and receive a monthly fee for using their TradingView charts in my analysis.
Like and subscribe and comment my ideas if you enjoy them!

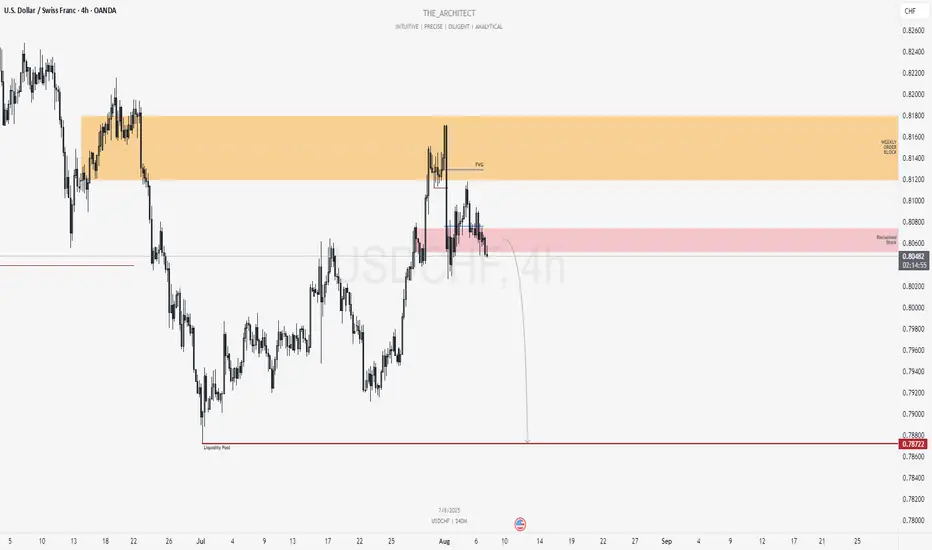
USDCHF: Bearish Continuation Setup From Reclaimed Supply ZoneGreetings Traders,
In today’s analysis of USDCHF, recent price action confirms the presence of bearish institutional order flow. This reinforces our directional bias to the downside, prompting us to focus on strategic selling opportunities.
Key Observations on H4:
Weekly Bearish Order Block: Price recently tapped into a weekly bearish order block, which triggered a decisive market structure shift to the downside. This confirms the order block's validity as a firm resistance zone.
Bearish Fair Value Gap (FVG): Following the market structure shift, price retraced into an H4 FVG. This zone acted as resistance, maintaining bearish momentum.
Reclaimed Mitigation Block: After breaking through a previous mitigation block, the area now functions as a reclaimed order block. We expect this to serve as a high-probability resistance zone moving forward.
Trading Plan:
Entry Strategy: Monitor lower timeframes (M15 and below) for confirmation entries within the reclaimed order block.
Target Objective: The current draw on liquidity is the discount-side liquidity pools, which aligns with our bearish bias.
As always, remain patient, wait for solid confirmations, and manage your risk with precision.
Kind regards,
The Architect 🏛️📉
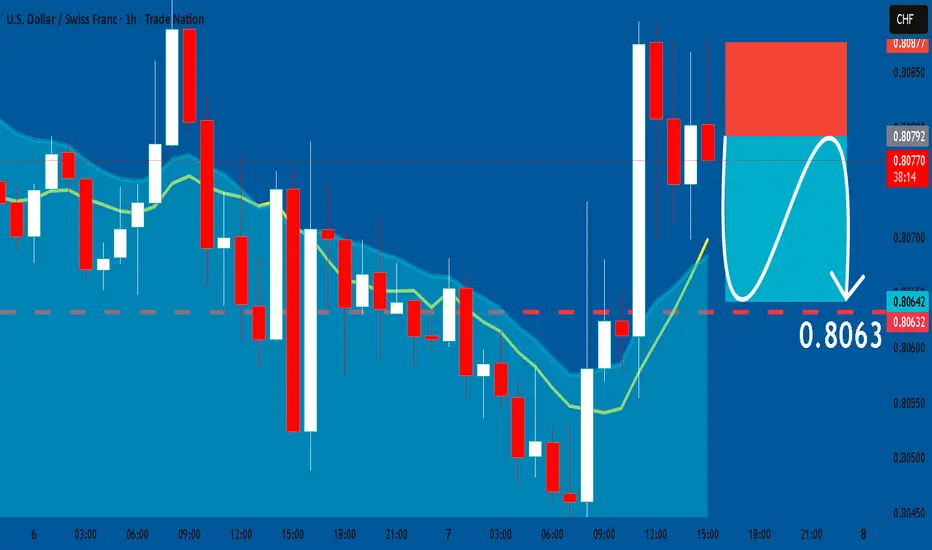
USDCHF: Short Trade Explained
USDCHF
- Classic bearish formation
- Our team expects fall
SUGGESTED TRADE:
Swing Trade
Sell USDCHF
Entry Level - 0.8079
Sl - 0.8087
Tp - 0.8063
Our Risk - 1%
Start protection of your profits from lower levels
Disclosure: I am part of Trade Nation's Influencer program and receive a monthly fee for using their TradingView charts in my analysis.
❤️ Please, support our work with like & comment! ❤️