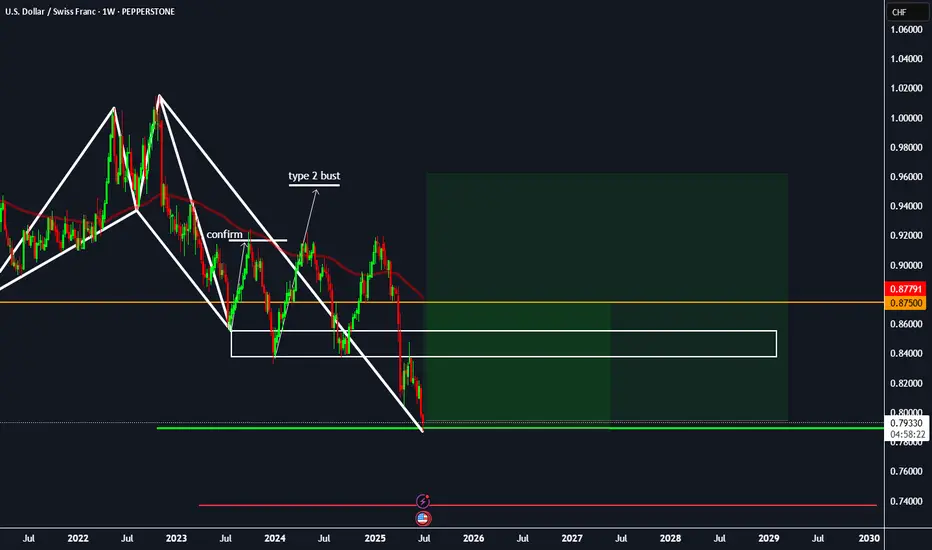
#USDCHF: Will USD Breakthrough The Strong Bearish Downtrend? The USDCHF currency pair has experienced significant volatility due to the ongoing trade dispute between the United States and China, which has led to a substantial decline in the DXY index. Consequently, CHF and JPY have emerged as the most stable currencies in the market.
Despite the USDCHF currency pair reversing its bullish trend, we anticipate a potential reversal back to a bearish position. We believe this reversal may be a temporary trap, and the currency pair is likely to regain its bullish position in the future.
There are two potential areas where the USDCHF currency pair could reverse from its current trend. The first area is relatively early, and if the USDCHF currency pair crosses a specific region, we may have a second safe option that could provide greater stability.
We extend our best wishes and best of luck in your trading endeavours. Your unwavering support is greatly appreciated.
If you wish to contribute, here are several ways you can assist us:
- Like our ideas
- Comment on our ideas
- Share our ideas
Team Setupsfx_🚀❤️
USDCHF trade ideas

USDCHF: A Bullish Reversal Hinges on 0.7985USDCHF: A Bullish Reversal Hinges on 0.7985
USDCHF is currently testing a critical support zone near 0.7880—a level not seen since 2011.
The fact that price has returned to this area after more than a decade underscores the significance of this moment.
The pair remains under pressure for two key reasons:
Ongoing US tariff tensions have created big uncertainty and weighed on the dollar.
The Swiss National Bank continues to intervene in the FX market under the pretext of supporting the domestic economy and controlling inflation. While their reasoning may seem increasingly dubious, the impact on USDCHF is undeniable.
A decisive move above 0.7985 could signal the start of a bullish trend, with potential upside targets at 0.8060 and 0.8190.
A break of this resistance would not only shift short-term momentum but could also signal a broader trend reversal.
You may find more details in the chart!
Thank you and Good Luck!
PS: Please support with a like or comment if you find this analysis useful for your trading day
Disclosure: I am part of Trade Nation's Influencer program and receive a monthly fee for using their TradingView charts in my analysis.

How to mark your charts Lightning fast!One of the things I didn't like was marking my charts. I would take so much time marking my charts and adding the prices on the side. My mentor showed me the fastest way. Just use the FIB tool and use "0" and "1". Now you can focus on other important things. I want to thank my mentor for showing me this. Good luck to everyone

#USDCHF: 878+ PIPS Swing Buy In Making! Good Luck! Dear Traders,
OANDA:USDCHF
Price has been dropping since we had a change of character, there are many factors that are helping in USDCHF to drop. The mainly the first reason is CHF dominance in the market, CHF has been bullish ever since Gold continued the bullish trend, CHF, AUD and GOLD all of these three are positively correlated. Other fundamental reason is the blooming fear of recession in the US Market, on Friday we saw indices and stocks drop record high similarly to the first announcement of covid lockdown. USD index saw sharp drop due to this and it is likely that price will continue to do that on dxy index.

USDCHF: DXY Likely to remain bearish in long term! The USDCHF pair is likely to remain bearish in the coming days as DXY doesn’t show any bullish momentum. However, we expect DXY to be bullish in the short term, which will help the price reach our designated selling zone. Once the price reaches this zone and shows a reversal sign in a smaller timeframe, you can consider entering or taking any decision.
If you’d like to contribute, here are a few ways you can help us:
- Like our ideas
- Comment on our ideas
- Share our ideas
Team Setupsfx_🚀❤️

USDCHF Will Collapse! SELL!
My dear followers,
This is my opinion on the USDCHF next move:
The asset is approaching an important pivot point 0.7969
Bias - Bearish
Technical Indicators: Supper Trend generates a clear short signal while Pivot Point HL is currently determining the overall Bearish trend of the market.
Goal - 0.7955
About Used Indicators:
For more efficient signals, super-trend is used in combination with other indicators like Pivot Points.
Disclosure: I am part of Trade Nation's Influencer program and receive a monthly fee for using their TradingView charts in my analysis.
———————————
WISH YOU ALL LUCK

USDCHF: Bullish Outlook ExplainedLast week, the 📈USDCHF price reached a significant ascending trend line on the 4-hour chart.
Despite the market consolidating within a horizontal range for a while, the contact with the trend line propelled the pair upward.
The market subsequently broke and closed above the range's resistance.
I anticipate that the pair will continue to rise, reaching at least 0.7997.

Usdchf long idea Piggybacking on the strong dollar idea as per previous posts. Today's data was positive for the greenback.
I want to see price draw higher into equal highs depicted with green line as an attractive premium liquidity pool.

USDCHF – Trendline Break Signals Bearish Shift (1H Analysis)USDCHF has broken beneath a key ascending trendline that’s been supporting price since July 3rd. This drop comes after multiple failed attempts to break the 0.7986–0.8000 resistance zone — a level that continues to reject bullish pressure.
Now, price is retesting the broken trendline and the 50 EMA from below, creating a potential bearish continuation setup if this retest holds.
⸻
Bias: 🔻 Short
This is now a bearish structure unless price reclaims and closes above 0.7985 with strength.
⸻
Trade Idea:
• Entry Zone: 0.7960–0.7970 (trendline/EMA retest)
• TP1: 0.7930 (previous low / structure support)
• TP2: 0.7900 (psychological + demand zone)
• Invalidation: Clean break and hold above 0.7986
⸻
📌 Structure shift + EMA + trendline confluence
📌 Clean rejection from resistance
📌 Lower highs forming
⸻
#USDCHF #Forex #TrendlineBreak #BearishSetup #BuiltNotBegged #AutoMarkets #PriceAction #ForexAnalysis #TradingViewCommunity

USDCHF shortPlanning to short USD/CHF if a continuation pattern forms following the double top. The trade becomes invalid if the price makes a higher high, breaking above the double top, or if there are any shifts in macroeconomic outlook.
Jul. 9th, 2025 at 12:00 PM GMT+8
The Swiss Franc's appeal as a safe-haven currency has increased due to geopolitical tensions.
U.S. trade tariffs have contributed to uncertainty in global markets, impacting the dollar negatively.
Weak economic indicators from the U.S. have led investors to reassess monetary policy outlooks for both countries.

USDCHF downtrend continuation below 0.8050 The USDCHF pair remains under bearish pressure, consistent with the prevailing downtrend. Recent price action has transitioned into a sideways consolidation, suggesting a pause in bearish momentum but not a reversal.
The key technical level to monitor is 0.8050, which marks a prior intraday consolidation zone and acts as immediate resistance. Should the pair stage an oversold bounce toward this level, a bearish rejection could reinforce the existing downtrend, with potential downside targets at 0.7900, followed by 0.7860 and 0.7810 over the longer term.
On the other hand, a confirmed breakout above 0.8050, supported by a daily close above this level, would invalidate the bearish outlook. Such a move would signal a possible shift in sentiment and open the door for a retest of the 0.8080 resistance zone, with further upside potential toward 0.8140.
Conclusion:
The broader trend remains bearish below 0.8050, and rallies into resistance may present renewed selling opportunities. However, a sustained break above 0.8050 would warrant a reassessment of the bearish bias and could signal the start of a short-term recovery phase. Traders should watch for price action confirmation at this key pivot area.
This communication is for informational purposes only and should not be viewed as any form of recommendation as to a particular course of action or as investment advice. It is not intended as an offer or solicitation for the purchase or sale of any financial instrument or as an official confirmation of any transaction. Opinions, estimates and assumptions expressed herein are made as of the date of this communication and are subject to change without notice. This communication has been prepared based upon information, including market prices, data and other information, believed to be reliable; however, Trade Nation does not warrant its completeness or accuracy. All market prices and market data contained in or attached to this communication are indicative and subject to change without notice.

USDCHF Analysis – "Dollar Trying to Break Free from Downtrend"USDCHF is breaking out from a multi-week descending channel.
Structure shows a potential trend reversal from the June 12th low.
First bullish leg may target the 23.6% Fib level at 0.8266, followed by an extended move toward 0.8355.
Key resistance: 0.8266 and 0.8355 (Fib levels)
Stop loss: around 0.8093–0.8056 zone (previous support and breakout base)
Structure Bias: Bullish breakout after prolonged downtrend – confirmation depends on sustained move above 0.8200
📊 Current Bias: Cautiously Bullish
🧩 Key Fundamentals Driving USDCHF
USD Side (Mildly Bearish to Neutral):
FOMC held rates, Dot Plot showed only one cut expected for 2025, but Powell’s tone was less hawkish.
US Retail Sales soft, and PPI/CPI showed signs of inflation cooling.
Recent risk-off sentiment (Middle East, oil spikes, equity volatility) supports the USD.
Trump commentary and 2025 election anticipation bring long-term uncertainty.
CHF Side (Strong but potentially weakening):
SNB held rates steady, with cautious tone—no urgency to hike again.
Safe-haven flows still support CHF, but waning inflation and stronger global equity market might reduce CHF appeal.
SNB has hinted at FX intervention readiness, which could weaken CHF if necessary.
⚠️ Risks That May Reverse or Accelerate Trend
False breakout risk if 0.82 fails to hold → deeper pullback toward 0.8090
Stronger CHF demand on geopolitical fear (Israel–Iran, Ukraine)
Unexpectedly weak US data this week or renewed Fed dovish talk
🗓️ Important News to Watch
US: Core PCE, GDP revision (June 27), jobless claims
CHF: Swiss CPI, SNB FX intervention chatter
Risk sentiment: Iran/Israel tensions, equity volatility, Trump Fed commentary
🏁 Which Asset Might Lead the Broader Move?
USDCHF could mirror sentiment across CHF pairs—if risk-on resumes and CHF weakens across the board (EURCHF, NZDCHF also rallying), USDCHF may accelerate higher.

USDCHF – Sell Into Resistance in Bearish ChannelTrade Idea
Type: Sell Limit
Entry: 0.7989
Target: 0.7905
Stop Loss: 0.8018
Duration: Intraday
Expires: 09/07/2025 06:00
Technical Overview
The primary trend remains bearish, and price is currently trading within a corrective channel formation, suggesting further downside potential.
Trendline resistance at 0.7995 aligns closely with the entry point of 0.7989, providing a strong technical barrier to cap gains.
The recent weakness in the US dollar supports a continued bearish outlook for USDCHF.
A break below support zones could accelerate a move toward the target at 0.7905.
No significant events are scheduled in the next 24 hours, allowing technical patterns to dominate intraday trading.
Key Technical Levels
Resistance: 0.7991 / 0.8020 / 0.8050
Support: 0.7958 / 0.7922 / 0.7900
Disclosure: I am part of Trade Nation's Influencer program and receive a monthly fee for using their TradingView charts in my analysis.

USDCHFRebound after blowing through low wicks. Prolonging current rate differentials and SnB possibly getting ahead of the FED things could get interesting. CHF has been THE BEST WORST performer, now with 0%, it's not that the USD is "strengthening" it's just that CHF is finally going to start to catch up in depreciation while 4% rates keep the USD relatively flat.
Could the price bounce from here?The Swissie (USD/CHF) is falling towards the pivot, which is an overlap support and could bounce to the 50% Fibonacci resistance.
Pivot: 0.7933
1st Support: 0.7879
1st Resistance: 0.8052
Risk Warning:
Trading Forex and CFDs carries a high level of risk to your capital and you should only trade with money you can afford to lose. Trading Forex and CFDs may not be suitable for all investors, so please ensure that you fully understand the risks involved and seek independent advice if necessary.
Disclaimer:
The above opinions given constitute general market commentary, and do not constitute the opinion or advice of IC Markets or any form of personal or investment advice.
Any opinions, news, research, analyses, prices, other information, or links to third-party sites contained on this website are provided on an "as-is" basis, are intended only to be informative, is not an advice nor a recommendation, nor research, or a record of our trading prices, or an offer of, or solicitation for a transaction in any financial instrument and thus should not be treated as such. The information provided does not involve any specific investment objectives, financial situation and needs of any specific person who may receive it. Please be aware, that past performance is not a reliable indicator of future performance and/or results. Past Performance or Forward-looking scenarios based upon the reasonable beliefs of the third-party provider are not a guarantee of future performance. Actual results may differ materially from those anticipated in forward-looking or past performance statements. IC Markets makes no representation or warranty and assumes no liability as to the accuracy or completeness of the information provided, nor any loss arising from any investment based on a recommendation, forecast or any information supplied by any third-party.

Usdchf short idea after reversalAn update of previous idea. I see this one in reversal mode.
Likely marker maker sell model playing out now.

USD/CHF💰Symbol: { USD/CHF }
🟩Price: { 0.79398 }
🟥Stop: { 0.78872 }
1️⃣profit: { 0.79809 }
2️⃣profit: { 0.80192 }
3️⃣profit: { 0.80812 }
4️⃣profit: { 0.81342 }
5️⃣profit: { 0.81969 }
📊Check your chart before entering.
🚨Check before use to make sure there is no important news.🚨

Setupsfx_ | USDCHF: A Big Major Swing Sell In Making 760+ Pips The USDCHF pair has dropped significantly since our last update. We anticipate another drop before price may reverse. DXY is also dropping and may continue to decline. There’s a major swing target that will take time to complete successfully. Use risk management according to your own risk tolerance.
Thank you for your continued support!
Team Setupsfx_

USDCHF – Reversal Setup Building Above 0.79 SupportUSDCHF has broken out of its steep downward channel and is now forming a potential bullish reversal base above the key support zone at 0.7940–0.7870. Price action suggests momentum could be shifting in favor of the bulls, with upside targets sitting at 0.8100 (Fibonacci 38.2%) and 0.8210 (previous resistance and 61.8% retracement).
🔍 Technical Structure:
Clean descending channel now broken.
Price holding above May–June lows, forming a potential higher low.
First target: 0.8100 zone.
Final target: 0.8210 resistance.
Stop: Below 0.7870 structure low.
🧠 Fundamentals:
USD Outlook: Bullish tilt as Fed members push back against early cuts. Markets eye July 11 CPI, which could confirm inflation stickiness and reinforce USD strength.
CHF Outlook: Weak bias, as the SNB has turned more dovish. With safe-haven demand easing and growth outlook softening, CHF is losing favor across the board.
Global sentiment: Risk appetite improving as geopolitical concerns (e.g., Strait of Hormuz, Iran) temporarily ease—removing upward pressure on CHF.
⚠️ Risk Factors:
A surprise drop in U.S. CPI this week could shift USDCHF sharply lower.
Renewed geopolitical tensions may revive CHF demand suddenly.
Fed speak and yields must remain supportive for this structure to play out.
🔁 Asset Dynamics:
USDCHF tends to lag behind DXY and USDJPY. Watch those pairs for confirmation. It can also follow moves in US10Y yields and react inversely to Gold volatility (safe-haven flow shifts).
✅ Trade Bias: Bullish
TP1: 0.8100
TP2: 0.8210
SL: Below 0.7870
Event to Watch: 🇺🇸 U.S. CPI – July 11
📌 If CPI confirms sticky inflation, USDCHF could rally toward the upper retracement zones quickly. Watch for confirmation candles near breakout.
USD/CHF Slips LowerUSD/CHF Slips Lower
USD/CHF declined and now struggling below the 0.8000 resistance.
Important Takeaways for USD/CHF Analysis Today
- USD/CHF declined below the 0.8000 and 0.7950 support levels.
- There is a key bearish trend line forming with resistance near 0.7920 on the hourly chart at FXOpen.
USD/CHF Technical Analysis
On the hourly chart of USD/CHF at FXOpen, the pair started a fresh decline from well above the 0.8080 zone. The US Dollar dropped below the 0.8000 support to move into a negative zone against the Swiss Franc.
The bears pushed the pair below the 50-hour simple moving average and 0.7940. Finally, the bulls appeared near the 0.7870 level. A low was formed near 0.7872 and the pair is now consolidating losses.
There was a minor increase above the 23.6% Fib retracement level of the downward move from the 0.8080 swing high to the 0.7872 low. On the upside, the pair could face resistance near the 0.7920 level. There is also a key bearish trend line forming with resistance near 0.7920.
The next major resistance is near the 0.7940 level, above which the pair could test the 0.7975 level. It is close to the 50% Fib retracement level of the downward move from the 0.8080 swing high to the 0.7872 low.
If there is a clear break above the 0.7975 resistance zone, the pair could start another increase. In the stated case, it could even surpass 0.8030.
On the downside, immediate support on the USD/CHF chart is 0.7870. The first major support is near the 0.7850 level. The next major support is near 0.7800. Any more losses may possibly open the doors for a move toward the 0.7720 level in the coming days.
This article represents the opinion of the Companies operating under the FXOpen brand only. It is not to be construed as an offer, solicitation, or recommendation with respect to products and services provided by the Companies operating under the FXOpen brand, nor is it to be considered financial advice.

USD/CHF SWISSY Forex Heist Plan | Thief-Style Buy Setup🔥💰 "Forex Bank Heist: Thief Trading Blueprint for USD/CHF SWISSY 💵💸" 💣🚨
"Steal Pips, Not Dreams. Trade Like a Robber, Think Like a Mastermind." 🕶️💼
🌟 Hello World! Bonjour! Ola! Hallo! Marhaba! 🌟
Welcome, all Money Makers, Market Hustlers & Chart Robbers 🕵️♂️🤑🚁
Let’s gear up for our latest USD/CHF "Swissy" Forex Bank Heist, crafted using our high-level Thief Trading Style—a bold fusion of technical know-how, street-smart price action, and strategic risk maneuvers.
💎 HEIST PLAN SUMMARY
This trade is locked, loaded, and ready to target the vault using a Bullish Breakout / Pullback strategy.
We are eyeing the SWISSY with laser focus, watching closely for price action to retest key support zones, then blast through resistance to secure our escape route.
Let’s not get caught in the police trap zone (aka overbought resistance with fakeouts and bearish ambushes). Keep those trailing stops tight and your loot tighter. 🏃♂️💨
🎯 ENTRY STRATEGY — “The Vault is Open!” 📈
💰 Buy Limit Orders near recent swing low or pullback zone (15M–30M timeframe).
💣 Use DCA (Dollar-Cost Averaging) or Layered Entry strategy to spread risk and improve entry points.
🏹 Entry range: Monitor consolidation for the perfect dip-snatch setup.
🛑 STOP LOSS — “Fallback Safe House” 🚨
📍 Place SL just below recent swing low using 2H timeframe (e.g., 0.79200).
💡 Adjust based on position size, number of entries, and personal risk.
🏴☠️ TARGET ZONE — “The Getaway” 🎯
🎯 TP Level: 0.80700
🚁 Or escape early if momentum weakens—profit is profit.
💹 Scalpers: Ride only the bullish getaway car. Use Trailing SLs to ride and protect gains.
📊 MARKET STATUS — "SWISSY Watchtower" 🕵️
The market is currently neutral, but pressure is building. Expect a bullish breakout if macro & technicals align.
💡 Smart Robbers read the full blueprint:
→ Macro Outlook
→ COT Reports
→ Sentiment Analysis
→ Intermarket Trends
→ Seasonality & Institutional Flow
📰 TRADING ALERT — “Dodge the Sirens” 🚓
🚨 Avoid opening new trades during high-impact news events
💼 Use Trailing Stop-Loss to lock in profits
🧠 Plan your risk and exit BEFORE the bullets (candles) start flying
❤️ BOOST THE CREW! 💥
If this plan helps you pull clean profits, show love and Boost the chart 🔥📈
Your support fuels more strategies and keeps the crew funded 💼💵
Stay sharp, stay ruthless, and always trade like a Thief in the Charts 🎩🕶️
📌 Disclaimer
This strategy is educational and should not be considered investment advice.
Always trade based on your own analysis, risk profile, and market research.
🗓️ Stay tuned for the next Forex Heist Blueprint — we rob charts, not wallets.
📡 Tap follow. Boost the crew. Profit like a pro.

Bullish bounce off pullback support?USD/CHF is falling towards the support level which is a pullback support that lines up with the 50% Fibonacci retracement and could bounce from this level to our take profit.
Entry: 0.7936
Why we like it:
There is a pullback support level that lines up with the 50% Fibonacci retracement.
Stop loss: 0.7900
Why we like it:
There is a pullback support level that aligns with the 78.6% Fibonacci retracement.
Take profit: 0.8034
Why we like it:
There is a pullback resistance level that aligns with the 50% Fibonacci retracement.
Enjoying your TradingView experience? Review us!
Please be advised that the information presented on TradingView is provided to Vantage (‘Vantage Global Limited’, ‘we’) by a third-party provider (‘Everest Fortune Group’). Please be reminded that you are solely responsible for the trading decisions on your account. There is a very high degree of risk involved in trading. Any information and/or content is intended entirely for research, educational and informational purposes only and does not constitute investment or consultation advice or investment strategy. The information is not tailored to the investment needs of any specific person and therefore does not involve a consideration of any of the investment objectives, financial situation or needs of any viewer that may receive it. Kindly also note that past performance is not a reliable indicator of future results. Actual results may differ materially from those anticipated in forward-looking or past performance statements. We assume no liability as to the accuracy or completeness of any of the information and/or content provided herein and the Company cannot be held responsible for any omission, mistake nor for any loss or damage including without limitation to any loss of profit which may arise from reliance on any information supplied by Everest Fortune Group.

USDCHF Will Go Up From Support! Buy!
Take a look at our analysis for USDCHF.
Time Frame: 12h
Current Trend: Bullish
Sentiment: Oversold (based on 7-period RSI)
Forecast: Bullish
The market is on a crucial zone of demand 0.794.
The oversold market condition in a combination with key structure gives us a relatively strong bullish signal with goal 0.809 level.
P.S
The term oversold refers to a condition where an asset has traded lower in price and has the potential for a price bounce.
Overbought refers to market scenarios where the instrument is traded considerably higher than its fair value. Overvaluation is caused by market sentiments when there is positive news.
Disclosure: I am part of Trade Nation's Influencer program and receive a monthly fee for using their TradingView charts in my analysis.
Like and subscribe and comment my ideas if you enjoy them!
