USD_CHF SHORT SIGNAL|
✅USD_CHF made a nice
Rebound from the support
Below just as we predicted in
Our previous analysis but is now
About to retest the horizontal
Resistance of 0.8200 from where
We can go short with the TP
Of 0.8124 and the SL of 0.8207
SHORT🔥
✅Like and subscribe to never miss a new idea!✅
Disclosure: I am part of Trade Nation's Influencer program and receive a monthly fee for using their TradingView charts in my analysis.
USDCHF trade ideas

USD/CHF is on the beginning of a bull runFrom the chart, you can see that usd/chf have just reach the end of the bearish trendline, and its about to fly up.
Reasons
1; double bottom pattern
2; completion of the inner descending triangle
3; pattern inside pattern, which is signal for strong trade
4; formation of outer descending triangle

Buy idea on usdchfLittle bullish movement heading to a rejection. Target is the tip of the harmonic pattern.
Published a bit late but there's a bit of a move left

USD/CHF SHORT USD/CHF SHORT " break of a support area and retest it + 61.8% fib retracement + 50 ema dynamic resistance + down trendline "

USDCHF in DowntrendPending a confirmation from AB=CD harmonics pattern, we may see a downtrend continuation from the 4H bearish FVG and 1D bearish FVG overlap. However, if this FVG fails, we might see a reversal from the 0.8188 level, which would be a 0.718 FIB retracement level.
Sell Stop
Entry Price 0.8147
Stop Loss 0.8178
TP1 0.8057
Risk 1%
Lot Size 0.66

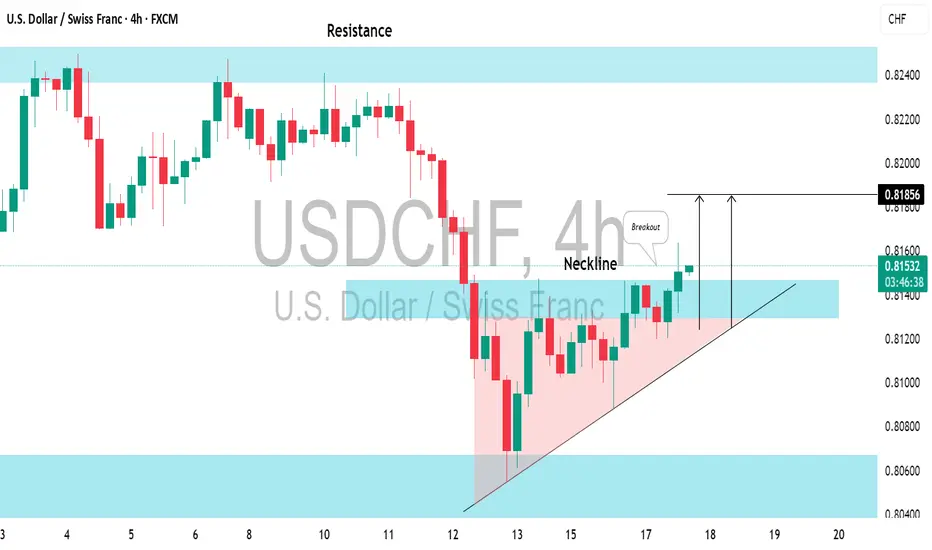
USDCHF: Bullish Move From Key LevelI see a solid bullish signal on 📈USDCHF following a test of significant support.
The price formed an ascending triangle pattern on the 4-hour chart and has broken above its neckline.
I anticipate that the price will soon reach the 0.8193 level.
USDCHF Daily CLS I Model 1 I Target - CLS LowsHey, Market Warriors, here is another outlook on this instrument
If you’ve been following me, you already know every setup you see is built around a CLS Footprint, a Key Level, Liquidity and a specific execution model.
If you haven't followed me yet, start now.
My trading system is completely mechanical — designed to remove emotions, opinions, and impulsive decisions. No messy diagonal lines. No random drawings. Just clarity, structure, and execution.
🧩 What is CLS?
CLS is real smart money — the combined power of major investment banks and central banks moving over 6.5 trillion dollars a day. Understanding their operations is key to markets.
✅ Understanding the behavior of CLS allows you to position yourself with the giants during the market manipulations — leading to buying lows and selling highs - cleaner entries, clearer exits, and consistent profits.
📍 Model 1
is right after the manipulation of the CLS candle when CIOD occurs, and we are targeting 50% of the CLS range. H4 CLS ranges supported by HTF go straight to the opposing range.
"Adapt what is useful, reject what is useless, and add what is specifically your own."
— David Perk aka Dave FX Hunter ⚔️
👍 Hit like if you find this analysis helpful, and don't hesitate to comment with your opinions, charts or any questions.

USDCHF My Opinion! SELL!
My dear followers,
I analysed this chart on USDCHF and concluded the following:
The market is trading on 0.8147 pivot level.
Bias - Bearish
Technical Indicators: Both Super Trend & Pivot HL indicate a highly probable Bearish continuation.
Target - 0.8131
About Used Indicators:
A super-trend indicator is plotted on either above or below the closing price to signal a buy or sell. The indicator changes color, based on whether or not you should be buying. If the super-trend indicator moves below the closing price, the indicator turns green, and it signals an entry point or points to buy.
Disclosure: I am part of Trade Nation's Influencer program and receive a monthly fee for using their TradingView charts in my analysis.
———————————
WISH YOU ALL LUCK


USDCHF LONG FORECAST Q2 W25 D17 Y25USDCHF LONG FORECAST Q2 W25 D17 Y25
Professional Risk Managers👋
Welcome back to another FRGNT chart update📈
Diving into some Forex setups using predominantly higher time frame order blocks alongside intraday confirmation & breaks of structure.
Let’s see what price action is telling us today! 🔥
💡Here are some trade confluences📝
✅Weekly order block rejection
✅Daily order block rejection
✅15’ order block
✅Intraday bullish breaks of structure
🔑 Remember, to participate in trading comes always with a degree of risk, therefore as professional risk managers it remains vital that we stick to our risk management plan as well as our trading strategies.
📈The rest, we leave to the balance of probabilities.
💡Fail to plan. Plan to fail.
🏆It has always been that simple.
❤️Good luck with your trading journey, I shall see you at the very top.
🎯Trade consistent, FRGNT X

USDCHF - Now Bullish!Hello TradingView Family / Fellow Traders. This is Richard, also known as theSignalyst.
As per our last USDCHF analysis, attached on the chart, it rejected the upper bound of the orange channel and traded lower.
What's next?
📈USDCHF is now retesting the lower bound of the channel.
Moreover, the blue line is a strong weekly low.
🏹 Thus, the highlighted blue circle is a strong area to look for buy setups as it is the intersection of the lower orange trendline and weekly low.
📚 As per my trading style:
As #USDCHF is around the blue circle zone, I will be looking for bullish reversal setups (like a double bottom pattern, trendline break , and so on...)
📚 Always follow your trading plan regarding entry, risk management, and trade management.
Good luck!
All Strategies Are Good; If Managed Properly!
~Rich
Disclosure: I am part of Trade Nation's Influencer program and receive a monthly fee for using their TradingView charts in my analysis.

USDCHF: Up for a ride?What we just saw on USDCHF is a classic move that catches many traders off guard:
Price swept the Previous Day’s Low (PDL)
That’s where most retail traders get stopped out.
It’s also where smart money often steps in.
Break of Structure (BOS) followed immediately
A clean shift in direction.
Momentum flipped bullish.
Fair Value Gap (FVG) below
That’s likely where price will return to rebalance.
If price respects that zone, the next destination?
The liquidity resting above.
This is one of those setups that reminds me:
It’s not about catching every move. It’s about understanding why the move happened.
Let’s see how it plays out.

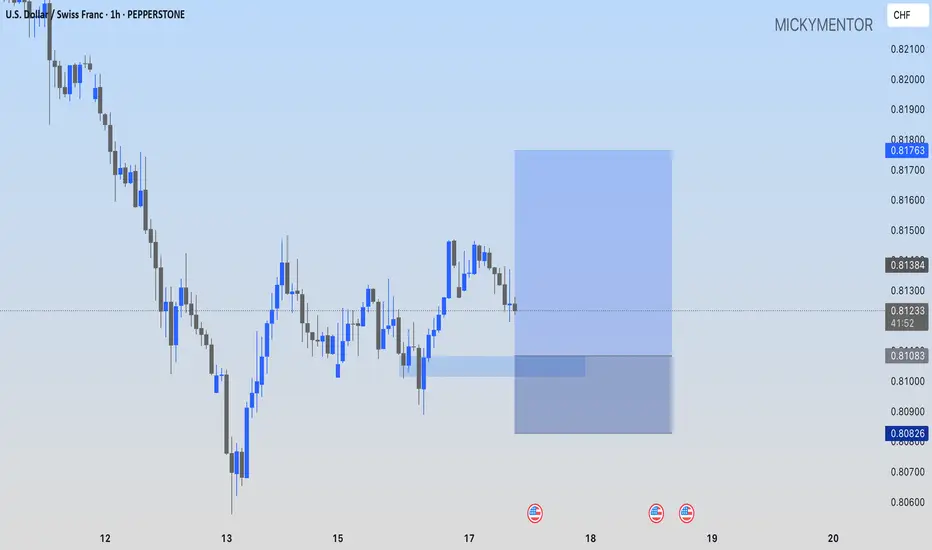
USDCHF: I'M GOING LONG AT 0.81083!!PEPPERSTONE:USDCHF I'm going long at 0.81083, looking at the 0.81763 as my target.
USD-CHF Bearish Bias! Sell!
Hello,Traders!
USD-CHF is trading in a
Downtrend and the pair
Is making a local bullish
Pullback but will soon
Hit a horizontal resistance
Level around 0.8185
So we are bearish biased
And we will be expecting
A further bearish move down
Sell!
Comment and subscribe to help us grow!
Check out other forecasts below too!
Disclosure: I am part of Trade Nation's Influencer program and receive a monthly fee for using their TradingView charts in my analysis.

Bearish continuation for the Swissie?The price is rising towards the pivot which has been identified as a pullback resistance that aligns with the 50% Fibonacci retracement and could drop to the 1st support.
Pivot: 0.8156
1st Support: 0.8055
1st Resistance: 0.8241
Risk Warning:
Trading Forex and CFDs carries a high level of risk to your capital and you should only trade with money you can afford to lose. Trading Forex and CFDs may not be suitable for all investors, so please ensure that you fully understand the risks involved and seek independent advice if necessary.
Disclaimer:
The above opinions given constitute general market commentary, and do not constitute the opinion or advice of IC Markets or any form of personal or investment advice.
Any opinions, news, research, analyses, prices, other information, or links to third-party sites contained on this website are provided on an "as-is" basis, are intended only to be informative, is not an advice nor a recommendation, nor research, or a record of our trading prices, or an offer of, or solicitation for a transaction in any financial instrument and thus should not be treated as such. The information provided does not involve any specific investment objectives, financial situation and needs of any specific person who may receive it. Please be aware, that past performance is not a reliable indicator of future performance and/or results. Past Performance or Forward-looking scenarios based upon the reasonable beliefs of the third-party provider are not a guarantee of future performance. Actual results may differ materially from those anticipated in forward-looking or past performance statements. IC Markets makes no representation or warranty and assumes no liability as to the accuracy or completeness of the information provided, nor any loss arising from any investment based on a recommendation, forecast or any information supplied by any third-party.

USDCHF Wave Analysis – 16 June 2025
- USDCHF reversed from key support level 0.8055
- Likely to rise to resistance level 0.8185
USDCHF currency pair recently reversed up from the key support level 0.8055, which stopped the previous impulse wave (1) at the end of April.
The support zone near the support level 0.8055 was strengthened by the lower daily Bollinger Band.
Given the oversold daily Stochastic, USDCHF currency pair can be expected to rise to the next resistance level 0.8185 (former support from May and the start of June).

USDCHF - Bearish Continuation STORY : Bearish Indications :
1- LH and LL
2- No Divergence
3- Symmetrical pattern
4- Seasonal Show USDCHF Bearish in June for last 15 years
Bullish Indications:
1- SXF on 1H time frame make a bearish Divergence which indicates a
strong corrective move in the index.
if that happens market will make breakout above 0.81565
Anticipation : I anticipate in order for the market to continue, the market will break the neck line and then continue bearish
Plan : Enter into the market with pending order (Sell Stop) and then wait for the TPs to hit as per mentioned target points.

USDCHF oversold rally capped by resistance at 0.8166The USD/CHF pair is currently trading with a bearish bias, aligned with the broader downward trend. Recent price action shows a corrective pullback, suggesting a temporary relief rally within the downtrend.
Key resistance is located at 0.8166, a prior consolidation zone. This level will be critical in determining the next directional move.
A bearish rejection from 0.8166 could confirm the resumption of the downtrend, targeting the next support levels at 0.8033, followed by 0.7990 and 0.7950 over a longer timeframe.
Conversely, a decisive breakout and daily close above 0.8166 would invalidate the current bearish setup, shifting sentiment to bullish and potentially triggering a move towards 0.8190, then 0.8220.
Conclusion:
The short-term outlook remains bearish unless the pair breaks and holds above 0.8166. Traders should watch for price action signals around this key level to confirm direction. A rejection favors fresh downside continuation, while a breakout signals a potential trend reversal or deeper correction.
This communication is for informational purposes only and should not be viewed as any form of recommendation as to a particular course of action or as investment advice. It is not intended as an offer or solicitation for the purchase or sale of any financial instrument or as an official confirmation of any transaction. Opinions, estimates and assumptions expressed herein are made as of the date of this communication and are subject to change without notice. This communication has been prepared based upon information, including market prices, data and other information, believed to be reliable; however, Trade Nation does not warrant its completeness or accuracy. All market prices and market data contained in or attached to this communication are indicative and subject to change without notice.

USDCHF 1:3USDCHF WAIT FOR FVG OB ENTRY 1:3.4
it's time to the buy udsdchf i think personility not for you dhe buy or sell but
i think usdchf touch last week ob HTF and market structur 4h its break and now wait for fvg or ob 4h and buy and going to tp in ob daily or 4h

USD/CHF BEARS ARE GAINING STRENGTH|SHORT
USD/CHF SIGNAL
Trade Direction: short
Entry Level: 0.821
Target Level: 0.815
Stop Loss: 0.826
RISK PROFILE
Risk level: medium
Suggested risk: 1%
Timeframe: 9h
Disclosure: I am part of Trade Nation's Influencer program and receive a monthly fee for using their TradingView charts in my analysis.
✅LIKE AND COMMENT MY IDEAS✅

USDCHFwe can see usdchf is looking bearish so with risk management we will be selling to the down side 1:2

USDCHF → Retesting resistance will lead to a declineFX:USDCHF , having failed to reach its global target after breaking through support, is turning back to retest the zone of interest at 0.8157. A fall in the dollar could trigger a decline in prices...
After breaking through support and falling to 0.8055, a correction is forming towards the zone of interest and liquidity at 0.8157. After reaching the local target, the price may return to the global target (liquidity zone) at 0.8042.
The dollar returned to its downward phase at the opening of the session, to which the forex market reacted accordingly. Most likely, bearish pressure may also affect the USDCHF currency pair, which continues to follow the downward trend.
Resistance levels: 0.8157
Support levels: 0.8055, 0.8042
A retest of resistance amid high volatility could form a false breakout (liquidity capture) before the decline continues within the downtrend.
Best regards, R. Linda!
