USDCHF LONG READY!usdchf printed a good bullish signal for potential long setup I posted earlier. Full analysis details in related ideas below.
USDCHF trade ideas
USD/CHF💰Symbol: { USD/CHF }
🟩Price: { 0.79267 }
🟥Stop: { 0.78973 }
1️⃣profit: { 0.79506 }
2️⃣profit: { 0.79746 }
3️⃣profit: { 0.80058 }
📊Check your chart before entering.
🚨Check before use to make sure there is no important news.🚨

Bullish rise?USD/CHF is reacting off the support level which is a pullback support and could potentially rise from this level too ur take profit.
Entry: 0.7936
Why we like it:
There is a pullback support level.
Stop loss: 0.7900
Why we like it:
There is a pullback support level.
Take profit: 0.8001
Why we like it:
There is a pullback resistance that aligns with the 61.8% Fibonacci retracement.
Enjoying your TradingView experience? Review us!
Please be advised that the information presented on TradingView is provided to Vantage (‘Vantage Global Limited’, ‘we’) by a third-party provider (‘Everest Fortune Group’). Please be reminded that you are solely responsible for the trading decisions on your account. There is a very high degree of risk involved in trading. Any information and/or content is intended entirely for research, educational and informational purposes only and does not constitute investment or consultation advice or investment strategy. The information is not tailored to the investment needs of any specific person and therefore does not involve a consideration of any of the investment objectives, financial situation or needs of any viewer that may receive it. Kindly also note that past performance is not a reliable indicator of future results. Actual results may differ materially from those anticipated in forward-looking or past performance statements. We assume no liability as to the accuracy or completeness of any of the information and/or content provided herein and the Company cannot be held responsible for any omission, mistake nor for any loss or damage including without limitation to any loss of profit which may arise from reliance on any information supplied by Everest Fortune Group.
ABCHello awesome traders! 👑✨
I hope you’ve had an amazing weekend and are ready to kick off the trading week like pros. Let’s dive straight into our USD/CHF 2-Hour chart — it’s shaping up to be a high-probability ABC Bullish reversal to start July strong.
🧠 Setup Breakdown
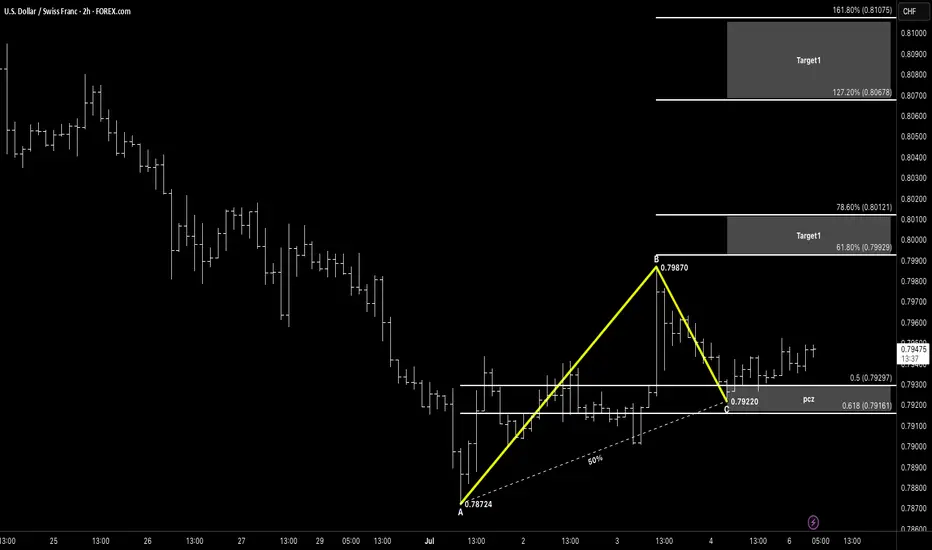
Pattern Type: ABC Bullish Reversal
A → B: Impulsive move from 0.78724 → 0.79870
B → C: Retracement down to 0.79220
Amplitude Symmetry:
AB ≈ BC in price distance (~120 pips)
BC retraces 50–61.8% of AB into the PCZ at 0.79297–0.79161
✅ Why This Works
Clean ABC structure with clear impulse & corrective legs
AB mirrors BC in amplitude—gives us a precise retracement zone
Horizontal support around 0.7925 converges into PCZ
⚔️ Entry & Risk Management
Entry Zone: Buy within 0.7916–0.7930 (PCZ)
Stop-Loss: Below C swing low at 0.79220, 5–10 pips lower (0.7910)
Risk: ≤ 1–2 % of account per trade
🎯 Profit Targets
TP1: 61.8 % retrace of B→C → 0.79929
TP2: 78.6 % retrace of B→C → 0.80121
TP3: 127.2 % extension of A→B → 0.80678
🔍 Confirmation & Invalid
Candlestick Rejection: Look for pin-bar or bullish engulfing at PCZ
Structure Break: Close back above the B→C trendline adds conviction
Invalidation: A decisive close below 0.7910 negates the setup — watch for further downside.
💡 Keep It Simple:
Pattern → Spot ABC with AB ≈ BC
PCZ → Wait for 50–61.8 % retracement of AB
Trigger → Bullish price action at C
Continuation → Ride the move toward TP zones
🔔 Watch USD drivers and SNB commentary for catalysts.
Wishing everyone a profitable week ahead — stay disciplined, manage risk like a sniper, and let structure lead, not emotions! 🚀
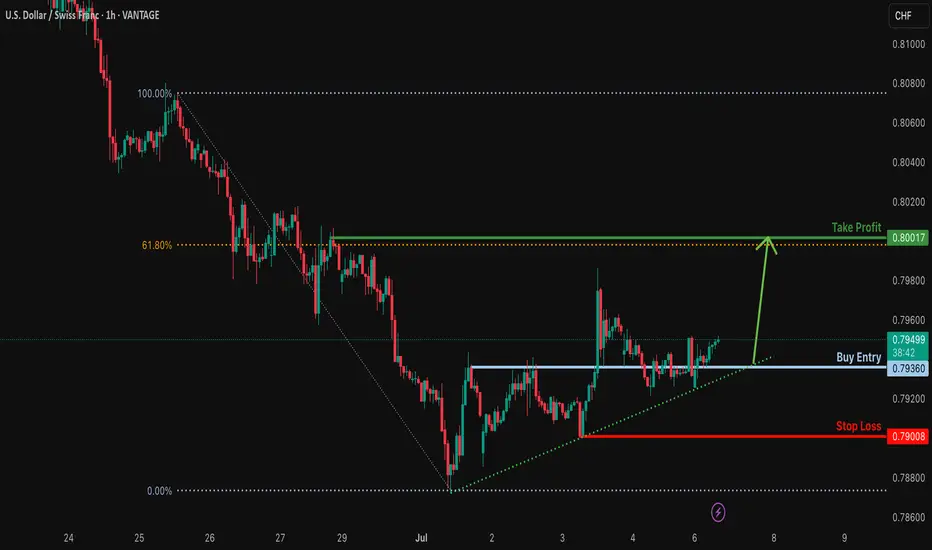
USD/CHF H1 | Multi-swing-low support at 61.8% Fibo retracementUSD/CHF is falling towards a multi-swing-low support and could potentially bounce off this level to climb higher.
Buy entry is at 0.7925 which is a multi-swing-low support that aligns closely with the 61.8% Fibonacci retracement.
Stop loss is at 0.7885 which is a level that lies underneath a multi-swing-low support and the 78.6% Fibonacci retracement.
Take profit is at 0.7974 which is a swing-high resistance.
High Risk Investment Warning
Trading Forex/CFDs on margin carries a high level of risk and may not be suitable for all investors. Leverage can work against you.
Stratos Markets Limited (tradu.com ):
CFDs are complex instruments and come with a high risk of losing money rapidly due to leverage. 63% of retail investor accounts lose money when trading CFDs with this provider. You should consider whether you understand how CFDs work and whether you can afford to take the high risk of losing your money.
Stratos Europe Ltd (tradu.com ):
CFDs are complex instruments and come with a high risk of losing money rapidly due to leverage. 63% of retail investor accounts lose money when trading CFDs with this provider. You should consider whether you understand how CFDs work and whether you can afford to take the high risk of losing your money.
Stratos Global LLC (tradu.com ):
Losses can exceed deposits.
Please be advised that the information presented on TradingView is provided to Tradu (‘Company’, ‘we’) by a third-party provider (‘TFA Global Pte Ltd’). Please be reminded that you are solely responsible for the trading decisions on your account. There is a very high degree of risk involved in trading. Any information and/or content is intended entirely for research, educational and informational purposes only and does not constitute investment or consultation advice or investment strategy. The information is not tailored to the investment needs of any specific person and therefore does not involve a consideration of any of the investment objectives, financial situation or needs of any viewer that may receive it. Kindly also note that past performance is not a reliable indicator of future results. Actual results may differ materially from those anticipated in forward-looking or past performance statements. We assume no liability as to the accuracy or completeness of any of the information and/or content provided herein and the Company cannot be held responsible for any omission, mistake nor for any loss or damage including without limitation to any loss of profit which may arise from reliance on any information supplied by TFA Global Pte Ltd.
The speaker(s) is neither an employee, agent nor representative of Tradu and is therefore acting independently. The opinions given are their own, constitute general market commentary, and do not constitute the opinion or advice of Tradu or any form of personal or investment advice. Tradu neither endorses nor guarantees offerings of third-party speakers, nor is Tradu responsible for the content, veracity or opinions of third-party speakers, presenters or participants.

How to mark your charts Lightning fast!One of the things I didn't like was marking my charts. I would take so much time marking my charts and adding the prices on the side. My mentor showed me the fastest way. Just use the FIB tool and use "0" and "1". Now you can focus on other important things. I want to thank my mentor for showing me this. Good luck to everyone

Market Review: DXY/GOLD/EQUITIES/CURRENCIESThe Dollar's Pivotal Juncture
The Dollar Index (DXY) is currently at a crucial inflection point. While the previous week's close below 98.00 confirmed a bearish scenario, our updated outlook for the upcoming week suggests a potential shift. The DXY is presently trading at 97.2. We are observing the DXY closely to see if it can break above its downward risk trendline. A decisive weekly candle close above the 98.00 - 99.00 range could signal a reversal pattern, indicating short-term dollar strength and a potential retracement higher. This would lead to a "Bullish Dollar Scenario," impacting correlated assets. Conversely, a continued bearish close for the DXY weekly candle will keep us on track for our previously outlined "Bearish Dollar Scenario" setups.

#USDCHF: Will USD Breakthrough The Strong Bearish Downtrend? The USDCHF currency pair has experienced significant volatility due to the ongoing trade dispute between the United States and China, which has led to a substantial decline in the DXY index. Consequently, CHF and JPY have emerged as the most stable currencies in the market.
Despite the USDCHF currency pair reversing its bullish trend, we anticipate a potential reversal back to a bearish position. We believe this reversal may be a temporary trap, and the currency pair is likely to regain its bullish position in the future.
There are two potential areas where the USDCHF currency pair could reverse from its current trend. The first area is relatively early, and if the USDCHF currency pair crosses a specific region, we may have a second safe option that could provide greater stability.
We extend our best wishes and best of luck in your trading endeavours. Your unwavering support is greatly appreciated.
If you wish to contribute, here are several ways you can assist us:
- Like our ideas
- Comment on our ideas
- Share our ideas
Team Setupsfx_🚀❤️

#USDCHF: 878+ PIPS Swing Buy In Making! Good Luck! Dear Traders,
OANDA:USDCHF
Price has been dropping since we had a change of character, there are many factors that are helping in USDCHF to drop. The mainly the first reason is CHF dominance in the market, CHF has been bullish ever since Gold continued the bullish trend, CHF, AUD and GOLD all of these three are positively correlated. Other fundamental reason is the blooming fear of recession in the US Market, on Friday we saw indices and stocks drop record high similarly to the first announcement of covid lockdown. USD index saw sharp drop due to this and it is likely that price will continue to do that on dxy index.

USDCHF: DXY Likely to remain bearish in long term! The USDCHF pair is likely to remain bearish in the coming days as DXY doesn’t show any bullish momentum. However, we expect DXY to be bullish in the short term, which will help the price reach our designated selling zone. Once the price reaches this zone and shows a reversal sign in a smaller timeframe, you can consider entering or taking any decision.
If you’d like to contribute, here are a few ways you can help us:
- Like our ideas
- Comment on our ideas
- Share our ideas
Team Setupsfx_🚀❤️

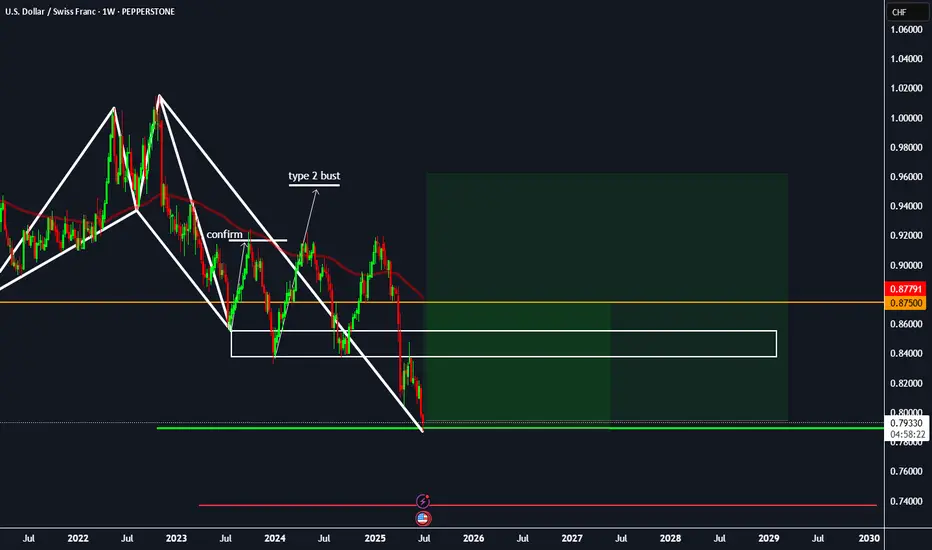
Sweep and Bounce: Will History Repeat in 2025?As you can see, the 2022 support broke, then in 2023 price came back to retest that level but got swept below it and fell further. The point from which it tried to retest got swept clean, then after taking a pullback from the lower low and trendline, price touched resistance again. Now, a similar thing is about to happen with the 2024 low— it broke, got retested in 2025, but the retest point, just like in 2023, got swept under. : Can price push up again after this sweep? tell me in comments OANDA:USDCHF

USDCHFRebound after blowing through low wicks. Prolonging current rate differentials and SnB possibly getting ahead of the FED things could get interesting. CHF has been THE BEST WORST performer, now with 0%, it's not that the USD is "strengthening" it's just that CHF is finally going to start to catch up in depreciation while 4% rates keep the USD relatively flat.
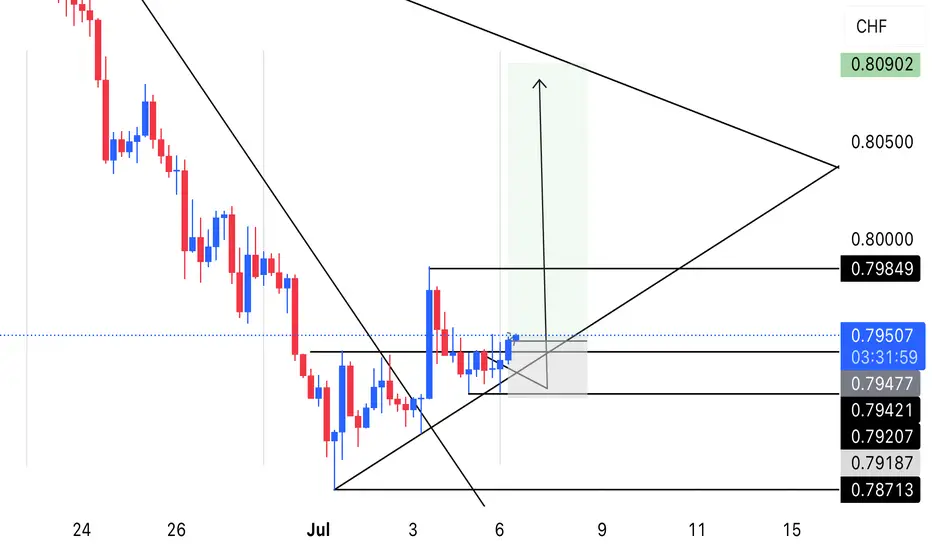
USDCHF POTENTIAL LONG Bearish trendline breakout, waiting for bullish trendline third touch with support @ 0.79250 zone. If there’s a strong bullish confirmation after impact, it’ll be a good signal to LONG USDCHF. Expecting the price to extend to at least 0.80000 psychological level.

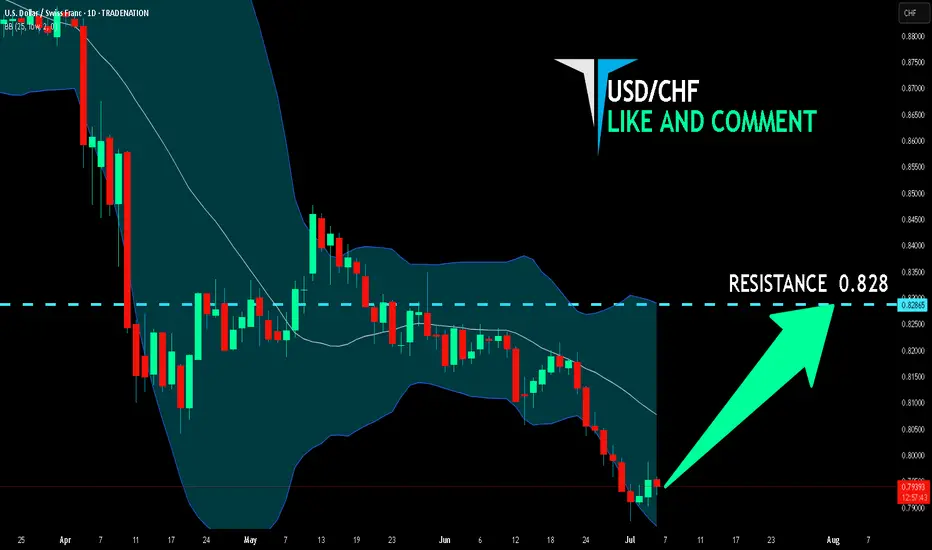
USD/CHF BULLS WILL DOMINATE THE MARKET|LONG
Hello, Friends!
Bullish trend on USD/CHF, defined by the green colour of the last week candle combined with the fact the pair is oversold based on the BB lower band proximity, makes me expect a bullish rebound from the support line below and a retest of the local target above at 0.828.
Disclosure: I am part of Trade Nation's Influencer program and receive a monthly fee for using their TradingView charts in my analysis.
✅LIKE AND COMMENT MY IDEAS✅
USD/CHF💰Symbol: { USD/CHF }
🟩Price: { 0.79398 }
🟥Stop: { 0.78872 }
1️⃣profit: { 0.79809 }
2️⃣profit: { 0.80192 }
3️⃣profit: { 0.80812 }
4️⃣profit: { 0.81342 }
5️⃣profit: { 0.81969 }
📊Check your chart before entering.
🚨Check before use to make sure there is no important news.🚨

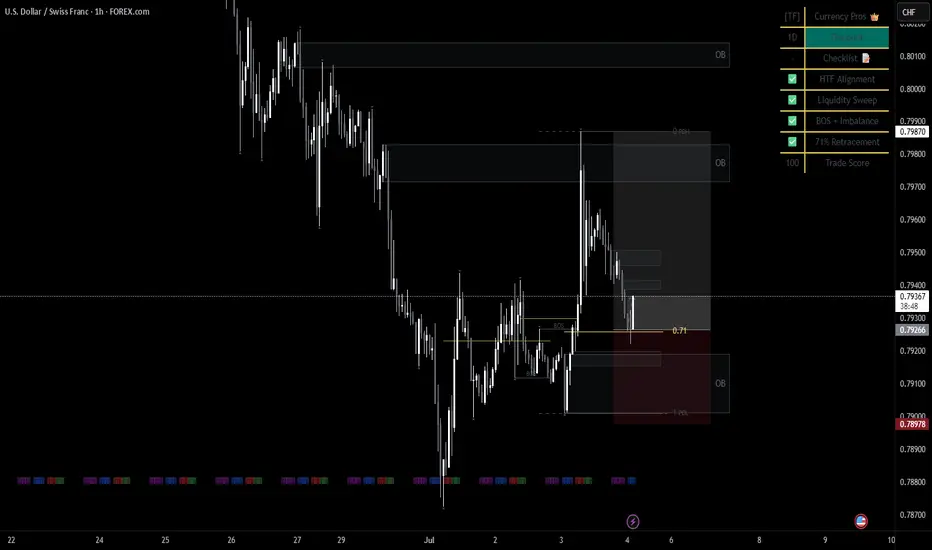
BUY USDCHFa few confirmations that influenced this trade. BOS, 71 fib & HTF alignment. I believe this will play out beautiful by Monday. lets goooooo
Usdchf short idea after reversalAn update of previous idea. I see this one in reversal mode.
Likely marker maker sell model playing out now.

USDCHF H1 I Bullish Bounce Off Based on the H1 chart analysis, the price is approaching our buy entry level at 0.7937, a pullback support,
Our take profit is set at 0.7987, an overlap resistance that aligns with the 78.6% Fibonacci retracement.
The stop loss is placed at 0.7900, an overlap support.
High Risk Investment Warning
Trading Forex/CFDs on margin carries a high level of risk and may not be suitable for all investors. Leverage can work against you.
Stratos Markets Limited (tradu.com ):
CFDs are complex instruments and come with a high risk of losing money rapidly due to leverage. 63% of retail investor accounts lose money when trading CFDs with this provider. You should consider whether you understand how CFDs work and whether you can afford to take the high risk of losing your money.
Stratos Europe Ltd (tradu.com ):
CFDs are complex instruments and come with a high risk of losing money rapidly due to leverage. 63% of retail investor accounts lose money when trading CFDs with this provider. You should consider whether you understand how CFDs work and whether you can afford to take the high risk of losing your money.
Stratos Global LLC (tradu.com ):
Losses can exceed deposits.
Please be advised that the information presented on TradingView is provided to Tradu (‘Company’, ‘we’) by a third-party provider (‘TFA Global Pte Ltd’). Please be reminded that you are solely responsible for the trading decisions on your account. There is a very high degree of risk involved in trading. Any information and/or content is intended entirely for research, educational and informational purposes only and does not constitute investment or consultation advice or investment strategy. The information is not tailored to the investment needs of any specific person and therefore does not involve a consideration of any of the investment objectives, financial situation or needs of any viewer that may receive it. Kindly also note that past performance is not a reliable indicator of future results. Actual results may differ materially from those anticipated in forward-looking or past performance statements. We assume no liability as to the accuracy or completeness of any of the information and/or content provided herein and the Company cannot be held responsible for any omission, mistake nor for any loss or damage including without limitation to any loss of profit which may arise from reliance on any information supplied by TFA Global Pte Ltd.
The speaker(s) is neither an employee, agent nor representative of Tradu and is therefore acting independently. The opinions given are their own, constitute general market commentary, and do not constitute the opinion or advice of Tradu or any form of personal or investment advice. Tradu neither endorses nor guarantees offerings of third-party speakers, nor is Tradu responsible for the content, veracity or opinions of third-party speakers, presenters or participants.

Usdchf long idea Piggybacking on the strong dollar idea as per previous posts. Today's data was positive for the greenback.
I want to see price draw higher into equal highs depicted with green line as an attractive premium liquidity pool.

Bullish bounce off pullback support?USD/CHF is falling towards the support level which is a pullback support that lines up with the 50% Fibonacci retracement and could bounce from this level to our take profit.
Entry: 0.7936
Why we like it:
There is a pullback support level that lines up with the 50% Fibonacci retracement.
Stop loss: 0.7900
Why we like it:
There is a pullback support level that aligns with the 78.6% Fibonacci retracement.
Take profit: 0.8034
Why we like it:
There is a pullback resistance level that aligns with the 50% Fibonacci retracement.
Enjoying your TradingView experience? Review us!
Please be advised that the information presented on TradingView is provided to Vantage (‘Vantage Global Limited’, ‘we’) by a third-party provider (‘Everest Fortune Group’). Please be reminded that you are solely responsible for the trading decisions on your account. There is a very high degree of risk involved in trading. Any information and/or content is intended entirely for research, educational and informational purposes only and does not constitute investment or consultation advice or investment strategy. The information is not tailored to the investment needs of any specific person and therefore does not involve a consideration of any of the investment objectives, financial situation or needs of any viewer that may receive it. Kindly also note that past performance is not a reliable indicator of future results. Actual results may differ materially from those anticipated in forward-looking or past performance statements. We assume no liability as to the accuracy or completeness of any of the information and/or content provided herein and the Company cannot be held responsible for any omission, mistake nor for any loss or damage including without limitation to any loss of profit which may arise from reliance on any information supplied by Everest Fortune Group.

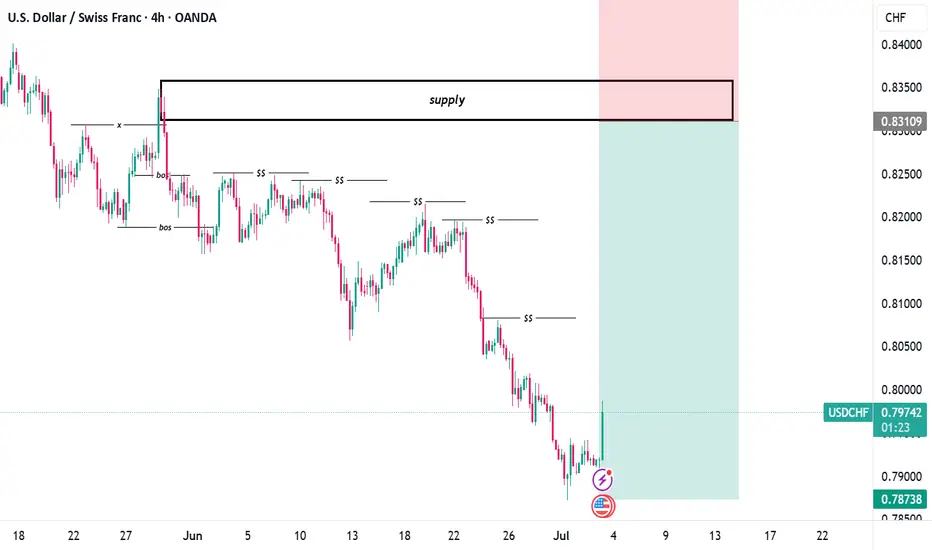
USD/CHF 4H – Pullback Into Supply Zone for Potential Reversal
🧠 USD/CHF 4H – Pullback Into Supply Zone for Potential Reversal
USD/CHF has been trading within a well-defined bearish structure over the past few weeks. Price action continues to respect lower highs and lower lows, with multiple short-term supports (SS) consistently being broken — confirming sustained selling pressure.
🔍 Market Structure & Smart Money Perspective
* A clear Break of Structure (BOS) early in the chart shifted market sentiment to bearish.
* Since then, the market has formed several short-term support levels, each broken successively.
* This confirms that bears are in control, and any rallies are likely corrective rather than a trend reversal — unless a new BOS to the upside forms.
🧱 Supply Zone Analysis
* The marked supply zone around 0.83100 – 0.84000 is the last institutional distribution zone before the significant drop.
* Price is currently retracing aggressively into this premium zone, following a likely liquidity sweep of the previous lows.
* This reaction is typical of smart money behavior — sweeping liquidity before initiating a retracement to mitigate orders or fill imbalances.
📈 Current Price Action
* The large bullish impulse may seem like a shift in momentum, but without a confirmed break of major structure, this is viewed as a pullback into premium pricing.
* We anticipate that price will react to the supply zone, presenting a high-probability shorting opportunity.
📌 Trade Idea
* Bias: Bearish (pending confirmation from supply)
* Entry Zone: 0.83100 – 0.84000
* Stop Loss: Above 0.84000 (to cover potential liquidity spikes)
* Take Profit: 0.78738 (prior demand zone)
* Risk-to-Reward: Approx. 1:4+
🧠 Confirmation Triggers to Watch For:
* Bearish engulfing candlesticks within supply
* Internal BOS on lower timeframe (LTF)
* Fair Value Gap (FVG) formation and reaction
* Weak bullish momentum/tap-and-reject from zone
📌Conclusion
This setup aligns with the Smart Money Concept framework. As long as price remains below the supply zone, my bias remains short. I’ll wait for lower timeframe confirmation before executing the trade.
⚠️ Always manage risk — this is a zone of interest, not an automatic sell. Let price show its hand.
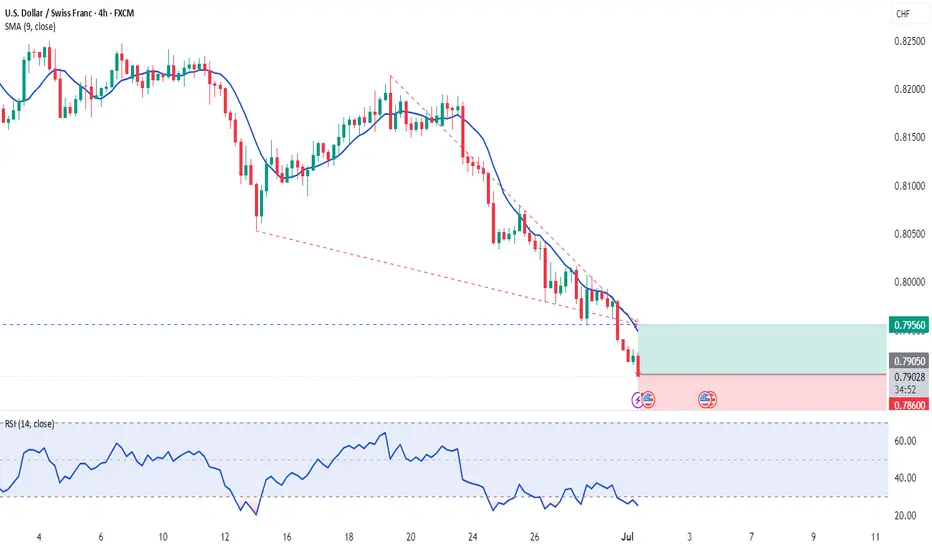
01.07.2025 #USDCHFBUY 0.79050 | STOP 0.78600 | TAKE 0.79560 | The impressive strength of the franc against the dollar. The pair is in a deep oversold condition. We expect a slight correction at these levels.
USD/CHF Slips LowerUSD/CHF Slips Lower
USD/CHF declined and now struggling below the 0.8000 resistance.
Important Takeaways for USD/CHF Analysis Today
- USD/CHF declined below the 0.8000 and 0.7950 support levels.
- There is a key bearish trend line forming with resistance near 0.7920 on the hourly chart at FXOpen.
USD/CHF Technical Analysis
On the hourly chart of USD/CHF at FXOpen, the pair started a fresh decline from well above the 0.8080 zone. The US Dollar dropped below the 0.8000 support to move into a negative zone against the Swiss Franc.
The bears pushed the pair below the 50-hour simple moving average and 0.7940. Finally, the bulls appeared near the 0.7870 level. A low was formed near 0.7872 and the pair is now consolidating losses.
There was a minor increase above the 23.6% Fib retracement level of the downward move from the 0.8080 swing high to the 0.7872 low. On the upside, the pair could face resistance near the 0.7920 level. There is also a key bearish trend line forming with resistance near 0.7920.
The next major resistance is near the 0.7940 level, above which the pair could test the 0.7975 level. It is close to the 50% Fib retracement level of the downward move from the 0.8080 swing high to the 0.7872 low.
If there is a clear break above the 0.7975 resistance zone, the pair could start another increase. In the stated case, it could even surpass 0.8030.
On the downside, immediate support on the USD/CHF chart is 0.7870. The first major support is near the 0.7850 level. The next major support is near 0.7800. Any more losses may possibly open the doors for a move toward the 0.7720 level in the coming days.
This article represents the opinion of the Companies operating under the FXOpen brand only. It is not to be construed as an offer, solicitation, or recommendation with respect to products and services provided by the Companies operating under the FXOpen brand, nor is it to be considered financial advice.
