USDCHF: Up for a ride?What we just saw on USDCHF is a classic move that catches many traders off guard:
Price swept the Previous Day’s Low (PDL)
That’s where most retail traders get stopped out.
It’s also where smart money often steps in.
Break of Structure (BOS) followed immediately
A clean shift in direction.
Momentum flipped bullish.
Fair Value Gap (FVG) below
That’s likely where price will return to rebalance.
If price respects that zone, the next destination?
The liquidity resting above.
This is one of those setups that reminds me:
It’s not about catching every move. It’s about understanding why the move happened.
Let’s see how it plays out.
USDCHF trade ideas

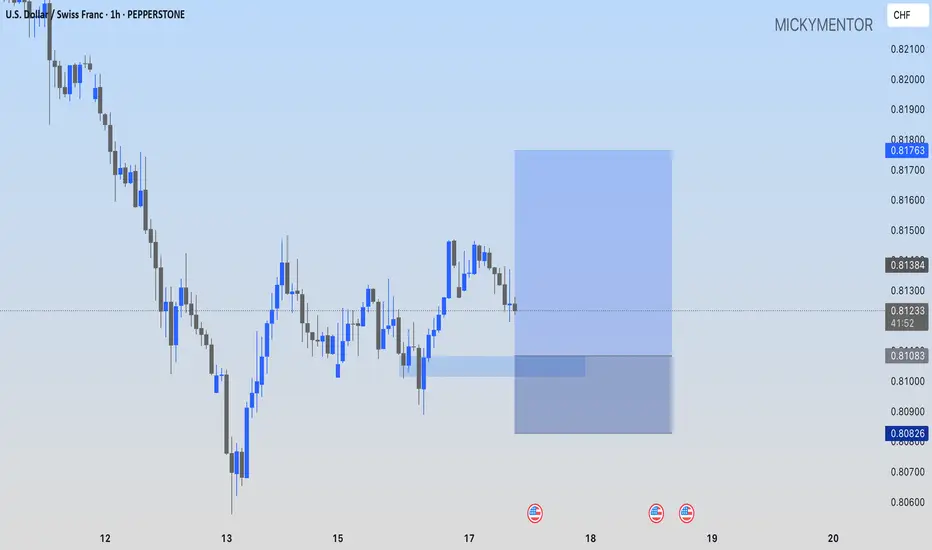
USDCHF: I'M GOING LONG AT 0.81083!!PEPPERSTONE:USDCHF I'm going long at 0.81083, looking at the 0.81763 as my target.
USD-CHF Bearish Bias! Sell!
Hello,Traders!
USD-CHF is trading in a
Downtrend and the pair
Is making a local bullish
Pullback but will soon
Hit a horizontal resistance
Level around 0.8185
So we are bearish biased
And we will be expecting
A further bearish move down
Sell!
Comment and subscribe to help us grow!
Check out other forecasts below too!
Disclosure: I am part of Trade Nation's Influencer program and receive a monthly fee for using their TradingView charts in my analysis.

Bearish continuation for the Swissie?The price is rising towards the pivot which has been identified as a pullback resistance that aligns with the 50% Fibonacci retracement and could drop to the 1st support.
Pivot: 0.8156
1st Support: 0.8055
1st Resistance: 0.8241
Risk Warning:
Trading Forex and CFDs carries a high level of risk to your capital and you should only trade with money you can afford to lose. Trading Forex and CFDs may not be suitable for all investors, so please ensure that you fully understand the risks involved and seek independent advice if necessary.
Disclaimer:
The above opinions given constitute general market commentary, and do not constitute the opinion or advice of IC Markets or any form of personal or investment advice.
Any opinions, news, research, analyses, prices, other information, or links to third-party sites contained on this website are provided on an "as-is" basis, are intended only to be informative, is not an advice nor a recommendation, nor research, or a record of our trading prices, or an offer of, or solicitation for a transaction in any financial instrument and thus should not be treated as such. The information provided does not involve any specific investment objectives, financial situation and needs of any specific person who may receive it. Please be aware, that past performance is not a reliable indicator of future performance and/or results. Past Performance or Forward-looking scenarios based upon the reasonable beliefs of the third-party provider are not a guarantee of future performance. Actual results may differ materially from those anticipated in forward-looking or past performance statements. IC Markets makes no representation or warranty and assumes no liability as to the accuracy or completeness of the information provided, nor any loss arising from any investment based on a recommendation, forecast or any information supplied by any third-party.

USDCHF Wave Analysis – 16 June 2025
- USDCHF reversed from key support level 0.8055
- Likely to rise to resistance level 0.8185
USDCHF currency pair recently reversed up from the key support level 0.8055, which stopped the previous impulse wave (1) at the end of April.
The support zone near the support level 0.8055 was strengthened by the lower daily Bollinger Band.
Given the oversold daily Stochastic, USDCHF currency pair can be expected to rise to the next resistance level 0.8185 (former support from May and the start of June).

USDCHF - Bearish Continuation STORY : Bearish Indications :
1- LH and LL
2- No Divergence
3- Symmetrical pattern
4- Seasonal Show USDCHF Bearish in June for last 15 years
Bullish Indications:
1- SXF on 1H time frame make a bearish Divergence which indicates a
strong corrective move in the index.
if that happens market will make breakout above 0.81565
Anticipation : I anticipate in order for the market to continue, the market will break the neck line and then continue bearish
Plan : Enter into the market with pending order (Sell Stop) and then wait for the TPs to hit as per mentioned target points.

USDCHF oversold rally capped by resistance at 0.8166The USD/CHF pair is currently trading with a bearish bias, aligned with the broader downward trend. Recent price action shows a corrective pullback, suggesting a temporary relief rally within the downtrend.
Key resistance is located at 0.8166, a prior consolidation zone. This level will be critical in determining the next directional move.
A bearish rejection from 0.8166 could confirm the resumption of the downtrend, targeting the next support levels at 0.8033, followed by 0.7990 and 0.7950 over a longer timeframe.
Conversely, a decisive breakout and daily close above 0.8166 would invalidate the current bearish setup, shifting sentiment to bullish and potentially triggering a move towards 0.8190, then 0.8220.
Conclusion:
The short-term outlook remains bearish unless the pair breaks and holds above 0.8166. Traders should watch for price action signals around this key level to confirm direction. A rejection favors fresh downside continuation, while a breakout signals a potential trend reversal or deeper correction.
This communication is for informational purposes only and should not be viewed as any form of recommendation as to a particular course of action or as investment advice. It is not intended as an offer or solicitation for the purchase or sale of any financial instrument or as an official confirmation of any transaction. Opinions, estimates and assumptions expressed herein are made as of the date of this communication and are subject to change without notice. This communication has been prepared based upon information, including market prices, data and other information, believed to be reliable; however, Trade Nation does not warrant its completeness or accuracy. All market prices and market data contained in or attached to this communication are indicative and subject to change without notice.

USDCHF 1:3USDCHF WAIT FOR FVG OB ENTRY 1:3.4
it's time to the buy udsdchf i think personility not for you dhe buy or sell but
i think usdchf touch last week ob HTF and market structur 4h its break and now wait for fvg or ob 4h and buy and going to tp in ob daily or 4h

USD/CHF BEARS ARE GAINING STRENGTH|SHORT
USD/CHF SIGNAL
Trade Direction: short
Entry Level: 0.821
Target Level: 0.815
Stop Loss: 0.826
RISK PROFILE
Risk level: medium
Suggested risk: 1%
Timeframe: 9h
Disclosure: I am part of Trade Nation's Influencer program and receive a monthly fee for using their TradingView charts in my analysis.
✅LIKE AND COMMENT MY IDEAS✅

USDCHFwe can see usdchf is looking bearish so with risk management we will be selling to the down side 1:2

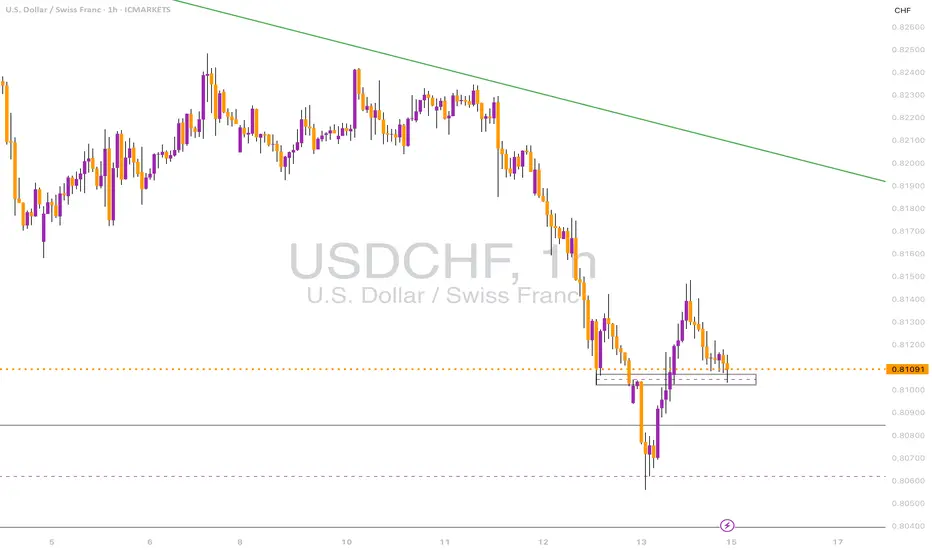
USDCHF → Retesting resistance will lead to a declineFX:USDCHF , having failed to reach its global target after breaking through support, is turning back to retest the zone of interest at 0.8157. A fall in the dollar could trigger a decline in prices...
After breaking through support and falling to 0.8055, a correction is forming towards the zone of interest and liquidity at 0.8157. After reaching the local target, the price may return to the global target (liquidity zone) at 0.8042.
The dollar returned to its downward phase at the opening of the session, to which the forex market reacted accordingly. Most likely, bearish pressure may also affect the USDCHF currency pair, which continues to follow the downward trend.
Resistance levels: 0.8157
Support levels: 0.8055, 0.8042
A retest of resistance amid high volatility could form a false breakout (liquidity capture) before the decline continues within the downtrend.
Best regards, R. Linda!


Bullish bounce off pullback support?The Swissie (USD/CHF) has bounced off the pivot, which has been identified as a pullback support and could rise to the 1st resistance that aligns with the 61.8% Fibonacci resistance.
Pivot: 0.8081
1st Support: 0.7931
1st Resistance: 0.8308
Risk Warning:
Trading Forex and CFDs carries a high level of risk to your capital and you should only trade with money you can afford to lose. Trading Forex and CFDs may not be suitable for all investors, so please ensure that you fully understand the risks involved and seek independent advice if necessary.
Disclaimer:
The above opinions given constitute general market commentary, and do not constitute the opinion or advice of IC Markets or any form of personal or investment advice.
Any opinions, news, research, analyses, prices, other information, or links to third-party sites contained on this website are provided on an "as-is" basis, are intended only to be informative, is not an advice nor a recommendation, nor research, or a record of our trading prices, or an offer of, or solicitation for a transaction in any financial instrument and thus should not be treated as such. The information provided does not involve any specific investment objectives, financial situation and needs of any specific person who may receive it. Please be aware, that past performance is not a reliable indicator of future performance and/or results. Past Performance or Forward-looking scenarios based upon the reasonable beliefs of the third-party provider are not a guarantee of future performance. Actual results may differ materially from those anticipated in forward-looking or past performance statements. IC Markets makes no representation or warranty and assumes no liability as to the accuracy or completeness of the information provided, nor any loss arising from any investment based on a recommendation, forecast or any information supplied by any third-party.

USDCHF H4 | Bearish Reversal Based on the H4 chart, the price is rising toward our sell entry level at 0.8169, a pullback resistance that aligns with the 61.8% Fibo retracement.
Our take profit is set at 0.8121, a pullback support.
The stop loss is set at 0.8208, a pullback resistance.
High Risk Investment Warning
Trading Forex/CFDs on margin carries a high level of risk and may not be suitable for all investors. Leverage can work against you.
Stratos Markets Limited (tradu.com ):
CFDs are complex instruments and come with a high risk of losing money rapidly due to leverage. 63% of retail investor accounts lose money when trading CFDs with this provider. You should consider whether you understand how CFDs work and whether you can afford to take the high risk of losing your money.
Stratos Europe Ltd (tradu.com ):
CFDs are complex instruments and come with a high risk of losing money rapidly due to leverage. 63% of retail investor accounts lose money when trading CFDs with this provider. You should consider whether you understand how CFDs work and whether you can afford to take the high risk of losing your money.
Stratos Global LLC (tradu.com ):
Losses can exceed deposits.
Please be advised that the information presented on TradingView is provided to Tradu (‘Company’, ‘we’) by a third-party provider (‘TFA Global Pte Ltd’). Please be reminded that you are solely responsible for the trading decisions on your account. There is a very high degree of risk involved in trading. Any information and/or content is intended entirely for research, educational and informational purposes only and does not constitute investment or consultation advice or investment strategy. The information is not tailored to the investment needs of any specific person and therefore does not involve a consideration of any of the investment objectives, financial situation or needs of any viewer that may receive it. Kindly also note that past performance is not a reliable indicator of future results. Actual results may differ materially from those anticipated in forward-looking or past performance statements. We assume no liability as to the accuracy or completeness of any of the information and/or content provided herein and the Company cannot be held responsible for any omission, mistake nor for any loss or damage including without limitation to any loss of profit which may arise from reliance on any information supplied by TFA Global Pte Ltd.
The speaker(s) is neither an employee, agent nor representative of Tradu and is therefore acting independently. The opinions given are their own, constitute general market commentary, and do not constitute the opinion or advice of Tradu or any form of personal or investment advice. Tradu neither endorses nor guarantees offerings of third-party speakers, nor is Tradu responsible for the content, veracity or opinions of third-party speakers, presenters or participants.

USDCHF LONGS?Looks like usdchf failed to break out the falling wedge after closing outside it and then closing back inside of it. Waiting for a retest of the lower boundary to take some potential longs this week

Bullish bounce off pullback support?USD/CHF is falling towards the support level which is a pullback support and could bounce from this level to our take profit.
Entry: 0.8066
Why we like it:
There is a pullback support.
Stop loss: 0.8031
Why we like it:
There is a support level at the 61% Fibonacci projection and the 127.2% Fibonacci extension.
Take profit: 0.8157
Why we lik eit:
There is an overlap resistance level.
Enjoying your TradingView experience? Review us!
Please be advised that the information presented on TradingView is provided to Vantage (‘Vantage Global Limited’, ‘we’) by a third-party provider (‘Everest Fortune Group’). Please be reminded that you are solely responsible for the trading decisions on your account. There is a very high degree of risk involved in trading. Any information and/or content is intended entirely for research, educational and informational purposes only and does not constitute investment or consultation advice or investment strategy. The information is not tailored to the investment needs of any specific person and therefore does not involve a consideration of any of the investment objectives, financial situation or needs of any viewer that may receive it. Kindly also note that past performance is not a reliable indicator of future results. Actual results may differ materially from those anticipated in forward-looking or past performance statements. We assume no liability as to the accuracy or completeness of any of the information and/or content provided herein and the Company cannot be held responsible for any omission, mistake nor for any loss or damage including without limitation to any loss of profit which may arise from reliance on any information supplied by Everest Fortune Group.

USDCHF TRADE SETUPWait for retest the entry level then take a trade for Sell otherwise skip this setup

UsdchfUsdchf have been on a down trend and we are expecting a high possibility retracment to the upside probably to the measure resistance but we will be stopping at the next zone then we wait for a break out from that zone if the isnno reaction of a buy continuation we wait and continue bearish

USDCHF: Bullish Continuation & Long Signal
USDCHF
- Classic bullish setup
- Our team expects bullish continuation
SUGGESTED TRADE:
Swing Trade
Long USDCHF
Entry Point - 0.8113
Stop Loss - 0.8074
Take Profit - 0.8182
Our Risk - 1%
Start protection of your profits from lower levels
Disclosure: I am part of Trade Nation's Influencer program and receive a monthly fee for using their TradingView charts in my analysis.
❤️ Please, support our work with like & comment! ❤️

USDCHF Holding Support – Eyes on Trendline RejectionUSDCHF is respecting a key 1D support zone around 0.8100, showing some reaction after a strong downtrend.
• 1D Chart: Testing horizontal support and trendline from Jan-May range.
• 4H Chart: Weak reaction so far – no strong bullish candles yet.
• 1H & 23m Chart: Retesting small 1H order block structure.
Key Zones:
• Support: 0.8080–0.8100
• Resistance: 0.8160 / 0.8210
Bias: Watching for bullish reversal signals. Otherwise, continuation lower below 0.8080.
USDCHF (15/06/25)On Monday 16th June, we expect consolidation bcoz we expect no high impact news ,on Tuesday price is expected to reach the bearish daily fvg then reverse down around and below Mondays open
