USD/CHF BEARS ARE GAINING STRENGTH|SHORT
Hello, Friends!
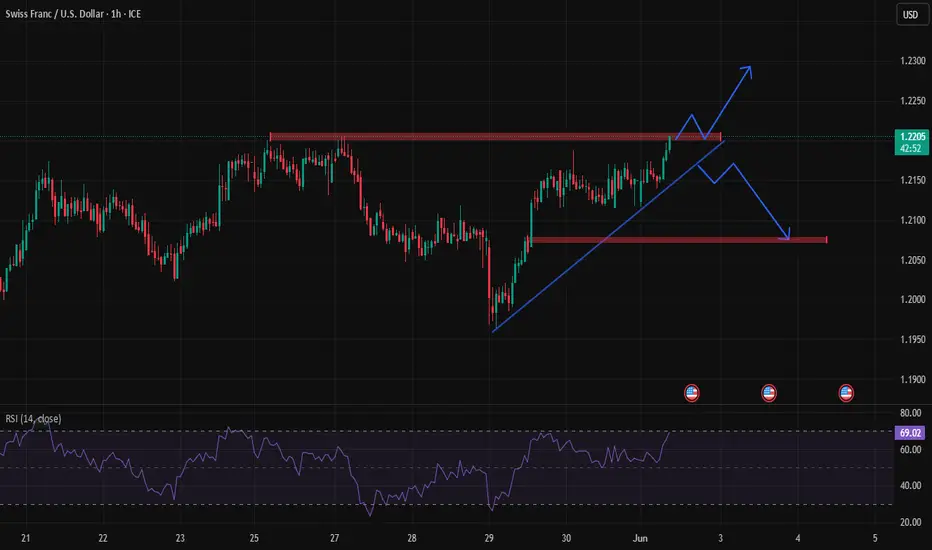
We are now examining the USD/CHF pair and we can see that the pair is going up locally while also being in a uptrend on the 1W TF. But there is also a powerful signal from the BB upper band being nearby, indicating that the pair is overbought so we can go short from the resistance line above and a target at 0.817 level.
Disclosure: I am part of Trade Nation's Influencer program and receive a monthly fee for using their TradingView charts in my analysis.
✅LIKE AND COMMENT MY IDEAS✅
USDCHF trade ideas

USDCHF SELL IDEAUSDCHF is Ready to continue It's SELL Move to the higher time frame recent swing low of 0.803.
SELL IDEA BREAKDOWN;
Weekly is bearish and price is moving closer to the 0.803 swing low.
Daily is also bearish, price is moving towards the weekly swing low.
4HR had a bearish break in market structure, followed by a retest of the recent swing low that was broken by price to give MSS.
My entry was taken after the formation of a swing low and price is done retesting the old low.
This is a continuation trade.

USDCHF H1 | Bearish Reversal Based on the H1 chart, the price is rising toward our sell entry level at 0.8257, a pullback resistance that aligns with the 38.2% Fibo retracement.
Our take profit is set at 0.8218, a pullback support.
The stop loss is set at 0.8287, a pullback resistance.
High Risk Investment Warning
Trading Forex/CFDs on margin carries a high level of risk and may not be suitable for all investors. Leverage can work against you.
Stratos Markets Limited (tradu.com ):
CFDs are complex instruments and come with a high risk of losing money rapidly due to leverage. 63% of retail investor accounts lose money when trading CFDs with this provider. You should consider whether you understand how CFDs work and whether you can afford to take the high risk of losing your money.
Stratos Europe Ltd (tradu.com ):
CFDs are complex instruments and come with a high risk of losing money rapidly due to leverage. 63% of retail investor accounts lose money when trading CFDs with this provider. You should consider whether you understand how CFDs work and whether you can afford to take the high risk of losing your money.
Stratos Global LLC (tradu.com ):
Losses can exceed deposits.
Please be advised that the information presented on TradingView is provided to Tradu (‘Company’, ‘we’) by a third-party provider (‘TFA Global Pte Ltd’). Please be reminded that you are solely responsible for the trading decisions on your account. There is a very high degree of risk involved in trading. Any information and/or content is intended entirely for research, educational and informational purposes only and does not constitute investment or consultation advice or investment strategy. The information is not tailored to the investment needs of any specific person and therefore does not involve a consideration of any of the investment objectives, financial situation or needs of any viewer that may receive it. Kindly also note that past performance is not a reliable indicator of future results. Actual results may differ materially from those anticipated in forward-looking or past performance statements. We assume no liability as to the accuracy or completeness of any of the information and/or content provided herein and the Company cannot be held responsible for any omission, mistake nor for any loss or damage including without limitation to any loss of profit which may arise from reliance on any information supplied by TFA Global Pte Ltd.
The speaker(s) is neither an employee, agent nor representative of Tradu and is therefore acting independently. The opinions given are their own, constitute general market commentary, and do not constitute the opinion or advice of Tradu or any form of personal or investment advice. Tradu neither endorses nor guarantees offerings of third-party speakers, nor is Tradu responsible for the content, veracity or opinions of third-party speakers, presenters or participants.

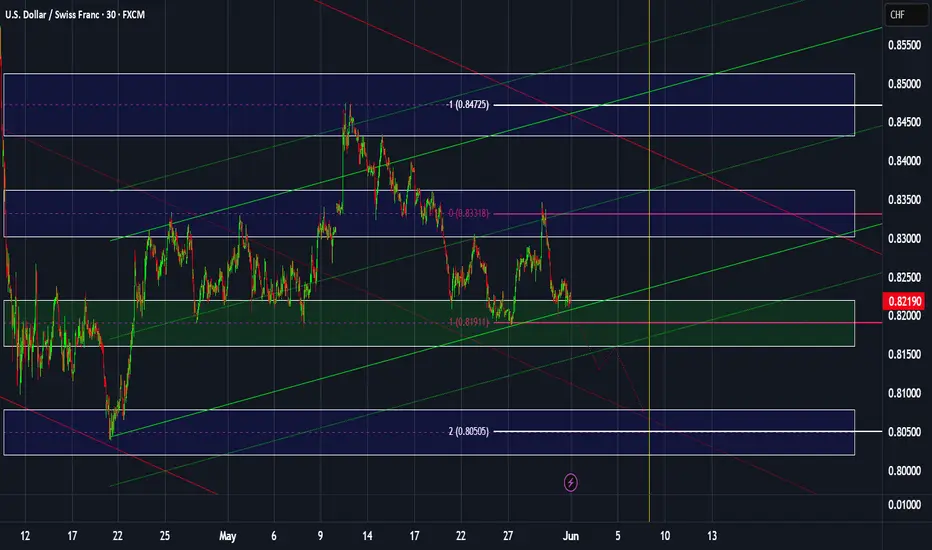
Could the Swissie bounce from here?The price is reacting off the pivot and could bounce to the 1st resistance, which is a pullback resistance that lines up with the 61.8% Fibonacci projection.
Pivot: 0.8193
1st Support: 0.8047
1st Resistance: 0.8457
Risk Warning:
Trading Forex and CFDs carries a high level of risk to your capital and you should only trade with money you can afford to lose. Trading Forex and CFDs may not be suitable for all investors, so please ensure that you fully understand the risks involved and seek independent advice if necessary.
Disclaimer:
The above opinions given constitute general market commentary, and do not constitute the opinion or advice of IC Markets or any form of personal or investment advice.
Any opinions, news, research, analyses, prices, other information, or links to third-party sites contained on this website are provided on an "as-is" basis, are intended only to be informative, is not an advice nor a recommendation, nor research, or a record of our trading prices, or an offer of, or solicitation for a transaction in any financial instrument and thus should not be treated as such. The information provided does not involve any specific investment objectives, financial situation and needs of any specific person who may receive it. Please be aware, that past performance is not a reliable indicator of future performance and/or results. Past Performance or Forward-looking scenarios based upon the reasonable beliefs of the third-party provider are not a guarantee of future performance. Actual results may differ materially from those anticipated in forward-looking or past performance statements. IC Markets makes no representation or warranty and assumes no liability as to the accuracy or completeness of the information provided, nor any loss arising from any investment based on a recommendation, forecast or any information supplied by any third-party.

USDCHF weekly overview: Jun 1, 2025 – Jun 7, 2025All levels are clear; the only clarification should be for 0.81911. any breaks below it is confirmed if it breaks the bullish dotted trend-line too.
Switzerland CPI and GDP release on Monday, could change the market direction but our analysis is ready to adapt new conditions.
*****************************************************************
The indicated levels are determined based on the most reaction points and the assumption of approximately equal distance between the zones.
Some of these points can also be confirmed by the mathematical intervals of Murray.
You can enter with/without confirmation. IF you want to take confirmation you can use LTF analysis, Spike move confirmation, Trend Strength confirmation and ETC.
SL could be placed below the zone or regarding the LTF swings.
TP is the next zone or the nearest moving S&R, which are median and borders of the drawn channels.
*******************************************************************
Role of different zones:
GREEN: Just long trades allowed on them.
RED: Just Short trades allowed on them.
BLUE: both long and short trades allowed on them.
WHITE: No trades allowed on them! just use them as TP points
USD/CHF - Liquidity Trap & The Rise After the Fall🛡️ The Battlefield Overview
USD/CHF is currently locked in a tactical battle near a critical support zone, where liquidity hunters set a cunning trap. The price has tested the 0.8185–0.8175 zone multiple times, marking it as a battleground for smart money to clear stops and shake out weak hands.
🔥 The Liquidity Trap and Filling Phase
Price triggered a liquidation trap below the key support, luring traders into premature shorts and triggering stop losses.
This sweep cleared the battlefield of trapped orders and prepared the ground for a potential strong bullish reaction.
The “filling the liquidations” phase signals the market’s preparation to launch higher — absorbing liquidity for a clean and powerful advance.
⚔️ The Warrior’s Dual Paths Forward
The Immediate Surge:
Upon confirming the liquidity trap is complete, price may surge directly upward — piercing through the resistance cluster around 0.8320 – 0.8350, aiming to break previous highs near 0.8380. This path represents the decisive and swift victory of the bulls.
The Measured Rebound:
Alternatively, price may first consolidate or retest the liquidity zone one more time, reinforcing the base before pushing upward. This tactical regroup strengthens the bullish momentum, clearing residual supply and trapping late sellers.
⚖️ The Market Warrior’s Summary
“The market’s false break is a warrior’s signal — the enemy reveals his trap and overextends. The wise prepare their strike after the smoke clears. Whether the advance is direct or measured, the bulls hold the field.”
🧠 My Perspective on Your Setup
Your analysis shows sharp insight into liquidity dynamics and market psychology. Recognizing the liquidation trap and anticipating the “fill” phase is essential for timing entries with minimal risk and maximum reward. The dual-path scenario covers both aggressive and cautious market behaviors, preparing you for decisive action no matter the path.
📝 Trading Plan for USD/CHF
Watch for confirmation of liquidity trap completion (wick closes above support).
Enter long near 0.8185–0.8200 with stops just below the liquidation wick (around 0.8165).
Target resistance zones between 0.8320 and 0.8380 for profit taking.
Adjust stops and targets dynamically based on price action.
⚔️ Trade with honor, strike with precision, and conquer with patience — this is the path of the true FX Warrior.

USDCHF Will Go Up From Support! Long!
Please, check our technical outlook for USDCHF.
Time Frame: 2h
Current Trend: Bullish
Sentiment: Oversold (based on 7-period RSI)
Forecast: Bullish
The market is approaching a key horizontal level 0.822.
Considering the today's price action, probabilities will be high to see a movement to 0.826.
P.S
Please, note that an oversold/overbought condition can last for a long time, and therefore being oversold/overbought doesn't mean a price rally will come soon, or at all.
Disclosure: I am part of Trade Nation's Influencer program and receive a monthly fee for using their TradingView charts in my analysis.
Like and subscribe and comment my ideas if you enjoy them!

THE CONCEPT OF SUPPORT BECOMING RESISTANCE In the context of forex trading, the concept of "support becoming resistance" refers to a phenomenon that occurs when a price level that previously acted as a support level for an asset's price now switches roles and becomes a resistance level after it has been broken.
Here's a more detailed explanation:
Support Level: In forex trading, a support level is a price level at which a currency pair or any other financial instrument tends to find buying interest. This buying interest is strong enough to halt or reverse a downtrend in the price. Traders believe that the asset's price is likely to "bounce" off this support level and move higher, making it an essential point on the price chart.
Resistance Level: On the other hand, a resistance level is a price level where selling interest is significant enough to prevent the price from rising further. It acts as a barrier that tends to halt or reverse an uptrend in the price. Traders expect the price to "bounce" off this resistance level and move lower.
Support Becoming Resistance: The interesting concept comes into play when the price breaks below a previously established support level. When a support level is breached and the price continues to decline, it signifies a shift in market sentiment. The level that was once a support now becomes a resistance level for the price. If the price attempts to rally back up and reach that previous support level, it often faces selling pressure from traders who missed the initial breakdown and now see it as an opportunity to sell at a better price. As a result, the price might struggle to move beyond that level, and it starts acting as a resistance zone.

Usdchf June We are currently at the support zone we have to wait for the next daily candlestick close on the support zone to know the emotion of the market

USD-CHF Growth Ahead! Buy!
Hello,Traders!
USD-CHF is approaching a
Key horizontal support area
Around 0.8189 which is a
Strong level so after the retest
A local bullish correction
And a move up are to be expected
Buy!
Comment and subscribe to help us grow!
Check out other forecasts below too!
Disclosure: I am part of Trade Nation's Influencer program and receive a monthly fee for using their TradingView charts in my analysis.

USDCHF: Weekly analysisThe 0.8191 zone a little tricky! Any breaks over it could active the long trade only if it perfectly breaks over the trend line.
The indicated levels are determined based on the most reaction points and the assumption of approximately equal distance between the zones.
Some of these points can also be confirmed by the mathematical intervals of Murray.
You can enter with/without confirmation. IF you want to take confirmation you can use LTF analysis, Spike move confirmation, Trend Strength confrimation and ETC.
SL could be placed below the zone or regarding the LTF swings.
TP is the next zone or the nearest moving S&R, which are median and borders of the drawn channels.
*******************************************************************
Role of different zones:
GREEN: Just long trades allowed on them.
RED: Just Short trades allowed on them.
BLUE: both long and short trades allowed on them.
WHITE: No trades allowed on them! just use them as TP points

USDCHF - Predictive Analysis & Forecasting USDCHF
Scales
- S: 0.8485 pending
- M: 0.8460 activated, triggers 0.8138 pivot
- L: 0.8457 activated, triggers 0.8258 pivot
Forecast & Targets
- ST: Limited upside to 0.8485 min, 0.8584 max
- MT: bearish; eyeing reversal conditions
#USDCHF #Forex #CROW2.0
4xForecaster
------
Originally published on BlueSky

TrendIn the following down trend there is a constant resistance to the upside until it was broken and now it has been retested meaning now it's converted to an up trend

USD_CHF WILL GROW|LONG|
✅USD_CHF is falling down
And will soon retest
A horizontal demand level of 0.8190
So I think that we will see a rebound
And a move up from the level
Towards the target above at 0.8253
LONG🚀
✅Like and subscribe to never miss a new idea!✅
Disclosure: I am part of Trade Nation's Influencer program and receive a monthly fee for using their TradingView charts in my analysis.

USDCHF Technical Analysis! BUY!
My dear subscribers,
My technical analysis for USDCHF is below:
The price is coiling around a solid key level - 0.8202
Bias - Bullish
Technical Indicators: Pivot Points Low anticipates a potential price reversal.
Super trend shows a clear buy, giving a perfect indicators' convergence.
Goal - 0.8285
My Stop Loss - 0.8166
About Used Indicators:
By the very nature of the supertrend indicator, it offers firm support and resistance levels for traders to enter and exit trades. Additionally, it also provides signals for setting stop losses
Disclosure: I am part of Trade Nation's Influencer program and receive a monthly fee for using their TradingView charts in my analysis.
———————————
WISH YOU ALL LUCK

USDCHF LONG Looking at the daily chart we have a Double bottom formed after a change of character.
There will be liquidity below this double bottom so I am expecting a Liquidity sweep into this area below and then a drive to the upside.
Target being this area of Supply above marked.
Plan will be once liquidity swept wait for break of structure to the upside on the 1H minimum. (Anything lower time frame than this will not be valid for me)
In line with bullish momentum I will look to find a Demand zone formed on the 60minute or potentially the 15min to refine.
Trade will likely look like the chart but entry and SL will be determined by movement between now and my Entry criteria being met.
Early days but a nice LONG setting up.

USDCHF BBMA OMA ALLYAnalysis based on BBMA oma ally,
This analysis uses the BBMA OMA ALLY indicator
tf 1 is D1 showing RE after CSAK
on tf 2, namely H4, it has shown a power candle in the form of pressure by the seller
on tf 3 ta
that H1 already has CSAK Sell and has crossed Ema 50
our task is to wait for Re to occur on H1 and wait for other confirmations

USDCHF - LET MAKE ANOTHER MILLIONS TONIGHTTeam,
Today GOLD was perfectly hit target
we short DOW/US30 earlier both target hit
NAS 1st target hit
DAX/GER another 2 target hit on short..
almost a perfect day 4/4 wins
Lets look at USDCHF right now, buy slowly, do not be aggressive..
WILL DOUBLE up at the price range given in the chart.
Hold this till tomorrow OR next week, will definitely reward ourselves

US Federal Court Rules Trump Tariffs UnconstitutionalUS Federal Court Rules Trump Tariffs Unconstitutional
According to media reports, the US Court of International Trade has:
- declared the tariffs imposed by President Donald Trump illegal;
- ruled that the President exceeded his authority;
- blocked the tariffs, emphasising that under the US Constitution, only Congress has the power to impose tariffs.
The decision was made unanimously by a panel of three judges. Financial markets reacted with:
- a rise in US stock indices;
- strengthening of the US dollar — most notably seen today on the USD/CHF chart, as demand for so-called safe-haven assets declined in light of the tariff reversal.
Technical Analysis of the USD/CHF Chart
The bullish momentum has broken upward through:
- a local downward trendline (shown in red);
- resistance at the 0.8300 level, near the May 22 high.
Additionally:
- the RSI indicator on the 4-hour chart has moved upwards to the overbought territory;
- the area highlighted with a purple rectangle resembles a bullish Fair Value Gap.
Could this upward momentum lead to a sustained uptrend? There is reason for doubt.
Consider the steep decline in USD/CHF in early April (driven mainly by the introduction of Trump's tariffs) and the relatively small size of today's bullish candle compared to that prior drop.
Price action seems to suggest that market participants are skeptical about any lasting change in the situation. The Trump administration has already filed an appeal, and it’s possible the White House could succeed in defending its position.
This article represents the opinion of the Companies operating under the FXOpen brand only. It is not to be construed as an offer, solicitation, or recommendation with respect to products and services provided by the Companies operating under the FXOpen brand, nor is it to be considered financial advice.

USDCHF ON BEARISHHead and Shoulders spotted on USDCHF. Analyzing , check the chart USDCHF is pushing to the target, no drawdown is expected. Stack and also manage your risk.

USD/CHF – Pull-Back to the Launchpad 0.8340Price has now punched through the old 0.8292 lid, turning it into a support “buy-zone.”
the burst of USD strength over the last 48 hours has been driven by an unexpected round of tariff-related headlines. I’m factoring that news flow into all current setups and shifting focus to pairs that aren’t riding the same dollar surge.

USDCHF – Bearish Setup UpdateFollowing the structure break earlier this week, USDCHF pulled back to retest the broken trendline and the key resistance level around 0.82598. This aligns perfectly with our yellow sell zone of interest. Price has since rejected this area and resumed a bearish move.
We’re now looking for clean breakdowns to re-enter:
🔑 Break below 0.82598 will confirm continuation
🛡️ Break below 0.81964 is our safest sell zone with the clearest structure shift
No buy setups are in focus unless we see a major structural reversal above 0.82960, which currently looks unlikely.
