USDCHF BEARISH OUTLOOK!!Price broke out of a major support level of 0.80962 giving traders a bearish sentiment on USDCHF from the daily timeframe perspective. How are market participants likely to react to this trend? Are we likely to see a pullback before the market continues trading bearish? Let’s see how market conditions reacts over the coming week
USDCHF trade ideas

USDCHF Will Grow! Long!
Here is our detailed technical review for USDCHF.
Time Frame: 9h
Current Trend: Bullish
Sentiment: Oversold (based on 7-period RSI)
Forecast: Bullish
The market is approaching a significant support area 0.796.
The underlined horizontal cluster clearly indicates a highly probable bullish movement with target 0.804 level.
P.S
We determine oversold/overbought condition with RSI indicator.
When it drops below 30 - the market is considered to be oversold.
When it bounces above 70 - the market is considered to be overbought.
Disclosure: I am part of Trade Nation's Influencer program and receive a monthly fee for using their TradingView charts in my analysis.
Like and subscribe and comment my ideas if you enjoy them!

Bearish drop off pullback resistance?USD/CHF is reacting off the resistance level which is a pullback resistance that lines up with the 38.2% Fibonacci retracement and could drop from this level to our take profit.
Entry: 0.7959
Why we like it:
There is a pullback resistance level that lines up with the 38.2% Fibonacci retracement.
Stop loss: 0.7986
Why we like it:
There is a pullback resistance that is slightly above the 78.6% Fibonacci retracement.
Take profit: 0.7900
Why we like it:
There is a pullback support.
Enjoying your TradingView experience? Review us!
Please be advised that the information presented on TradingView is provided to Vantage (‘Vantage Global Limited’, ‘we’) by a third-party provider (‘Everest Fortune Group’). Please be reminded that you are solely responsible for the trading decisions on your account. There is a very high degree of risk involved in trading. Any information and/or content is intended entirely for research, educational and informational purposes only and does not constitute investment or consultation advice or investment strategy. The information is not tailored to the investment needs of any specific person and therefore does not involve a consideration of any of the investment objectives, financial situation or needs of any viewer that may receive it. Kindly also note that past performance is not a reliable indicator of future results. Actual results may differ materially from those anticipated in forward-looking or past performance statements. We assume no liability as to the accuracy or completeness of any of the information and/or content provided herein and the Company cannot be held responsible for any omission, mistake nor for any loss or damage including without limitation to any loss of profit which may arise from reliance on any information supplied by Everest Fortune Group.

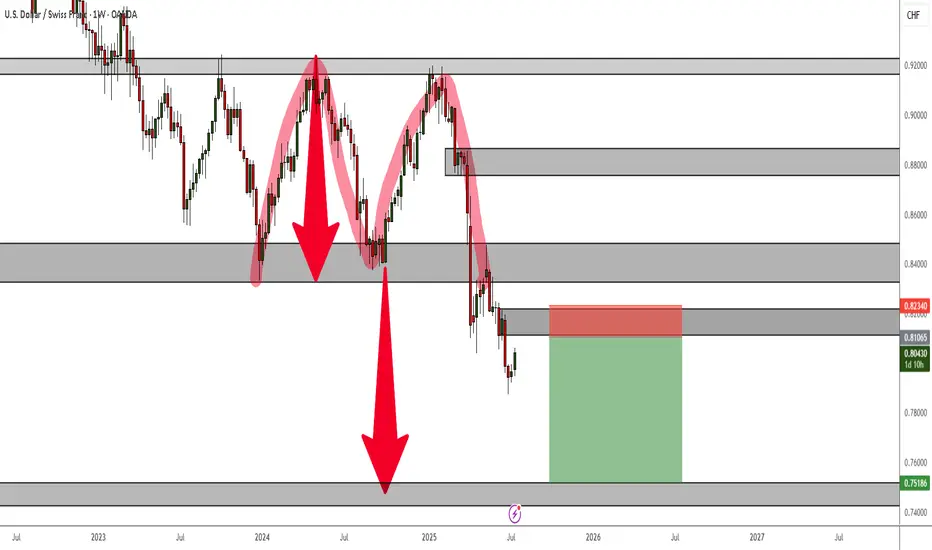
Setupsfx_ | USDCHF: A Big Major Swing Sell In Making 760+ Pips The USDCHF pair has dropped significantly since our last update. We anticipate another drop before price may reverse. DXY is also dropping and may continue to decline. There’s a major swing target that will take time to complete successfully. Use risk management according to your own risk tolerance.
Thank you for your continued support!
Team Setupsfx_


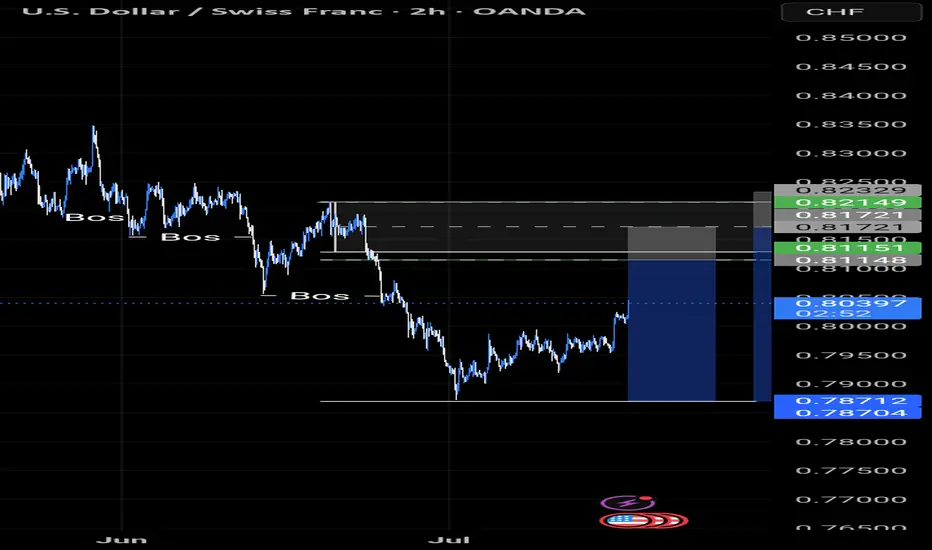
USDCHF ENTRY CHARTWe are BULLISH on this Pair, as we have a shift in trend at yesterday's daily close, the INTRA-DAY TF trend as also shifted to the upside, on our h1, we got a breaker block+ inducement with other confluences, if this matches with your idea, you can add to your watch-list. THANK YOU

USD/CHF hoping lower. before major up turnA note to myself:
- remember no matter what happens. its a 50/50 chance you are right. even with a winning
strategy.
- whats going on inside of yourself. why? whats it trying to tell you?
- what have you learned about yoursefl?
- be patient, take a breathe and be aware of FOMO
- Its not about quantity. its about quality.(choose MAX. 3 trades a week)
- stick to your plan. load up on quality trades.
- RISK MANAGEMENT is the key to being a successful trader AND Risk Reward Ratio minimum 1:3 w

USDCHF – Two Levels, One PlanWe’re watching two key resistance zones for a potential short.
If the first level holds and gives a signal, we’ll short from there.
If that level breaks, we may switch to a short-term buy up to the next level.
Once price reaches the second resistance, we’ll be ready for another sell opportunity.
No predictions — just following the flow.

USD CHF shortA possible scenario for USD/CHF with a good risk-to-reward ratio could be a viable setup.

USDCHF | DOWNTREND CONTINUATIONUSDCHF seems to be in bearish continuation since it has not exhibited bullish divergence on RSI.

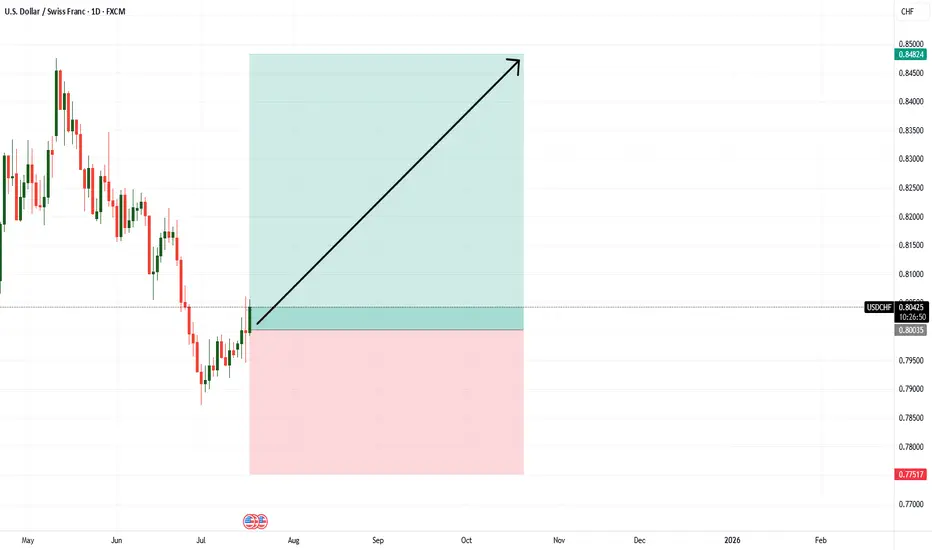
USDCHF long term bullish playHello,
The USDCHF is back to where it last traded in mid 2011. This reflects a significant weakening of the U.S. dollar against the Swiss franc, erasing over a decade of gains. It suggests growing investor demand for safe-haven assets like the franc — possibly driven by concerns around U.S. interest rate policy, inflation trends, or broader global uncertainty. The last time the dollar was this weak against the franc was more than 13 years ago.
While a weaker dollar is seen as good for the United States, we see a long term buy opportunity for this pair from the current level based on technical analysis. The pair is now trading at the bottom of the range.
Next week will be an important time for this pair as we wait for the inflation data. This will be key in guiding what the FED might do during the next meeting towards the end of the month.

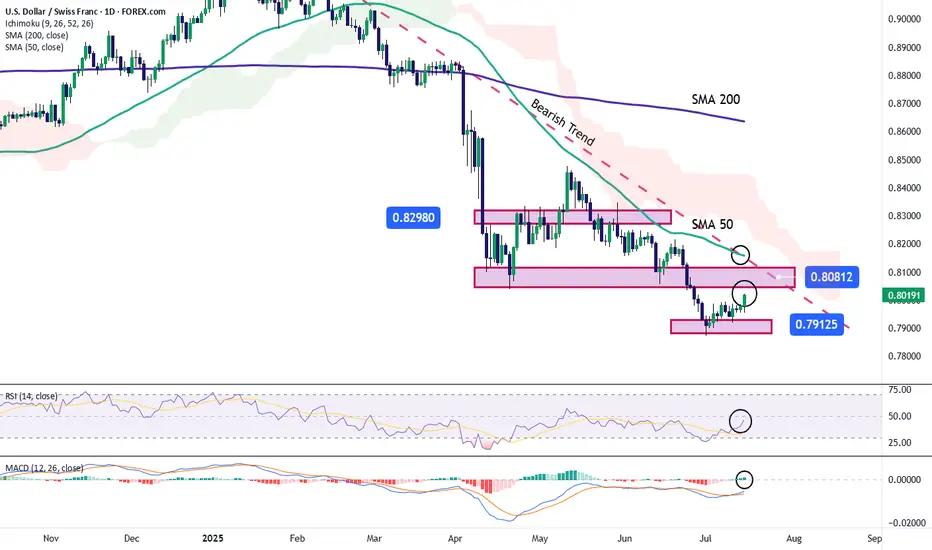
USD/CHF: The Swiss Franc Continues to WeakenOver the past four trading sessions, the USD/CHF pair has appreciated by nearly 0.5%, as a new bullish bias has begun to consolidate on the daily chart. For now, buying pressure remains steady, supported by the recovery of the U.S. dollar, which started gaining strength shortly after it was revealed that the year-over-year CPI in the U.S. came in at 2.7%, above the 2.6% expected. This outcome may lead the Federal Reserve to adopt a more hawkish tone, and if elevated interest rates persist, it’s likely that demand for the dollar will continue to strengthen in the short term.
Downtrend Still in Place
The recent bearish movements have kept the pair within a steady downward trend in the short term. However, a relevant bullish correction is now emerging, and if it continues, it could put the current bearish structure at risk. As price continues to test resistance levels, buying pressure may become increasingly relevant.
Technical Indicators:
RSI: The RSI line is showing clear bullish behavior, with a sustained upward slope in the short term. It is currently approaching the neutral 50 level, and a breakout above that could signal bullish momentum dominance, reinforcing the current upward pressure.
MACD: The MACD histogram shows consistent bullish momentum, remaining above the neutral zero line. This suggests that moving average strength remains in bullish territory, and if the histogram continues to move away from the neutral axis, it could confirm stronger buying pressure in the short term.
Key Levels to Watch:
0.80812 – Immediate Resistance: This level aligns with the main descending trendline on the chart. Sustained movement above this zone could invalidate the current bearish structure and open the door to a more dominant bullish bias.
0.82980 – Distant Resistance: A zone that coincides with previous highs. If price consistently reaches this level, it could trigger the formation of a new bullish structure in the coming weeks.
0.79125 – Key Support: This level marks the recent weekly lows. A break below this zone could revive bearish momentum and potentially initiate a broader downward trend in the short term.
Written by Julian Pineda, CFA – Market Analyst
USDCHF Double Top Rejection - Bearish Setup for Long Term TradeA Double Top Rejection on the weekly TF is currently at play and despite the current bullish correction, the trend is still very much bearish.
For long-term or position traders, this is an ideal setup to take and hold.
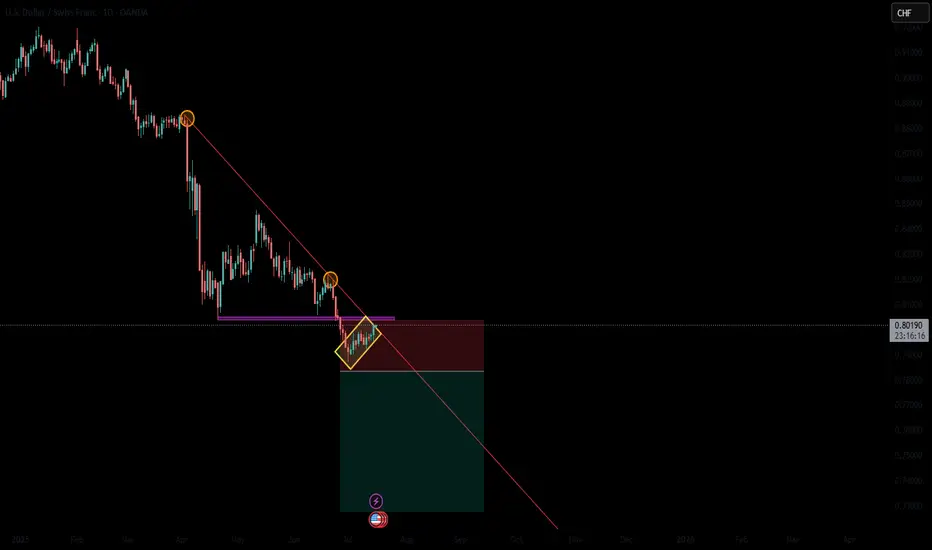
long-term bearish trendUSD/CHF is in a strong long-term bearish trend, and the recent move up is likely a temporary correction, not a reversal. Price is currently testing the 0.7980–0.8000 resistance zone, which aligns with the upper boundary of a descending channel and could attract sellers. Unless the pair breaks and holds above 0.8050–0.8100, the bearish trend remains intact. A rejection in this area or a break below 0.7870 would confirm continuation to lower targets like 0.7790 and 0.7710. In short, it's a good setup to consider a sell, but wait for clear bearish confirmation.
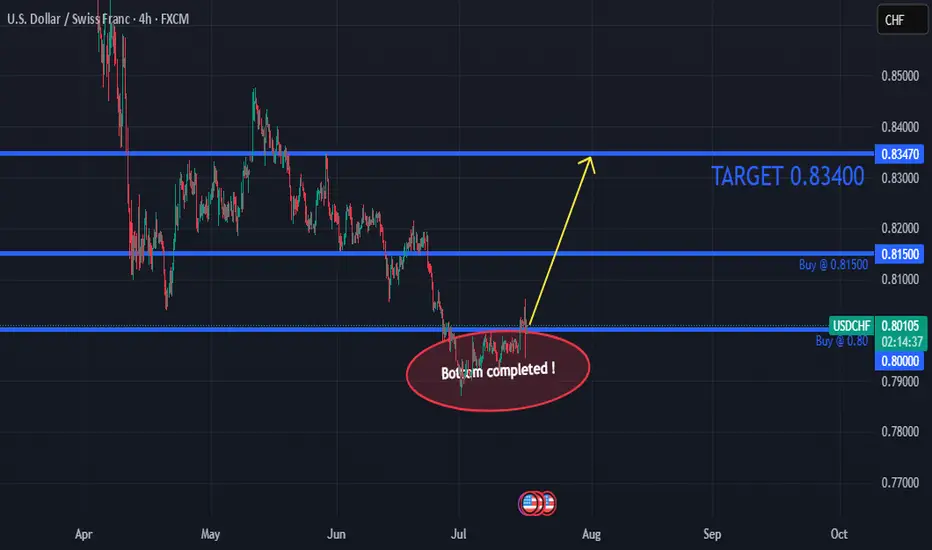
USDCHF Time for STRONG BUYBottom completed. It is now time to start opening buy positions ONLY... until 0.83400
Sell USDCHFShort scalp on USDCHF. Trading what I see now, and I see a head and shoulder pattern. Let's risk and see how it goes.

USDCHF LongUSDCHF is now net long on the regression break.
I am using my EA on this pair as it has positive roll long.
FX Wars Episode 6 - The return of the USDA simple idea, which I will gradually fill with life:
The USD returns and with it the claim to its FX throne.
Act 1:
📊🔮🇺🇲 US retail sales, which will be published today at 14:30, will be higher than consensus expectations.
🟡-> the US consumer is alive and well and will continue to keep the US economy afloat.
Further acts will follow ✅️
USDCHF TRADE IDEA Just like on GBPCHF, we seem to be pulling back to our Fibonacci level for a continuation move to the downside on USDCHF.
Let's see what the market does and how it unfolds.
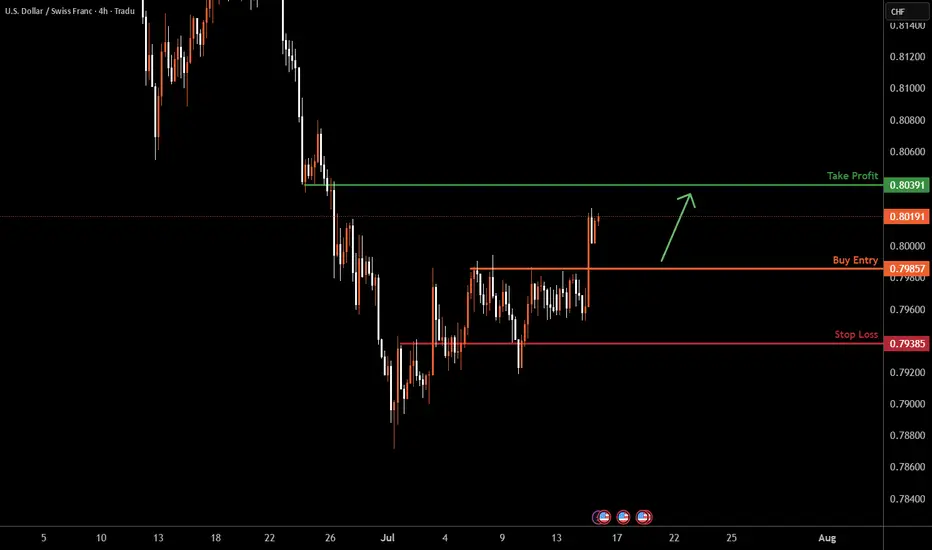
USDCHF H4 I Bullish Bounce Off Based on the H4 chart analysis, we can see that the price could fall toward our buy entry at 0.7985 which is a pullback support.
Our take profit will be at 0.8039, which is a pullback resistance level.
The stop loss will be placed at 0.7938, which is a pullback support level.
High Risk Investment Warning
Trading Forex/CFDs on margin carries a high level of risk and may not be suitable for all investors. Leverage can work against you.
Stratos Markets Limited (tradu.com ):
CFDs are complex instruments and come with a high risk of losing money rapidly due to leverage. 63% of retail investor accounts lose money when trading CFDs with this provider. You should consider whether you understand how CFDs work and whether you can afford to take the high risk of losing your money.
Stratos Europe Ltd (tradu.com ):
CFDs are complex instruments and come with a high risk of losing money rapidly due to leverage. 63% of retail investor accounts lose money when trading CFDs with this provider. You should consider whether you understand how CFDs work and whether you can afford to take the high risk of losing your money.
Stratos Global LLC (tradu.com ):
Losses can exceed deposits.
Please be advised that the information presented on TradingView is provided to Tradu (‘Company’, ‘we’) by a third-party provider (‘TFA Global Pte Ltd’). Please be reminded that you are solely responsible for the trading decisions on your account. There is a very high degree of risk involved in trading. Any information and/or content is intended entirely for research, educational and informational purposes only and does not constitute investment or consultation advice or investment strategy. The information is not tailored to the investment needs of any specific person and therefore does not involve a consideration of any of the investment objectives, financial situation or needs of any viewer that may receive it. Kindly also note that past performance is not a reliable indicator of future results. Actual results may differ materially from those anticipated in forward-looking or past performance statements. We assume no liability as to the accuracy or completeness of any of the information and/or content provided herein and the Company cannot be held responsible for any omission, mistake nor for any loss or damage including without limitation to any loss of profit which may arise from reliance on any information supplied by TFA Global Pte Ltd.
The speaker(s) is neither an employee, agent nor representative of Tradu and is therefore acting independently. The opinions given are their own, constitute general market commentary, and do not constitute the opinion or advice of Tradu or any form of personal or investment advice. Tradu neither endorses nor guarantees offerings of third-party speakers, nor is Tradu responsible for the content, veracity or opinions of third-party speakers, presenters or participants.
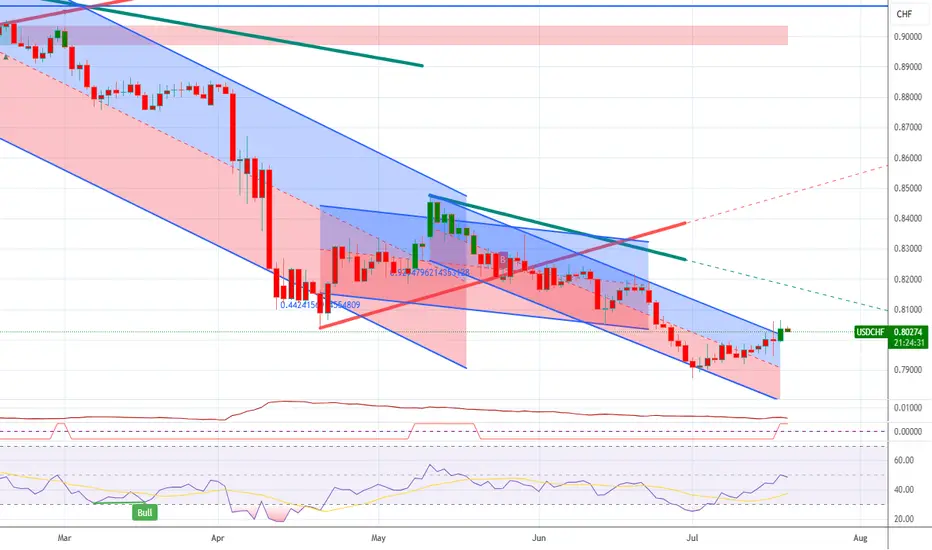
USDCHF is due for reboundThe USDCHF is showing some interesting signs that a rebound could be on the horizon. Looking at the weekly chart, it's clear that the pair has been under considerable selling pressure—it's not only dipped below the 20-period and 60-period EMAs, but it's also trading in territory that historically marks previous turning points. When USDCHF reaches these oversold levels, there's often a technical bounce as sellers run out of steam and bargain-hunters step in.
Another point worth highlighting is the Fibonacci retracement. The technicals suggest a key rebound target around the 0.8535 level, which aligns with the 50% retracement from the last major swing down. This area isn't just a mathematical target—it also coincides with previous congestion and resistance zones, making it a logical place for bulls to aim for. So, with prices oversold, historical patterns favoring a longer rebound, and a clear technical target overhead, the pieces are falling into place for a USDCHF recovery heading into the autumn months.

USDCHF Wave Analysis – 15 July 2025
- USDCHF reversed from support zone
- Likely to rise to resistance level 0.8055
USDCHF currency pair recently reversed from the support zone lying at the intersection of the support level 0.7900, lower daily Bollinger Band and the support trendline of the daily down channel from May.
The upward reversal from support zone started the active short-term ABC correction ii.
Given the strongly bullish US dollar sentiment seen today, USDCHF currency pair can be expected to rise to the next resistance level 0.8055 (former strong support from April and June).

7.15 USD/CHF WATCH FOR A PULLBACKThis market has a VERY strong S/R zone, certainly worth keeping an eye on for the pullback and the other indicators to line up with it.........4 Hour chart is what I use for the setup then I go down to the 1 Hour chart for the entry. We will wait and see if this develops into something for us.
