usdchf down trendtarget pivot :83400
Risk Warning:
Trading Forex and CFDs carries a high level of risk to your capital and you should only trade with money you can afford to lose. Trading Forex and CFDs may not be suitable for all investors, so please ensure that you fully understand the risks involved and seek independent advice if necessary.
USDCHF trade ideas

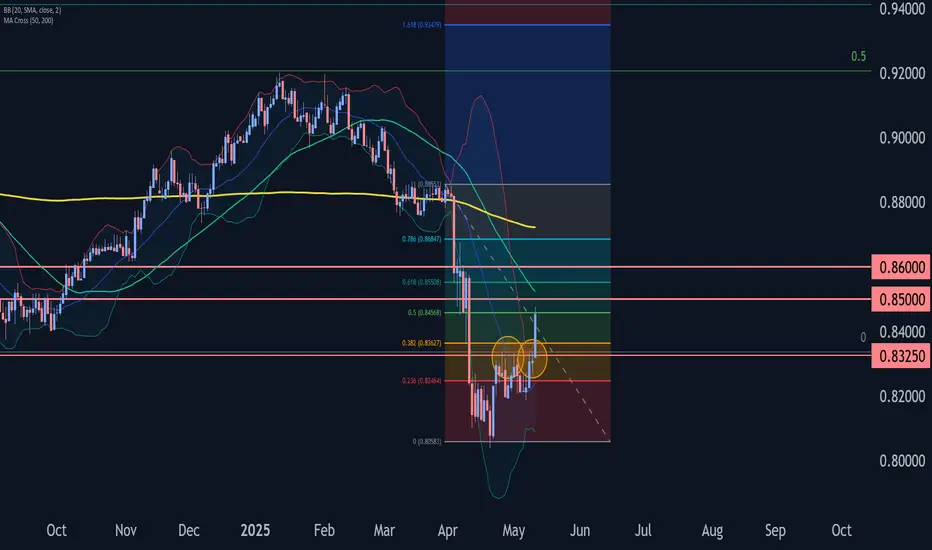
USDCHF Analysis: Break & Retest or Mean Reversion?Hello traders!
USDCHF is offering two trading scenarios on the daily timeframe.
The first scenario suggests the pair may react bearishly from the resistance zone, setting up a break-and-retest opportunity that could drive price lower toward the 0.80001 area.
The second scenario anticipates a bounce toward the 0.89100 region, where a mean reversion setup may come into play (if sellers step in and price action confirms bearish intent near that resistance).
Discretionary Trading: Where Experience Becomes the Edge
Discretionary trading is all about making decisions based on what you see, what you feel, and what you've learned through experience. Unlike systematic strategies that rely on fixed rules or algorithms, discretionary traders use their judgment to read the market in real time. It's a skill that can't be rushed, because it's built on screen time, pattern recognition, and the ability to stay calm under pressure.
There's no shortcut here. You need to see enough market conditions, wins, and losses to build that intuition—the kind that tells you when to pull the trigger or sit on your hands. Charts might look the same, but context changes everything, and that's something only experience can teach you.
At the end of the day, discretionary trading is an art, refined over time, sharpened through mistakes, and driven by instinct. It's not for everyone, but for those who've put in the work, it can be a powerful way to trade.

Bearish reversal?The Swissie (USD/CHF) is rising towards the pivot, which lines up with the 61.8% Fibonacci retracement and could drop to the 1st support, which is a pullback support.
Pivot: 0.8519
1st Support: 0.8334
1st Resistance: 0.8604
Risk Warning:
Trading Forex and CFDs carries a high level of risk to your capital and you should only trade with money you can afford to lose. Trading Forex and CFDs may not be suitable for all investors, so please ensure that you fully understand the risks involved and seek independent advice if necessary.
Disclaimer:
The above opinions given constitute general market commentary, and do not constitute the opinion or advice of IC Markets or any form of personal or investment advice.
Any opinions, news, research, analyses, prices, other information, or links to third-party sites contained on this website are provided on an "as-is" basis, are intended only to be informative, is not an advice nor a recommendation, nor research, or a record of our trading prices, or an offer of, or solicitation for a transaction in any financial instrument and thus should not be treated as such. The information provided does not involve any specific investment objectives, financial situation and needs of any specific person who may receive it. Please be aware, that past performance is not a reliable indicator of future performance and/or results. Past Performance or Forward-looking scenarios based upon the reasonable beliefs of the third-party provider are not a guarantee of future performance. Actual results may differ materially from those anticipated in forward-looking or past performance statements. IC Markets makes no representation or warranty and assumes no liability as to the accuracy or completeness of the information provided, nor any loss arising from any investment based on a recommendation, forecast or any information supplied by any third-party.

USDCHF H4 I Bullish Bounce Off Based on the H4 chart analysis, the price is falling toward our buy entry level at 0.8316, a pullback support.
Our take profit is set at 0.8509, a pullback resistance.
The stop loss is placed at 0.8184 , a swing low support.
High Risk Investment Warning
Trading Forex/CFDs on margin carries a high level of risk and may not be suitable for all investors. Leverage can work against you.
Stratos Markets Limited (tradu.com):
CFDs are complex instruments and come with a high risk of losing money rapidly due to leverage. 63% of retail investor accounts lose money when trading CFDs with this provider. You should consider whether you understand how CFDs work and whether you can afford to take the high risk of losing your money.
Stratos Europe Ltd (tradu.com):
CFDs are complex instruments and come with a high risk of losing money rapidly due to leverage. 63% of retail investor accounts lose money when trading CFDs with this provider. You should consider whether you understand how CFDs work and whether you can afford to take the high risk of losing your money.
Stratos Global LLC (tradu.com):
Losses can exceed deposits.
Please be advised that the information presented on TradingView is provided to Tradu (‘Company’, ‘we’) by a third-party provider (‘TFA Global Pte Ltd’). Please be reminded that you are solely responsible for the trading decisions on your account. There is a very high degree of risk involved in trading. Any information and/or content is intended entirely for research, educational and informational purposes only and does not constitute investment or consultation advice or investment strategy. The information is not tailored to the investment needs of any specific person and therefore does not involve a consideration of any of the investment objectives, financial situation or needs of any viewer that may receive it. Kindly also note that past performance is not a reliable indicator of future results. Actual results may differ materially from those anticipated in forward-looking or past performance statements. We assume no liability as to the accuracy or completeness of any of the information and/or content provided herein and the Company cannot be held responsible for any omission, mistake nor for any loss or damage including without limitation to any loss of profit which may arise from reliance on any information supplied by TFA Global Pte Ltd.
The speaker(s) is neither an employee, agent nor representative of Tradu and is therefore acting independently. The opinions given are their own, constitute general market commentary, and do not constitute the opinion or advice of Tradu or any form of personal or investment advice. Tradu neither endorses nor guarantees offerings of third-party speakers, nor is Tradu responsible for the content, veracity or opinions of third-party speakers, presenters or participants.

USD/CHF Reversal Setup (Read-Caption)🧠 Professional Technical Analysis – USD/CHF 💱
🗓️ Date: May 6, 2025
🕰️ Timeframe: Likely 4H or Daily
📊 Current Price: ~0.82218
🔍 Technical Indicators
🔵 EMA 20: 0.84190 (short-term trend)
🔴 EMA 50: 0.82524 (mid-term trend)
❗ Bearish crossover: EMA 20 is below EMA 50 → short-term bearish bias 🐻
📉 Support Zone Analysis 🛡️
🟥 Key Demand Zone (Support): 0.82084 – 0.81437
🔁 Price has bounced here before 🪃
🕯️ Candles with long lower wicks = buyers stepping in 🧍♂️💪
🟠 This is the “bounce zone” 📈
🧭 Trade Idea
✅ Long Entry: Around 0.82084–0.82200
🛑 Stop Loss: Below 0.81437 ❌
🎯 Take Profit: Around 0.83600 🟢
⚖️ Risk/Reward: Excellent (>2:1) if bounce holds 🚀
🔄 Price Action Outlook
📉 Downtrend approaching major support
🕯️ Looking for bullish candlestick confirmation (engulfing, hammer, etc.)
📈 Target area aligns with mean reversion to EMA 20
📌 Conclusion
👀 Watching for bullish reversal signs 🔄
🛒 Buy zone is clearly defined ✅
⛔ Setup is invalidated if price closes below 0.81437

Day 2 of the £20 to £1million challenge- Doubled the account!Day 2 of my epic challenge changing £20 to £1million within 1 year. Doubled the account size and reviewed my choice of trades tomorrow based upon current price structure and value. Bring on USDCHF for the win!

USDCHF Wave Analysis – 12 May 2025
- USDCHF broke resistance area
- Likely to rise to resistance levels 0.8500 and 0.8600
USDCHF currency pair recently broke the resistance area between the resistance level 0.8325 (which stopped the previous waves A and (b)) and the 38.2% Fibonacci correction of the downward impulse 5 from April.
The breakout of this resistance area accelerated the C-wave of the active ABC correction (2) from the middle of last month.
Given the strongly bullish US dollar sentiment seen today, USDCHF currency pair can be expected to rise to the next resistance levels 0.8500 and 0.8600.
Could the price reverse from here?USD/CHF is rising towards the resistance level, which is a pullback resistance that is slightly below the 61.8% Fibonacci retracement and could reverse from this level to our take profit.
Entry: 0.85076
Why we like it:
There is a pullback resistance level that is slightly below the 61.8% Fibonacci retracement.
Stop loss: 0.8619
Why we like it:
There is a pullback resistance level that lines up with the 71% Fibonacci retracement.
Take profit: 0.8366
Why we like it:
There is a pullback support.
Enjoying your TradingView experience? Review us!
Please be advised that the information presented on TradingView is provided to Vantage (‘Vantage Global Limited’, ‘we’) by a third-party provider (‘Everest Fortune Group’). Please be reminded that you are solely responsible for the trading decisions on your account. There is a very high degree of risk involved in trading. Any information and/or content is intended entirely for research, educational and informational purposes only and does not constitute investment or consultation advice or investment strategy. The information is not tailored to the investment needs of any specific person and therefore does not involve a consideration of any of the investment objectives, financial situation or needs of any viewer that may receive it. Kindly also note that past performance is not a reliable indicator of future results. Actual results may differ materially from those anticipated in forward-looking or past performance statements. We assume no liability as to the accuracy or completeness of any of the information and/or content provided herein and the Company cannot be held responsible for any omission, mistake nor for any loss or damage including without limitation to any loss of profit which may arise from reliance on any information supplied by Everest Fortune Group.

usdchf update According to the previous analysis, the USD/CHF rate reached the 0.84 range, and the prediction was successfully fulfilled !

USDCHF - Important Breakout !Hello Traders !
The USDCHF formed a rectangle pattern.
The price broke the resistance level (0.83350 - 0.82931).
This key level becomes new support !
So, I expect a bullish move🚀
________________
TARGET: 0.85890🎯

USDCHF Trade Opportunity AnalysisGood morning, esteemed traders,
Today, I would like to bring your attention to a significant trading opportunity regarding the USDCHF currency pair. After experiencing a considerable decline throughout April, we have observed a consolidation phase lasting over a month. Importantly, USDCHF has attempted to breach the resistance level at approximately 0.8343 on three separate occasions, indicating strong interest at this pivotal price point.
Notably, we witnessed a false breakdown earlier this week, which likely served to lure additional sellers into the market. This move has set the stage for a potential bullish breakout . I anticipate a target of 322 pips from this trade, positioning it as a medium-term opportunity with an attractive Risk-to-Reward ratio of 1:2.
Here are the particulars for this trade setup:
- Entry Price: 0.8343
- Stop Loss: 0.8181
- Profit Target: 0.8666
As always, I encourage you to conduct your own analysis and consider your risk tolerance before entering any positions. Wishing you all profitable trading.
Best regards,
Ehsan

USDCHF LONG FORECAST Q2 W20 D12 Y25USDCHF LONG FORECAST Q2 W20 D12 Y25
Professional Risk Managers👋
Welcome back to another FRGNT chart update📈
Diving into some Forex setups using predominantly higher time frame order blocks alongside confirmation breaks of structure.
Let’s see what price action is telling us today!
💡Here are some trade confluences📝
✅Weekly order block rejection
✅Daily order block rejection
✅15’ order block
✅Intraday bullish breaks of structure
🔑 Remember, to participate in trading comes always with a degree of risk, therefore as professional risk managers it remains vital that we stick to our risk management plan as well as our trading strategies.
📈The rest, we leave to the balance of probabilities.
💡Fail to plan. Plan to fail.
🏆It has always been that simple.
❤️Good luck with your trading journey, I shall see you at the very top.
🎯Trade consistent, FRGNT X

Bearish reversal?The Swissie (USD/CHF) is rising towards the pivot and could reverse to the 1st support, which is a pullback support.
Pivot: 0.8391
1st Support: 0.8195
1st Resistance: 0.8598
Risk Warning:
Trading Forex and CFDs carries a high level of risk to your capital and you should only trade with money you can afford to lose. Trading Forex and CFDs may not be suitable for all investors, so please ensure that you fully understand the risks involved and seek independent advice if necessary.
Disclaimer:
The above opinions given constitute general market commentary, and do not constitute the opinion or advice of IC Markets or any form of personal or investment advice.
Any opinions, news, research, analyses, prices, other information, or links to third-party sites contained on this website are provided on an "as-is" basis, are intended only to be informative, is not an advice nor a recommendation, nor research, or a record of our trading prices, or an offer of, or solicitation for a transaction in any financial instrument and thus should not be treated as such. The information provided does not involve any specific investment objectives, financial situation and needs of any specific person who may receive it. Please be aware, that past performance is not a reliable indicator of future performance and/or results. Past Performance or Forward-looking scenarios based upon the reasonable beliefs of the third-party provider are not a guarantee of future performance. Actual results may differ materially from those anticipated in forward-looking or past performance statements. IC Markets makes no representation or warranty and assumes no liability as to the accuracy or completeness of the information provided, nor any loss arising from any investment based on a recommendation, forecast or any information supplied by any third-party.

Day 1 of turning £20 to £1million in 1 yearThis is day one of the challenge turning 20gbp to 1 million GBP within 1 year.
Expressed thoughts on some fundamentals going on right now and the approach for this week. This was posted 15 minutes before market open on a Sunday. Let the fun commence.
Ideally trying to complete this before 11th May 2026 hitting 1 million by then.

Bullish rise?USD/CHF has bounced off the support level which is a pullback support that lines up with the 38.2% Fibonacci retracement and could rise from this level to our take profit.
Entry: 0.8278
Why we like it:
There is a pullback support level that lines up with the 38.2% Fibonacci retracement.
Stop loss: 0.8244
Why we like it:
There is a pullback support that aligns with the 61.8% Fibonacci retracement.
Take profit: 0.8366
Why we like it:
There is a pullback resistance that lines up with the 61.8% Fibonacci projection.
Enjoying your TradingView experience? Review us!
Please be advised that the information presented on TradingView is provided to Vantage (‘Vantage Global Limited’, ‘we’) by a third-party provider (‘Everest Fortune Group’). Please be reminded that you are solely responsible for the trading decisions on your account. There is a very high degree of risk involved in trading. Any information and/or content is intended entirely for research, educational and informational purposes only and does not constitute investment or consultation advice or investment strategy. The information is not tailored to the investment needs of any specific person and therefore does not involve a consideration of any of the investment objectives, financial situation or needs of any viewer that may receive it. Kindly also note that past performance is not a reliable indicator of future results. Actual results may differ materially from those anticipated in forward-looking or past performance statements. We assume no liability as to the accuracy or completeness of any of the information and/or content provided herein and the Company cannot be held responsible for any omission, mistake nor for any loss or damage including without limitation to any loss of profit which may arise from reliance on any information supplied by Everest Fortune Group.

USDCHF RANGEPrice is overall bearish. Price has been in a range for a few weeks so one could either look for trades near support/resistance or wait for price to break support/resistance.

Swiss Franc / USD Double BottomTargets = 1.289 then 1.338
Wick already reached and breached halfway point to TP 1, re-test of support and neckline in progress now. Hold and/or a pullback and reclaim of 1.889 to head up towards targets.
Good luck!


USDCHF Confirmed bottom Buy SignalLast time we looked at the USDCHF pair was three months ago (February 05 2025, see chart below) and it gave us the best sell signal possible, easily hitting our 0.8400 Target:
This time the long-term price action has transitioned into a Megaphone pattern, whose bottom was reached on the April 21 Low. At the same time the 1D RSI hit the 18.90 Support, which has been the Ultimate Buy Signal for the August 05 2024 and December 28 2023 Lows.
Since the price has been rebounding since, we view this as a confirmed buy signal and the start of the Megaphone's new Bullish Leg. The previous two rose by +10% and +10.67% respectively so a mere repeat of the +10% rally, will hit at least 0.88000.
-------------------------------------------------------------------------------
** Please LIKE 👍, FOLLOW ✅, SHARE 🙌 and COMMENT ✍ if you enjoy this idea! Also share your ideas and charts in the comments section below! This is best way to keep it relevant, support us, keep the content here free and allow the idea to reach as many people as possible. **
-------------------------------------------------------------------------------
Disclosure: I am part of Trade Nation's Influencer program and receive a monthly fee for using their TradingView charts in my analysis.
💸💸💸💸💸💸
👇 👇 👇 👇 👇 👇

USDCHF: Will Start Falling! Here is Why:
The price of USDCHF will most likely collapse soon enough, due to the supply beginning to exceed demand which we can see by looking at the chart of the pair.
Disclosure: I am part of Trade Nation's Influencer program and receive a monthly fee for using their TradingView charts in my analysis.
❤️ Please, support our work with like & comment! ❤️

USD/CHF🔹Symbol: USD/CHF
🔹Price: 0.83021
🔹Stop loss: 0.83291
🔹Take profit 1: 0.82686
🔹Take profit 2: 0.82393
🔹Take profit 3: 0.82070
Low risk: % 1.5🟢
📊Check your chart before entering.

USD/CHF For Bearish as pull-backyou can go short now
general trend is up trend
current phase is pull-back may be until target 2
have fun :)

USD/CHF Sideways Phase Could Break on Trade Sentiment Shift USD/CHF Weekly Setup – Sideways Phase Could Break on Trade Sentiment Shift
USD/CHF is currently consolidating in a tight range near 0.8300, but under the surface, big moves are brewing.
Last week, the pair pulled back as US bond yields dipped lower and the USD weakened. However, this isn’t just about technicals — the bigger story is coming from trade negotiations, central bank signals, and global inflation pressures.
🌍 What’s Driving the Market?
1️⃣ US-China Trade Talks Return to Spotlight
Early signs of progress in global trade relations helped stabilize market sentiment. President Trump confirmed a preliminary trade agreement with the UK and hinted at cautious talks with China this weekend in Switzerland. While no breakthroughs are expected, any surprise deal or tariff easing could lift the USD.
2️⃣ SNB Dovish Tilt Pressures CHF
SNB Chairman Schlegel has opened the door for more rate cuts if the Swiss economy continues to show weakness. April CPI came in flat, and core inflation dropped, adding to the dovish case.
3️⃣ Fed Uncertainty
While the Fed held rates steady, markets are still debating the next move. The bond market suggests rate cuts are now less likely in the short-term, which could offer near-term support to the USD.
📊 Technical Picture – H4 Outlook
Price is forming a sideways accumulation just under the 0.8310 level. A deeper FVG (Fair Value Gap) still exists overhead from the recent drop. If USD strength returns, a clean break toward this imbalance zone is likely.
We're also seeing lower shadows and absorption wicks near support zones, signaling buyers are active at the bottom of this range.
📌 Key Levels
BUY ZONE:
→ 0.8265 – 0.8245
SL: 0.8200
TP targets:
→ 0.8325
→ 0.8365
→ 0.8425
→ 0.8585
🧠 Strategy Notes
This setup is range-to-breakout biased.
If the market responds positively to US-China trade headlines or US bond yields recover, USD/CHF could launch higher into the imbalance zone.
Watch for a confirmed H4 breakout candle above 0.8320 for added confidence.
Keep in mind the SNB meeting on June 19th — markets may start pricing in policy shifts earlier than expected.
📣 Final Thoughts
USD/CHF is at a turning point — and what happens next will depend less on indicators and more on trade diplomacy and central bank tones. As always, let the market show its hand.
✅ Wait for price to come to your zone.
⛔ Don’t chase moves in this volatility.
🔔 Stay alert to any headlines from the US, China, or SNB this week.
