USD/CHF H1 | Rising into a pullback resistanceUSD/CHF is rising towards a pullback resistance and could potentially reverse off this level to drop lower.
Sell entry is at 0.8269 which is a pullback resistance that aligns close to the 50.0% Fibonacci retracement.
Stop loss is at 0.8345 which is a level that sits above a multi-swing-high resistance.
Take profit is at 0.8194 which is a swing-low support.
High Risk Investment Warning
Trading Forex/CFDs on margin carries a high level of risk and may not be suitable for all investors. Leverage can work against you.
Stratos Markets Limited (tradu.com):
CFDs are complex instruments and come with a high risk of losing money rapidly due to leverage. 63% of retail investor accounts lose money when trading CFDs with this provider. You should consider whether you understand how CFDs work and whether you can afford to take the high risk of losing your money.
Stratos Europe Ltd (tradu.com):
CFDs are complex instruments and come with a high risk of losing money rapidly due to leverage. 63% of retail investor accounts lose money when trading CFDs with this provider. You should consider whether you understand how CFDs work and whether you can afford to take the high risk of losing your money.
Stratos Global LLC (tradu.com):
Losses can exceed deposits.
Please be advised that the information presented on TradingView is provided to Tradu (‘Company’, ‘we’) by a third-party provider (‘TFA Global Pte Ltd’). Please be reminded that you are solely responsible for the trading decisions on your account. There is a very high degree of risk involved in trading. Any information and/or content is intended entirely for research, educational and informational purposes only and does not constitute investment or consultation advice or investment strategy. The information is not tailored to the investment needs of any specific person and therefore does not involve a consideration of any of the investment objectives, financial situation or needs of any viewer that may receive it. Kindly also note that past performance is not a reliable indicator of future results. Actual results may differ materially from those anticipated in forward-looking or past performance statements. We assume no liability as to the accuracy or completeness of any of the information and/or content provided herein and the Company cannot be held responsible for any omission, mistake nor for any loss or damage including without limitation to any loss of profit which may arise from reliance on any information supplied by TFA Global Pte Ltd.
The speaker(s) is neither an employee, agent nor representative of Tradu and is therefore acting independently. The opinions given are their own, constitute general market commentary, and do not constitute the opinion or advice of Tradu or any form of personal or investment advice. Tradu neither endorses nor guarantees offerings of third-party speakers, nor is Tradu responsible for the content, veracity or opinions of third-party speakers, presenters or participants.
USDCHF trade ideas

Bullish bounce?The Swissie (USD/CHF) has bounced off the pivot and could rise to the 1st resistance.
Pivot: 0.8211
1st Support: 0.8114
1st Resistance: 0.8372
Risk Warning:
Trading Forex and CFDs carries a high level of risk to your capital and you should only trade with money you can afford to lose. Trading Forex and CFDs may not be suitable for all investors, so please ensure that you fully understand the risks involved and seek independent advice if necessary.
Disclaimer:
The above opinions given constitute general market commentary, and do not constitute the opinion or advice of IC Markets or any form of personal or investment advice.
Any opinions, news, research, analyses, prices, other information, or links to third-party sites contained on this website are provided on an "as-is" basis, are intended only to be informative, is not an advice nor a recommendation, nor research, or a record of our trading prices, or an offer of, or solicitation for a transaction in any financial instrument and thus should not be treated as such. The information provided does not involve any specific investment objectives, financial situation and needs of any specific person who may receive it. Please be aware, that past performance is not a reliable indicator of future performance and/or results. Past Performance or Forward-looking scenarios based upon the reasonable beliefs of the third-party provider are not a guarantee of future performance. Actual results may differ materially from those anticipated in forward-looking or past performance statements. IC Markets makes no representation or warranty and assumes no liability as to the accuracy or completeness of the information provided, nor any loss arising from any investment based on a recommendation, forecast or any information supplied by any third-party.

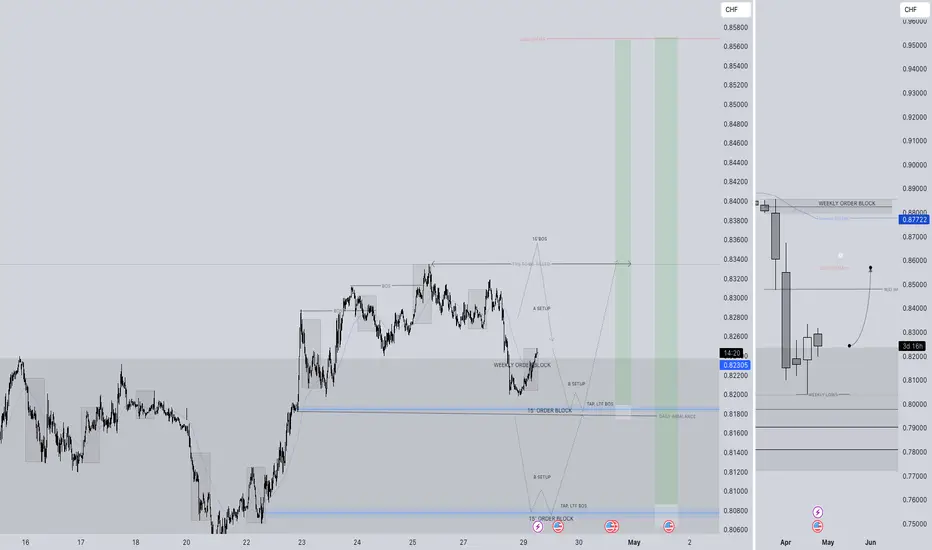
USDCHF LONG FORECAST Q2 W18 D29 Y25USDCHF LONG FORECAST Q2 W18 D29 Y25
Professional Risk Managers👋
Welcome back to another FRGNT chart update📈
Diving into some Forex setups using predominantly higher time frame order blocks alongside confirmation breaks of structure.
Let’s see what price action is telling us today!
💡Here are some trade confluences📝
✅Weekly order block rejection
✅Daily order block rejection
✅15’ order block
✅Intraday bullish breaks of structure
🔑 Remember, to participate in trading comes always with a degree of risk, therefore as professional risk managers it remains vital that we stick to our risk management plan as well as our trading strategies.
📈The rest, we leave to the balance of probabilities.
💡Fail to plan. Plan to fail.
🏆It has always been that simple.
❤️Good luck with your trading journey, I shall see you at the very top.
🎯Trade consistent, FRGNT X
USD/CHF Outlook: Bearish Shift ExpectedHello,
FX:USDCHF has experienced further upside, but downside is still expected. CHF maintains a stable monetary policy with a favorable risk stance, though economic data is mixed. Despite this, its safe haven status is influenced by regional factors, with a shift into bearish territory anticipated soon.
No Nonsense. Just Really Good Market Insights. Leave a Boost
TradeWithTheTrend3344

USDCHFUSDCHF
- Extreme POI
- Break of Structure
- Completed " 12345 " Impulsive Waves and " A " Corrective Waves
- Demand Zone
- Rising Wedge as an corrective pattern in Short Time Frame

USDCHF – breakout (down), retest and bearish continuation The area between 0.8410 and 0.8330 has been a solid support but recently, price broke (to the downside). Now, price has been pulling back for a re-test and I believe that next week we may see a bearish continuation. Price will also come closer to the 20ema that I rely on as a guide to the mean.
I will be watching this area on a lower time frame, looking for bearish price action to go short. If bearish price action does resume, we are likely to see the round number 0.8000 be achieved.
This is not a trade recommendation; it’s merely my own analysis. Trading carries a high level of risk, so only trade with money you can afford to lose and carefully manage your capital and risk. If you like my idea, please give a “boost” and follow me to get even more. Please comment and share your thoughts too!!
It’s not whether you are right or wrong, but how much money you make when you are right and how much you lose when you are wrong – George Soros

USDCHF I Intraday Long Opportunity from Support Welcome back! Let me know your thoughts in the comments!
** USDCHF Analysis - Listen to video!
We recommend that you keep this pair on your watchlist and enter when the entry criteria of your strategy is met.
Please support this idea with a LIKE and COMMENT if you find it useful and Click "Follow" on our profile if you'd like these trade ideas delivered straight to your email in the future.
Thanks for your continued support!Welcome back! Let me know your thoughts in the comments!

USDCHF | 15M | Needs to break for uptrendHey there my friend;
I’ve prepared my analysis of USD/CHF for you. For USD/CHF to move into an upward trend, it needs to break out of the parallel channel. Once it breaks out of the parallel channel, I’ll share the target levels with you.
Dear friends, your likes are always my biggest source of motivation for me to share analysis. For this reason, I would like to ask each and every one of my followers; please do not miss your likes.
I sincerely thank everyone who supports me with their likes.

US DOLLAR TO LOOSE THE FIGHT AGAINST THE SWISS FRANC????Good day once again traders on USDCHF we hab=ve a beautiful market structure as you can see the market dipped into our D1 FVG then showed us a bearish market structure shift after breaking the buyside $, combining that with time of day gives us a high propability trade,GOODLUCK!!!

USDCHF possible bullish reversal for 08470 & 0.8530#usdchf weekly bar is a key reversal bar, made a new low, closed towards high. market liquidity sweep below the previous double bottom. weekly key reversal bar is an early indication for bullish reversal. trend is quite bearish. better to wait for correction i.e. 61.8fib level, 70.0fib level and 79.0fib level as well. stop loss below the key reversal bar. Initial take profit level is 0.8470, next one is 0.8525-30.

USD/CHF Trade Setup - Bias: Bearish below 0.8300USD/CHF Trade Setup – April 28
USD/CHF is showing renewed downside pressure, trading around 0.8270 amid increased safe-haven demand for the Swiss Franc. Trade-related uncertainty between the US and China and geopolitical tensions continue to weigh on risk appetite. Technically, the pair remains in a bearish structure, and sellers are pressing below the key 0.8300 psychological level.
With the Fed in blackout ahead of the May 7 FOMC meeting and upcoming US GDP and employment data, volatility could pick up. A break below 0.8250 could open the path toward deeper support at 0.8200. However, if US data surprises to the upside later this week, a recovery back above 0.8300 would invalidate the bearish bias and suggest a retest of 0.8370 resistance.
Bias: Bearish below 0.8300.
Key Levels: Support – 0.8250 / 0.8200 | Resistance – 0.8300 / 0.8370.
Risk Event: US Q1 GDP and NFP releases later this week.
#USDCHF #Forex #TradeSetup #TechnicalAnalysis

USDCHF pulling back after 400 pip drop — watching for sellsSince breaking out of the 0.88349–0.87716 range a few weeks ago, USDCHF 🇺🇸🇨🇭 fell over 400 pips, creating a new swing low at 0.83653 and then a lower low at 0.80862.
Currently, we are seeing a pullback back into the 0.83653 intraday swing point.
👀 This is where I’m watching for rejection to stack into new sells, with additional sells to be added at 0.80862.
🎯 Overall target remains 0.78414 — around 500 pips away.

Bearish reversal off pullback resistance?The Swissie (USD/CHF) is rising towards the pivot and could reverse to the pullback support.
Pivot: 0.8400
1st Support: 0.8089
1st Resistance: 0.8604
Risk Warning:
Trading Forex and CFDs carries a high level of risk to your capital and you should only trade with money you can afford to lose. Trading Forex and CFDs may not be suitable for all investors, so please ensure that you fully understand the risks involved and seek independent advice if necessary.
Disclaimer:
The above opinions given constitute general market commentary, and do not constitute the opinion or advice of IC Markets or any form of personal or investment advice.
Any opinions, news, research, analyses, prices, other information, or links to third-party sites contained on this website are provided on an "as-is" basis, are intended only to be informative, is not an advice nor a recommendation, nor research, or a record of our trading prices, or an offer of, or solicitation for a transaction in any financial instrument and thus should not be treated as such. The information provided does not involve any specific investment objectives, financial situation and needs of any specific person who may receive it. Please be aware, that past performance is not a reliable indicator of future performance and/or results. Past Performance or Forward-looking scenarios based upon the reasonable beliefs of the third-party provider are not a guarantee of future performance. Actual results may differ materially from those anticipated in forward-looking or past performance statements. IC Markets makes no representation or warranty and assumes no liability as to the accuracy or completeness of the information provided, nor any loss arising from any investment based on a recommendation, forecast or any information supplied by any third-party.

[USDCHF] Trade ideaSwing position on this forex pair, I will consider to enter again if my SL is hit once and after looking for a better zone to enter (this one is not optimal).
Great Trade !

Bullish setup in USDCHFBullish Div
Range breakout
Retesting that range after manipulation
BOS with FVG
Wait for the entry at 0.71 fib level, which is range top also

A clear break through a historically strong zone. SHORT There has been a break of a historically significant zone for this market. We know that zones, especially zones that have been tested multiple times, never go away and will always have some sort of impact on market prices when approached. We also have a Triple Top formation where the price has rejected multiple times. We can see the momentum trending downward. With that being said, prices have recovered and we are now looking for shorting opportunities as prices reach this zone where the market recently broke through. The zone once served as support and will now serve as resistance. Also there is a BIG hint in the most recent candle.. do you know what it is?
I am a long term trader.. Weekly to multi month trades. Not a professional, I only do this in my free time. So far posting on here I am 2 for 2 with my analysist. Check out my IDEAS on my profile. 3 for 3 ?
Happy Trading
-BWH

Wajani Investments: USDCHF AnalysisThis pair fell below its previous demand zone if you zoom the chart to the left. This confirms price to be at a demand zone. The second important factor here is seen from the two strong bullish candles insinuating the bulls have entered the market strongly. These two factors qualify for my analysis to say the market is moving upward.
Let me know your thoughts.
Thank you.

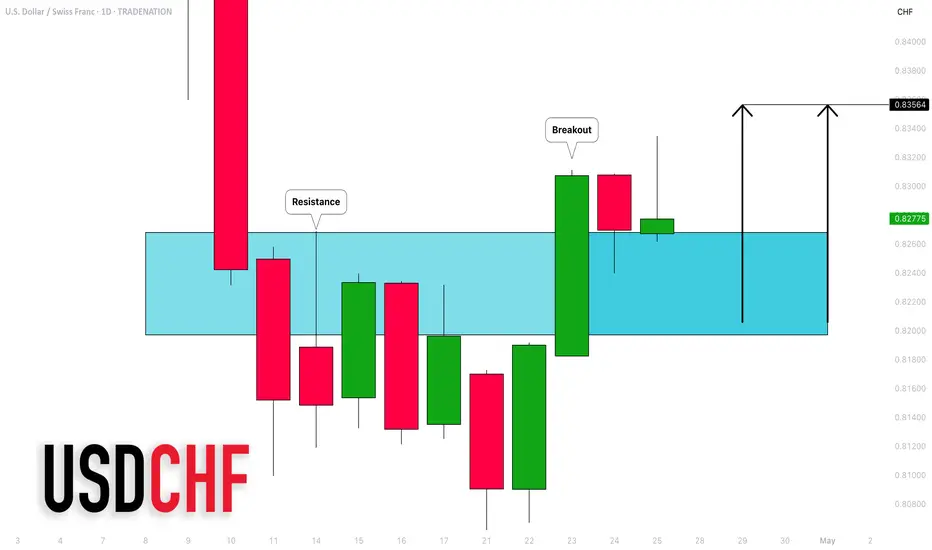
USDCHF: Important Breakout & Bullish Outlook Explained
USDCHF broke and closed above a key daily horizontal resistance area.
The broken structure most likely turned in a strong support.
I expect a bullish continuation from that next week.
Goal - 0.8356
❤️Please, support my work with like, thank you!❤️
I am part of Trade Nation's Influencer program and receive a monthly fee for using their TradingView charts in my analysis.
USD-CHF Correction Ahead! Sell!
Hello,Traders!
USD-CHF is growing but
Will soon hit a horizontal
Resistance of 0.8383
From where we will be
Expecting a local
Bearish pullback
Sell!
Comment and subscribe to help us grow!
Check out other forecasts below too!
Disclosure: I am part of Trade Nation's Influencer program and receive a monthly fee for using their TradingView charts in my analysis.

USDCHF | Resistance LevelOpportunity for Short Trade as price reaches resistance level
Stop Loss and Take profit values on the chart.

USDCHF LONG FORECAST Q2 W17 D25 Y25USDCHF LONG FORECAST Q2 W17 D25 Y25
Professional Risk Managers👋
Welcome back to another FRGNT chart update📈
Diving into some Forex setups using predominantly higher time frame order blocks alongside confirmation breaks of structure.
Let’s see what price action is telling us today!
💡Trade confluences📝
✅Weekly order block rejection
✅Daily order block rejection
✅15’ order block
✅Intraday bearish breaks of structure
🔑 Remember, to participate in trading comes always with a degree of risk, therefore as professional risk managers it remains vital that we stick to our risk management plan as well as our trading strategies.
📈The rest, we leave to the balance of probabilities.
💡Fail to plan. Plan to fail.
🏆It has always been that simple.
❤️Good luck with your trading journey, I shall see you at the very top.
🎯Trade consistent, FRGNT X

USD/CHF BULLISH BIAS RIGHT NOW| LONG
Hello, Friends!
The BB lower band is nearby so USD/CHF is in the oversold territory. Thus, despite the downtrend on the 1W timeframe I think that we will see a bullish reaction from the support line below and a move up towards the target at around 0.814.
Disclosure: I am part of Trade Nation's Influencer program and receive a monthly fee for using their TradingView charts in my analysis.
✅LIKE AND COMMENT MY IDEAS✅

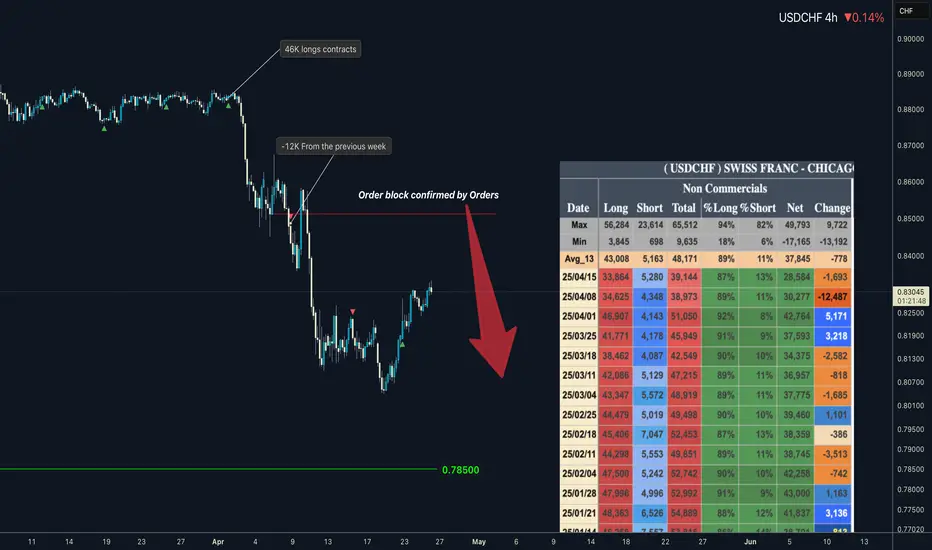
USDCHF COT and Liquidity AnalysisCOT Report Analysis:
We can see large longs closing signaling continuation of the downtrend. So we should be looking only for the short on the runs on to the CLS highs. If you draw long term Chanel lows are at 0.785 where I think price is heading.
/b]
Hey what up traders welcome to the COT data and Liquidity report. This is a big part of my FX Trading. Im always trying to trade with the Big players so knowing their positions is good thing.
Please be aware that institutions report data to the SEC on Tuesdays and data are reported on Fridays - so again we as retail traders have disadvantage, but there is possibility to read between the lines. Remember in the report is what they want you to see, that's why mostly price reverse on Wednesday after the report so their cards are hidden as long as possible. However if the trend is running you can read it and use for your advantage.
I created this simple free indicator which you can find in the my scripts. It's highlighting the day of the real report - Tuesday.
Here is the tip if the level has confluence with the high volume on COT it can be strong support / Resistance.
Analysis done on the Tradenation Charts
Disclosure: I am part of Trade Nation's Influencer program and receive a monthly fee for using their TradingView charts in my analysis.
"Adapt what is useful, reject what is useless, and add what is specifically your own."