USDCHF trade ideas

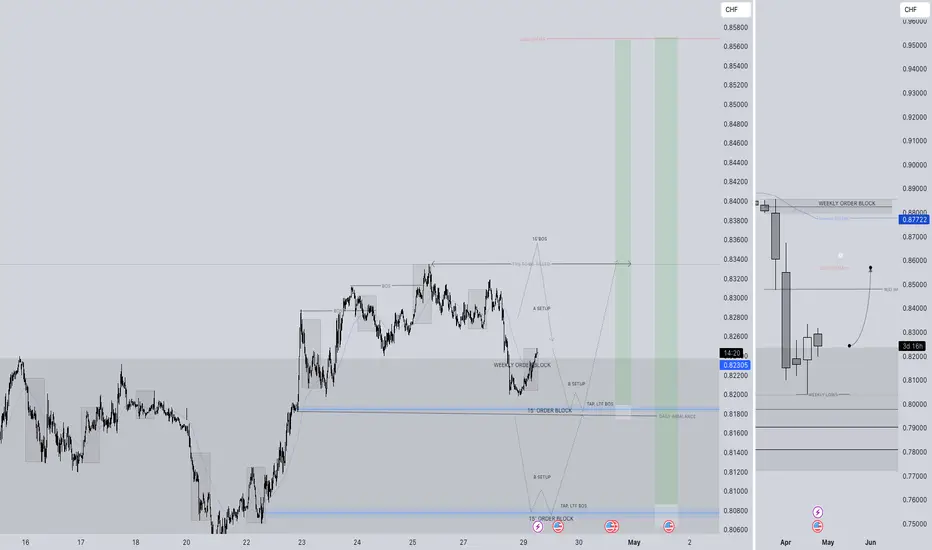
USDCHF LONG FORECAST Q2 W18 D30 Y25USDCHF LONG FORECAST Q2 W18 D30 Y25
Professional Risk Managers👋
Welcome back to another FRGNT chart update📈
Diving into some Forex setups using predominantly higher time frame order blocks alongside confirmation breaks of structure.
Let’s see what price action is telling us today!
💡Here are some trade confluences📝
✅Weekly order block rejection
✅Daily order block rejection
✅15’ order block
✅Intraday bullish breaks of structure
🔑 Remember, to participate in trading comes always with a degree of risk, therefore as professional risk managers it remains vital that we stick to our risk management plan as well as our trading strategies.
📈The rest, we leave to the balance of probabilities.
💡Fail to plan. Plan to fail.
🏆It has always been that simple.
❤️Good luck with your trading journey, I shall see you at the very top.
🎯Trade consistent, FRGNT X

USDCHF short: Sellers Getting Ready to DominateAfter a strong impulse from buyers, we saw exhaustion near the highs. Price retraced to a major support zone, but instead of a strong bounce, we got a tight, controlled accumulation range.
the higher timeframe, i.e 4H is in a strong downmove
What’s interesting is the structure within that box: the breakout attempts are weak, volatility is contracting, and there’s a noticeable lack of bullish follow-through—just coiling.
Smart money doesn’t chase—they trap. This triangle near key support is exactly where larger players hide intentions behind "indecision." But to me, the silence screams. This doesn’t look like preparation for a markup—it feels like a setup for distribution under the disguise of consolidation.
I’m anticipating a sellers' takeover.
Entry Idea: Short on breakdown of triangle structure or on a faker as shown on the chart
Stop: Above false breakout wick
Target: Near 0.80408 (based on prior imbalance + clean levels below)
Risk-reward speaks for itself.
Let’s see if the tape reveals what I believe it’s been hiding in plain sight.

Market Analysis: USD/CHF – 4H ChartThe USD/CHF pair is exhibiting a **clear bearish trend** on the 4-hour chart, with price currently consolidating around the **0.81500** level after a sharp decline. This consolidation is forming a **range-bound structure**, with support near the recent H4 low and resistance around the **0.82500** zone.
Key Observations:
Bearish momentum remains dominant, evidenced by lower highs and lower lows.
Price is currently trading just above a well-tested H4 support level.
There are two probable outcomes from this consolidation zone:
Potential Scenarios:
1. Bullish Breakout:
A rejection from the H4 support could see price push back towards the **0.82500** level.
A breakout beyond this resistance could lead to further recovery towards **0.83500** or higher.
2. **Bearish Continuation**:
A break below the H4 support zone would confirm further downside momentum.
This could lead price towards the next key support around **0.80000**, with potential extension to the **0.78500** region.
Conclusion:
USD/CHF is currently at a decision point within a broader bearish structure. Traders should watch for a breakout from the current range to confirm the next directional move, with **0.82500** and **0.80000** acting as critical inflection zones.

Daily Price Action: USDCHF Tuesday 4/29/2025In this video, we will be looking into the potential price action USDCHF.

Potential bearish drop?USD/CHF has reacted off the resistance level which is a pullback resistance that lines up with the 38.2% Fibonacci retracement and could drop from this level to our take profit.
Entry: 0.8253
Why we like it:
There is a pullback resistance level that lines up with the 38,2% Fibonacci retracement.
Stop loss: 0.8321
Why we like it:
There is a pullback resistance level.
Take profit: 0.8135
Why we like it:
There is a pullback support level that aligns with the 100% Fibonacci projection.
Enjoying your TradingView experience? Review us!
Please be advised that the information presented on TradingView is provided to Vantage (‘Vantage Global Limited’, ‘we’) by a third-party provider (‘Everest Fortune Group’). Please be reminded that you are solely responsible for the trading decisions on your account. There is a very high degree of risk involved in trading. Any information and/or content is intended entirely for research, educational and informational purposes only and does not constitute investment or consultation advice or investment strategy. The information is not tailored to the investment needs of any specific person and therefore does not involve a consideration of any of the investment objectives, financial situation or needs of any viewer that may receive it. Kindly also note that past performance is not a reliable indicator of future results. Actual results may differ materially from those anticipated in forward-looking or past performance statements. We assume no liability as to the accuracy or completeness of any of the information and/or content provided herein and the Company cannot be held responsible for any omission, mistake nor for any loss or damage including without limitation to any loss of profit which may arise from reliance on any information supplied by Everest Fortune Group.


USDCHF seems to continue its bearsih rallythe price made a decent pullback, but now it looks like that trend will be bearish as soon as it breaks the marked support level. The overall trend is bearish, and more importantly, DXY is falling sharply, which suggests that the trend will remain downwards. Other useful information has also been given in the chart with also short position been drawn

[USDCHF] Trade ideaTook a lose on the last long on this asset but now my bias switched from long to full short and the conviction is strong on this levels.
Great Trade !


USD/CHF High-confidence, Trend-Aligned setup. – April 26 2025 1️⃣ Technical Outlook
TF Structure & Momentum Verdict
Weekly (W1) Lower-lows since Jan; bearish OB at 0.8400 caps rallies Bearish
Daily (D1) Clean bearish channel; Friday close < mid-channel Bearish
H4 Consolidation under 0.8335 FVG after liquidity sweep Bearish
Trend-Aligned ✅
2️⃣ Primary Alert Zones (H4)
Zone Price Type Setup Idea
0.8335 – 0.8350 Bearish OB + FVG Break-&-retest short
0.8260 – 0.8250 Weekly swing low TP1 / possible bounce
0.8200 – 0.8180 Liquidity pocket TP2 / extended target
3️⃣ Indicator Snapshot
RSI (H4): 38 → momentum still weak
MACD (D1): below 0, widening histo → bearish pressure
ATR (1 h): ≈ 10 pips (14-period)
Tick Vol (trigger-candle rule): need > 20 % above avg
4️⃣ Fundamental & Sentiment Radar
USD side: Dollar Index 99.25, stabilising after 4-wk slide
Investing.com
CHF side: SNB jawboning risk – talk of curbing CHF strength
Investing.com
Next Red-Flag Events:
FOMC (May 6-7) – full blackout starts Apr 26 00:00 (today)
Home
US ISM Mfg (May 1)
Swiss CPI (May 2)
Net positioning: CFTC shows record CHF longs vs USD → crowded trade (contrarian squeeze risk).
Risk Mood: Equities firm; CHF retains safe-haven bid if risk fades.
5️⃣ Trade Considerations (BEES v2)
Entry Trigger: M15 bearish engulf at 0.8335 OB + volume > 20 %
Rejection Filters: No trade if price < 0.8300 without retest (chase risk)
No-Trade Zone: ±50 pips around 0.8400 HTF resistance unless clean breakout
6️⃣ Risk Management
ATR-based SL: 1.5 × 10 pips ≈ 15 pips
TP Plan:
TP1 0.8260 (≈ 2 R)
TP2 0.8200 (≈ 3 R)
Trail remainder via H1 swing highs
7️⃣ Execution Checklist ✅/❌
HTF trend aligned
Volume surge > 20 % required
Outside 6 h of red-flag release (entry after NY open Mon)
Confidence ≥ High
Price not in No-Trade Zone
8️⃣ Pre-Trade Grading (0–2 each)
Criterion Score
Trend Alignment 2
Confluence Strength 2
Price Behaviour 2
Risk : Reward Quality 2
Event Risk Filtered 1
Total 9 / 10 → Trade Valid
🗺️ Time-Based Volatility Map
Session Expectation
Asia (Sun 17:00-00:00 EST) Likely gap fill, low vol
London (03:00-06:00 EST) Highest probability retest zone
NY (08:00-11:00 EST) USD data spikes; monitor spreads
🧩 Correlation Radar
EUR/CHF also heavy – confirms CHF strength
DXY soft; correlated pairs (USD/CAD, USD/JPY) biased lower

AUD/USD 1h chart after the chanell break we can absolutely look for sell setup because the market is in already in supply area.

USDCHF SELLDisclaimer:
Trading involves risk. These signals are for informational purposes only and do not constitute financial advice. Past performance is not indicative of future results. Use at your own risk. Always trade responsibly.

USD/CHF H1 | Rising into a pullback resistanceUSD/CHF is rising towards a pullback resistance and could potentially reverse off this level to drop lower.
Sell entry is at 0.8269 which is a pullback resistance that aligns close to the 50.0% Fibonacci retracement.
Stop loss is at 0.8345 which is a level that sits above a multi-swing-high resistance.
Take profit is at 0.8194 which is a swing-low support.
High Risk Investment Warning
Trading Forex/CFDs on margin carries a high level of risk and may not be suitable for all investors. Leverage can work against you.
Stratos Markets Limited (tradu.com):
CFDs are complex instruments and come with a high risk of losing money rapidly due to leverage. 63% of retail investor accounts lose money when trading CFDs with this provider. You should consider whether you understand how CFDs work and whether you can afford to take the high risk of losing your money.
Stratos Europe Ltd (tradu.com):
CFDs are complex instruments and come with a high risk of losing money rapidly due to leverage. 63% of retail investor accounts lose money when trading CFDs with this provider. You should consider whether you understand how CFDs work and whether you can afford to take the high risk of losing your money.
Stratos Global LLC (tradu.com):
Losses can exceed deposits.
Please be advised that the information presented on TradingView is provided to Tradu (‘Company’, ‘we’) by a third-party provider (‘TFA Global Pte Ltd’). Please be reminded that you are solely responsible for the trading decisions on your account. There is a very high degree of risk involved in trading. Any information and/or content is intended entirely for research, educational and informational purposes only and does not constitute investment or consultation advice or investment strategy. The information is not tailored to the investment needs of any specific person and therefore does not involve a consideration of any of the investment objectives, financial situation or needs of any viewer that may receive it. Kindly also note that past performance is not a reliable indicator of future results. Actual results may differ materially from those anticipated in forward-looking or past performance statements. We assume no liability as to the accuracy or completeness of any of the information and/or content provided herein and the Company cannot be held responsible for any omission, mistake nor for any loss or damage including without limitation to any loss of profit which may arise from reliance on any information supplied by TFA Global Pte Ltd.
The speaker(s) is neither an employee, agent nor representative of Tradu and is therefore acting independently. The opinions given are their own, constitute general market commentary, and do not constitute the opinion or advice of Tradu or any form of personal or investment advice. Tradu neither endorses nor guarantees offerings of third-party speakers, nor is Tradu responsible for the content, veracity or opinions of third-party speakers, presenters or participants.

Bullish bounce?The Swissie (USD/CHF) has bounced off the pivot and could rise to the 1st resistance.
Pivot: 0.8211
1st Support: 0.8114
1st Resistance: 0.8372
Risk Warning:
Trading Forex and CFDs carries a high level of risk to your capital and you should only trade with money you can afford to lose. Trading Forex and CFDs may not be suitable for all investors, so please ensure that you fully understand the risks involved and seek independent advice if necessary.
Disclaimer:
The above opinions given constitute general market commentary, and do not constitute the opinion or advice of IC Markets or any form of personal or investment advice.
Any opinions, news, research, analyses, prices, other information, or links to third-party sites contained on this website are provided on an "as-is" basis, are intended only to be informative, is not an advice nor a recommendation, nor research, or a record of our trading prices, or an offer of, or solicitation for a transaction in any financial instrument and thus should not be treated as such. The information provided does not involve any specific investment objectives, financial situation and needs of any specific person who may receive it. Please be aware, that past performance is not a reliable indicator of future performance and/or results. Past Performance or Forward-looking scenarios based upon the reasonable beliefs of the third-party provider are not a guarantee of future performance. Actual results may differ materially from those anticipated in forward-looking or past performance statements. IC Markets makes no representation or warranty and assumes no liability as to the accuracy or completeness of the information provided, nor any loss arising from any investment based on a recommendation, forecast or any information supplied by any third-party.

USDCHF LONG FORECAST Q2 W18 D29 Y25USDCHF LONG FORECAST Q2 W18 D29 Y25
Professional Risk Managers👋
Welcome back to another FRGNT chart update📈
Diving into some Forex setups using predominantly higher time frame order blocks alongside confirmation breaks of structure.
Let’s see what price action is telling us today!
💡Here are some trade confluences📝
✅Weekly order block rejection
✅Daily order block rejection
✅15’ order block
✅Intraday bullish breaks of structure
🔑 Remember, to participate in trading comes always with a degree of risk, therefore as professional risk managers it remains vital that we stick to our risk management plan as well as our trading strategies.
📈The rest, we leave to the balance of probabilities.
💡Fail to plan. Plan to fail.
🏆It has always been that simple.
❤️Good luck with your trading journey, I shall see you at the very top.
🎯Trade consistent, FRGNT X
USD/CHF Outlook: Bearish Shift ExpectedHello,
FX:USDCHF has experienced further upside, but downside is still expected. CHF maintains a stable monetary policy with a favorable risk stance, though economic data is mixed. Despite this, its safe haven status is influenced by regional factors, with a shift into bearish territory anticipated soon.
No Nonsense. Just Really Good Market Insights. Leave a Boost
TradeWithTheTrend3344

USDCHFUSDCHF
- Extreme POI
- Break of Structure
- Completed " 12345 " Impulsive Waves and " A " Corrective Waves
- Demand Zone
- Rising Wedge as an corrective pattern in Short Time Frame

USDCHF – breakout (down), retest and bearish continuation The area between 0.8410 and 0.8330 has been a solid support but recently, price broke (to the downside). Now, price has been pulling back for a re-test and I believe that next week we may see a bearish continuation. Price will also come closer to the 20ema that I rely on as a guide to the mean.
I will be watching this area on a lower time frame, looking for bearish price action to go short. If bearish price action does resume, we are likely to see the round number 0.8000 be achieved.
This is not a trade recommendation; it’s merely my own analysis. Trading carries a high level of risk, so only trade with money you can afford to lose and carefully manage your capital and risk. If you like my idea, please give a “boost” and follow me to get even more. Please comment and share your thoughts too!!
It’s not whether you are right or wrong, but how much money you make when you are right and how much you lose when you are wrong – George Soros

USDCHF I Intraday Long Opportunity from Support Welcome back! Let me know your thoughts in the comments!
** USDCHF Analysis - Listen to video!
We recommend that you keep this pair on your watchlist and enter when the entry criteria of your strategy is met.
Please support this idea with a LIKE and COMMENT if you find it useful and Click "Follow" on our profile if you'd like these trade ideas delivered straight to your email in the future.
Thanks for your continued support!Welcome back! Let me know your thoughts in the comments!

USDCHF | 15M | Needs to break for uptrendHey there my friend;
I’ve prepared my analysis of USD/CHF for you. For USD/CHF to move into an upward trend, it needs to break out of the parallel channel. Once it breaks out of the parallel channel, I’ll share the target levels with you.
Dear friends, your likes are always my biggest source of motivation for me to share analysis. For this reason, I would like to ask each and every one of my followers; please do not miss your likes.
I sincerely thank everyone who supports me with their likes.

US DOLLAR TO LOOSE THE FIGHT AGAINST THE SWISS FRANC????Good day once again traders on USDCHF we hab=ve a beautiful market structure as you can see the market dipped into our D1 FVG then showed us a bearish market structure shift after breaking the buyside $, combining that with time of day gives us a high propability trade,GOODLUCK!!!

USDCHF possible bullish reversal for 08470 & 0.8530#usdchf weekly bar is a key reversal bar, made a new low, closed towards high. market liquidity sweep below the previous double bottom. weekly key reversal bar is an early indication for bullish reversal. trend is quite bearish. better to wait for correction i.e. 61.8fib level, 70.0fib level and 79.0fib level as well. stop loss below the key reversal bar. Initial take profit level is 0.8470, next one is 0.8525-30.
