HIGH RISK TRADE USDCHF I have been looking a this one since NFP and think its ready to move up, lets see if i managed to pick out a good position here
USDCHF trade ideas

USD/CHF H1 | Heading into a multi-swing-high resistanceUSD/CHF is rising towards a multi-swing-high resistance and could potentially reverse off this level to drop lower.
Sell entry is at 0.8617 which is a multi-swing-high resistance that aligns close to the 78.6% Fibonacci retracement.
Stop loss is at 0.8685 which is a level that sits above a swing-high resistance.
Take profit is at 0.8480 which is a pullback support.
High Risk Investment Warning
Trading Forex/CFDs on margin carries a high level of risk and may not be suitable for all investors. Leverage can work against you.
Stratos Markets Limited (tradu.com):
CFDs are complex instruments and come with a high risk of losing money rapidly due to leverage. 63% of retail investor accounts lose money when trading CFDs with this provider. You should consider whether you understand how CFDs work and whether you can afford to take the high risk of losing your money.
Stratos Europe Ltd (tradu.com):
CFDs are complex instruments and come with a high risk of losing money rapidly due to leverage. 63% of retail investor accounts lose money when trading CFDs with this provider. You should consider whether you understand how CFDs work and whether you can afford to take the high risk of losing your money.
Stratos Global LLC (tradu.com):
Losses can exceed deposits.
Please be advised that the information presented on TradingView is provided to Tradu (‘Company’, ‘we’) by a third-party provider (‘TFA Global Pte Ltd’). Please be reminded that you are solely responsible for the trading decisions on your account. There is a very high degree of risk involved in trading. Any information and/or content is intended entirely for research, educational and informational purposes only and does not constitute investment or consultation advice or investment strategy. The information is not tailored to the investment needs of any specific person and therefore does not involve a consideration of any of the investment objectives, financial situation or needs of any viewer that may receive it. Kindly also note that past performance is not a reliable indicator of future results. Actual results may differ materially from those anticipated in forward-looking or past performance statements. We assume no liability as to the accuracy or completeness of any of the information and/or content provided herein and the Company cannot be held responsible for any omission, mistake nor for any loss or damage including without limitation to any loss of profit which may arise from reliance on any information supplied by TFA Global Pte Ltd.
The speaker(s) is neither an employee, agent nor representative of Tradu and is therefore acting independently. The opinions given are their own, constitute general market commentary, and do not constitute the opinion or advice of Tradu or any form of personal or investment advice. Tradu neither endorses nor guarantees offerings of third-party speakers, nor is Tradu responsible for the content, veracity or opinions of third-party speakers, presenters or participants.

USD/CHF counter LongsIs still technically bearish territory from Daily perspective. But seeing sweep of lows from left with reaction upside. Could be early sign. But even still having bearish trend in mind, still need some pullback. And i see smth is cooking right now.
To get involved, like to see Asian Lows to be taken...

USDCHFUSDCHF is still in a downtrend. The price has a chance to test the support zone 0.84712-0.84064. If the price cannot break through the 0.84064 level, it is expected that the price will have a chance to rebound. Consider buying the red zone.
🔥Trading futures, forex, CFDs and stocks carries a risk of loss.
Please consider carefully whether such trading is suitable for you.
>>GooD Luck 😊
❤️ Like and subscribe to never miss a new idea!

USDCHF Daily Outlook – Smart Sell Opportunity AheadAfter a clean break and retest of the ascending trendline, USDCHF shows signs of weakness below the key supply zone — perfectly aligned with the 38.2–50% Fibonacci retracement.
🔻 My Bias: Bearish
I'm watching for a short-term pullback into the red zone (possible liquidity grab), followed by a strong continuation toward the next demand area.
💡 Why this setup matters: ✔️ Trendline break & retest
✔️ Strong bearish momentum
✔️ Fibonacci confluence
✔️ Supply zone reaction
🧠 Patience = Profits. Entry should be planned with precision.

USDCHF's 4H Bullish Structure Break – Is It Time to Buy?After a bearish phase, the USDCHF has turned its momentum around following Trump's announcement of a 90-day tariff pause. This news injected fresh optimism into the markets, triggering a rally that overturned previous downtrends. On the four-hour chart, we observe a break of structure that hints at a bullish reversal. The ideal entry point appears to be the pullback to the 50% Fibonacci retracement level—a historically reliable support zone—setting up a clean long opportunity. Current market sentiment, bolstered by easing geopolitical tensions and renewed risk appetite, supports this bullish outlook. As always, use appropriate risk management strategies and treat this analysis as a trade idea rather than financial advice. 🚀📈💹

Bearish reversal off pullback resistance?USD/CHF is rising towards the resistance level which is a pullback resistance that is slightly above the 50% Fibonacci retracement and could reverse from this level to our take profit.
Entry: 0.8617
Why we like it:
There is a pullback resistance that is slightly above the 50% Fibonacci retracement.
Stop loss: 0.8673
Why we like it:
There is a pullback resistance level that is slightly above the 61.8% Fibonacci retracement.
Take profit: 0.8478
Why we like it:
There is a pullback support level.
Enjoying your TradingView experience? Review us!
Please be advised that the information presented on TradingView is provided to Vantage (‘Vantage Global Limited’, ‘we’) by a third-party provider (‘Everest Fortune Group’). Please be reminded that you are solely responsible for the trading decisions on your account. There is a very high degree of risk involved in trading. Any information and/or content is intended entirely for research, educational and informational purposes only and does not constitute investment or consultation advice or investment strategy. The information is not tailored to the investment needs of any specific person and therefore does not involve a consideration of any of the investment objectives, financial situation or needs of any viewer that may receive it. Kindly also note that past performance is not a reliable indicator of future results. Actual results may differ materially from those anticipated in forward-looking or past performance statements. We assume no liability as to the accuracy or completeness of any of the information and/or content provided herein and the Company cannot be held responsible for any omission, mistake nor for any loss or damage including without limitation to any loss of profit which may arise from reliance on any information supplied by Everest Fortune Group.

USDCHF will be in the Bullish directionHello Traders
In This Chart USDCHF HOURLY Forex Forecast By FOREX PLANET
today USDCHF analysis 👆
🟢This Chart includes_ (USDCHF market update)
🟢What is The Next Opportunity on USDCHF Market
🟢how to Enter to the Valid Entry With Assurance Profit
This CHART is For Trader's that Want to Improve Their Technical Analysis Skills and Their Trading By Understanding How To Analyze The Market Using Multiple Timeframes and Understanding The Bigger Picture on the Chart

Possible Bearish Market on USDCHFUSDCHF has been moving between support and resistance levels thereby creating a sideways movement on daily and weekly timeframes, also creating some flag patterns, currently, there is a potential sells on weekly and daily timeframes,
we might see a little movement up to the resistance zone at 92081, creating a triple top pattern before starting the downward movement again.
let's watch out for the market this week.
like and share your opinion

USDCHF where will it go weekly chart for USDCHF with critical point of contact highlighted. where will it go and will it respect the key level

USDCHF bearish continuation below 0.8540Market Sentiment:
The prevailing trend for USDCHF remains bearish, with the recent price action appearing to be an oversold bounce rather than a sustained recovery.
Key Levels:
Resistance: 0.8540 (Previous consolidation zone)
Support Levels: 0.8335 followed by 0.8265 and 0.8200
Potential Scenarios:
Bearish Continuation: If USDCHF fails to break above0.8540 and faces rejection, it could resume its downtrend, targeting 0.8335 initially, followed by 0.8265 and 0.8200 over the longer term.
Bullish Breakout: A confirmed breakout and daily close above 0.8535 would shift the sentiment bullish, paving the way for a rally toward 0.8600 and potentially 0.8650
Conclusion:
USDCHF remains in a bearish structure unless a breakout above 0.8535 is confirmed. Until then, price action suggests that any rally is likely to be a short-term relief within a broader downtrend.
This communication is for informational purposes only and should not be viewed as any form of recommendation as to a particular course of action or as investment advice. It is not intended as an offer or solicitation for the purchase or sale of any financial instrument or as an official confirmation of any transaction. Opinions, estimates and assumptions expressed herein are made as of the date of this communication and are subject to change without notice. This communication has been prepared based upon information, including market prices, data and other information, believed to be reliable; however, Trade Nation does not warrant its completeness or accuracy. All market prices and market data contained in or attached to this communication are indicative and subject to change without notice.

USD/CHF For Bearishwait for pull-back near entry point and then go short
general trend is down trend
have fun :)

USDCHF and back down to the zone around 0.84000USDCHF continues its bearish trend since mid-January and all indications are that we will see a return back down to the zone around 0.84000. The pair failed to break above the EMA 200 weekly moving average, which further increased the pressure on the dollar.


USDCHFRSI indicates Bullish Divergence. Which means that at any time the market trend can change to HH and HL.

Buy usdchfStrong buy expected now
Weekly already too oversold pair
Here we r expecting strong bullish correction

Buy usdchf Our sell idea hited our both target
Now we looking for buy because already too over sold on weekly time frame
Here bullish correction expected

USDCHF: Forecast & Trading Plan
The analysis of the USDCHF chart clearly shows us that the pair is finally about to go up due to the rising pressure from the buyers.
Disclosure: I am part of Trade Nation's Influencer program and receive a monthly fee for using their TradingView charts in my analysis.
❤️ Please, support our work with like & comment! ❤️

USD/CHF Bearish Trade Setup – Supply Zone Rejection🔹 CHoCH (Change of Character) – 📉 A key shift in market structure indicating bearish momentum.
🔹 SBR + DBD Zone (Support Becomes Resistance & Drop Base Drop) – 🚧 This blue zone is a strong resistance area where sellers are likely to step in.
🔹 Stop Loss (🚨) – Positioned above 0.84742, marking a risk level if price moves against the trade.
🔹 Entry Zone (🔵) – Inside the resistance zone, where price is expected to reject and continue downward.
🔹 Target Zone (🎯) – 0.82553, indicating a potential profit of around 2.01% downward movement (-169.7 pips).
🔹 Bearish Confirmation (🔻) – Price already reacted to the zone, showing rejection.
This chart suggests a short-selling opportunity, expecting the price to drop further after rejecting resistance. 📊🔥

USD/CHF BEARS WILL DOMINATE THE MARKET|SHORT
Hello, Friends!
USD/CHF pair is in the downtrend because previous week’s candle is red, while the price is obviously rising on the 2H timeframe. And after the retest of the resistance line above I believe we will see a move down towards the target below at 0.846 because the pair is overbought due to its proximity to the upper BB band and a bearish correction is likely.
Disclosure: I am part of Trade Nation's Influencer program and receive a monthly fee for using their TradingView charts in my analysis.
✅LIKE AND COMMENT MY IDEAS✅

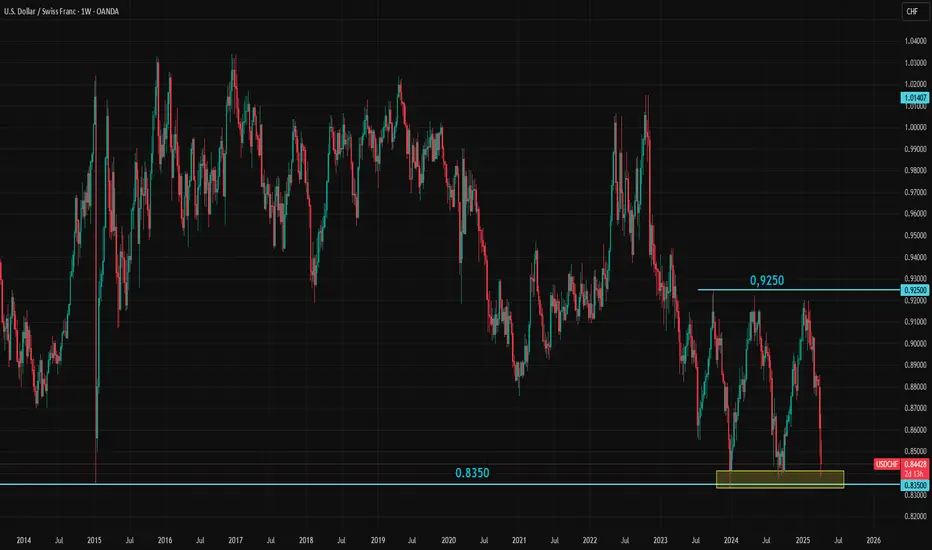
USDCHF Tests 0.8350: Break or Bounce?USDCHF is testing the critical 0.8350 support level amid rising safe haven demand. Yesterday’s chaos in the bond market highlighted how few places investors have to park their money. One of the most widely accepted safe haven assets is the Swiss franc, and current demand for CHF is clearly strong. But is it strong enough?
There hasn't been a weekly close below 0.8350 since 2011, and this level has held firm through several sharp market moves since then. Now, this major support is being tested once again.
Whether it breaks or holds, a significant swing trading opportunity could be on the horizon, especially given the heightened uncertainty surrounding the global trade environment.
USDCHF LONG FORECAST Q2 W15 D9 Y25 USDCHF LONG FORECAST Q2 W15 D9 Y25
Welcome Traders, Here's my take!

UCD/CHFDaily - Bearish
H1 order flow - Bearish
Both HT agrees with bearish narrative. Expect price to pullback into marked supply zones as POI of today.
