USD/CHF H1 | Rising into a swing-high resistanceUSD/CHF is rising towards a swing-high resistance and could potentially reverse off this level to drop lower.
Sell entry is at 0.8575 which is a swing-high resistance.
Stop loss is at 0.8640 which is a level that sits above the 127.2% Fibonacci extension level and a multi-swing-high resistance.
Take profit is at 0.8449 which is a swing-low support.
High Risk Investment Warning
Trading Forex/CFDs on margin carries a high level of risk and may not be suitable for all investors. Leverage can work against you.
Stratos Markets Limited (www.fxcm.com):
CFDs are complex instruments and come with a high risk of losing money rapidly due to leverage. 63% of retail investor accounts lose money when trading CFDs with this provider. You should consider whether you understand how CFDs work and whether you can afford to take the high risk of losing your money.
Stratos Europe Ltd (www.fxcm.com):
CFDs are complex instruments and come with a high risk of losing money rapidly due to leverage. 63% of retail investor accounts lose money when trading CFDs with this provider. You should consider whether you understand how CFDs work and whether you can afford to take the high risk of losing your money.
Stratos Trading Pty. Limited (www.fxcm.com):
Trading FX/CFDs carries significant risks. FXCM AU (AFSL 309763), please read the Financial Services Guide, Product Disclosure Statement, Target Market Determination and Terms of Business at www.fxcm.com
Stratos Global LLC (www.fxcm.com):
Losses can exceed deposits.
Please be advised that the information presented on TradingView is provided to FXCM (‘Company’, ‘we’) by a third-party provider (‘TFA Global Pte Ltd’). Please be reminded that you are solely responsible for the trading decisions on your account. There is a very high degree of risk involved in trading. Any information and/or content is intended entirely for research, educational and informational purposes only and does not constitute investment or consultation advice or investment strategy. The information is not tailored to the investment needs of any specific person and therefore does not involve a consideration of any of the investment objectives, financial situation or needs of any viewer that may receive it. Kindly also note that past performance is not a reliable indicator of future results. Actual results may differ materially from those anticipated in forward-looking or past performance statements. We assume no liability as to the accuracy or completeness of any of the information and/or content provided herein and the Company cannot be held responsible for any omission, mistake nor for any loss or damage including without limitation to any loss of profit which may arise from reliance on any information supplied by TFA Global Pte Ltd.
The speaker(s) is neither an employee, agent nor representative of FXCM and is therefore acting independently. The opinions given are their own, constitute general market commentary, and do not constitute the opinion or advice of FXCM or any form of personal or investment advice. FXCM neither endorses nor guarantees offerings of third-party speakers, nor is FXCM responsible for the content, veracity or opinions of third-party speakers, presenters or participants.
USDCHF trade ideas

USD/CHF: Back at Support – Will Buyers Step In?Welcome back! Let me know your thoughts in the comments!
** USDCHF Analysis !
We recommend that you keep this pair on your watchlist and enter when the entry criteria of your strategy is met.
Please support this idea with a LIKE and COMMENT if you find it useful and Click "Follow" on our profile if you'd like these trade ideas delivered straight to your email in the future.
Thanks for your continued support! Welcome back! Let me know your thoughts in the comments!

USD/CHF Price Action Update – April 5, 2025📊 USD/CHF Price Action Update – April 5, 2025 🎯
🔹 Current Price: 0.85399
🔹 Timeframe: 30M
📌 Key Support Level (Demand Zone):
🟢 0.85110–0.85324 – First Support Zone (Liquidity Area / Demand Rejection Zone)
📌 Key Resistance Level (Target Area):
🔴 0.86177 – Major Resistance (Potential Upside Target)
📈 Bullish Scenario:
Price respected the demand zone between 0.85110–0.85324, showing signs of bullish rejection.
If momentum holds, the next upside target is 0.86177, as shown in the risk-reward setup.
📉 Bearish Scenario:
A break and close below 0.85110 would invalidate the demand zone.
Downside continuation could push price toward 0.84700 or lower.
⚡ Trading Tip:
✅ Enter long positions only after clear rejection or confirmation candle inside the demand zone.
✅ Monitor price closely as it approaches 0.86177 – partial profits can be taken there.
✅ Set stop loss below 0.85110 to maintain favorable risk-reward.
#USDCHF #ForexTrading #SmartMoneyConcepts #PriceAction #LiquidityZone #TechnicalAnalysis #DemandZone #RiskReward #SmartEntry #ForexSignals #BreakoutStrategy

USD/JPY Price Action Update – April 7, 2025📊 USD/JPY Price Action Update – April 7, 2025 🎯
🔹 Current Price: 147.276
🔹 Timeframe: 15M
📌 Key Support Levels (Demand Zones):
🟢 147.200–147.284 – First Support Zone (Liquidity Area)
📌 Key Resistance Levels (Fair Value Gaps - FVGs & Supply Zones):
🔴 147.647 – First Resistance (FVG)
🔴 149.133 – Major Resistance (Potential Target)
📈 Bullish Scenario:
If price respects the 147.200–147.284 demand zone, we could see a push toward 147.647.
A breakout above 147.647 could indicate further bullish momentum toward 149.133.
📉 Bearish Scenario:
If price fails to hold 147.200, a deeper retracement is likely.
Next downside target could be below 147.000, breaking market structure.
⚡ Trading Tip:
✅ Look for confirmations like bullish candlestick rejections before entering buys.
✅ Monitor reactions at FVG zones for potential reversal trades.
✅ Use proper risk management when trading breakout zones.
#USDJPY #ForexTrading #PriceAction #TechnicalAnalysis #SmartMoney #ForexSignals #JPY #ForexMarket #LiquidityZone #SmartMoneyConcepts #FVG #ScalpSetup #BreakoutStrategy #IntradayForex

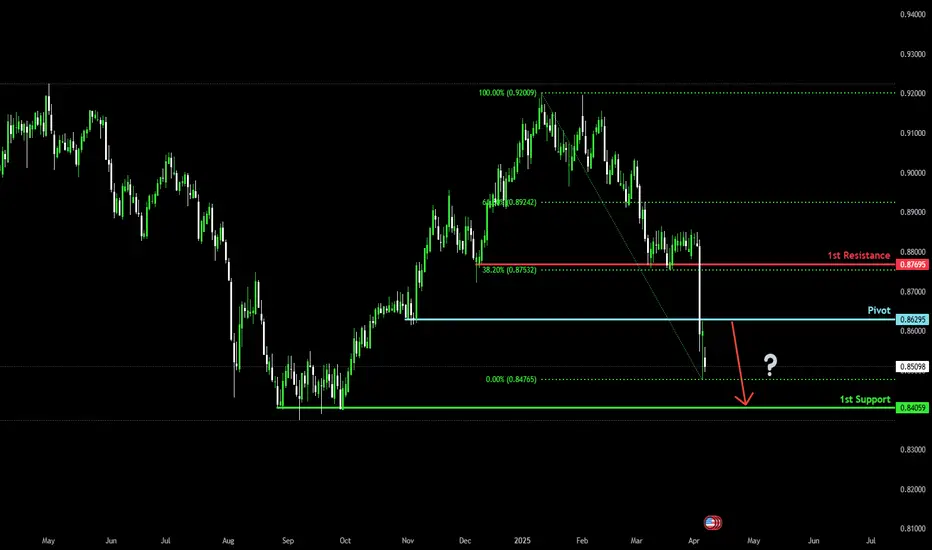
Bearish drop?The Swissie (USD/CHF) has reacted off the pivot which is a pullback resistance and could drop to the 1st support which has been identified as a pullback support.
Pivot: 0.8629
1st Support: 0.8405
1ast Resistance: 0.8769
Risk Warning:
Trading Forex and CFDs carries a high level of risk to your capital and you should only trade with money you can afford to lose. Trading Forex and CFDs may not be suitable for all investors, so please ensure that you fully understand the risks involved and seek independent advice if necessary.
Disclaimer:
The above opinions given constitute general market commentary, and do not constitute the opinion or advice of IC Markets or any form of personal or investment advice.
Any opinions, news, research, analyses, prices, other information, or links to third-party sites contained on this website are provided on an "as-is" basis, are intended only to be informative, is not an advice nor a recommendation, nor research, or a record of our trading prices, or an offer of, or solicitation for a transaction in any financial instrument and thus should not be treated as such. The information provided does not involve any specific investment objectives, financial situation and needs of any specific person who may receive it. Please be aware, that past performance is not a reliable indicator of future performance and/or results. Past Performance or Forward-looking scenarios based upon the reasonable beliefs of the third-party provider are not a guarantee of future performance. Actual results may differ materially from those anticipated in forward-looking or past performance statements. IC Markets makes no representation or warranty and assumes no liability as to the accuracy or completeness of the information provided, nor any loss arising from any investment based on a recommendation, forecast or any information supplied by any third-party.
USDCHF OUTLOOKHappy New Year!
Hope you had a good break during the holiday season. Let's go again this year!
The USD has been extremely bullish in the last few months of 2024 , with current economic climate and market seasonality, I will be expecting a bearish Dollar this year, I will update this idea with time.
Hence, this is my this current outlook on USDCHF.
"May fortune attend thee, and thy trade prosper." .......L2Earned

USDCHF - LongLooking for short term buys into an area of supply (Monthly iFVG) before joining the current daily trend - bearish

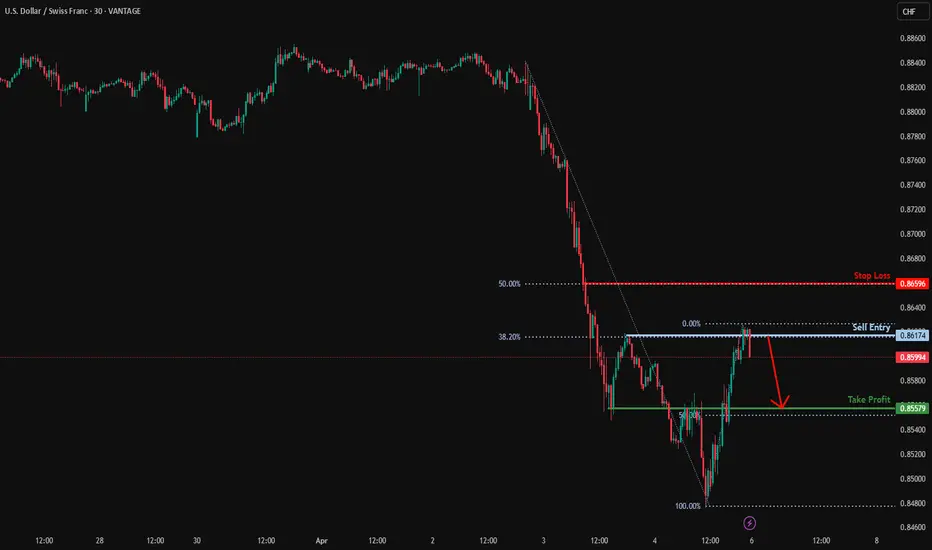
Bearish drop off pullback resistance?USD/CHF is reacting off the resistance level, which is a pullback resistance. A rejection from this level could indicate a double top pattern, potentially leading to a bearish drop.
Entry: 0.8617
Why we like it:
There is a pullback resistance level that line sup with the 38.2% Fibonacci retracement.
Stop loss: 0.8663
Why we like it:
There is a resistance level at the 50% Fibonacci retracement.
Take profit: 0.8557
Why we like it:
There is an overlap support level that line sup with the 50% Fibonacci retracement.
Enjoying your TradingView experience? Review us!
Please be advised that the information presented on TradingView is provided to Vantage (‘Vantage Global Limited’, ‘we’) by a third-party provider (‘Everest Fortune Group’). Please be reminded that you are solely responsible for the trading decisions on your account. There is a very high degree of risk involved in trading. Any information and/or content is intended entirely for research, educational and informational purposes only and does not constitute investment or consultation advice or investment strategy. The information is not tailored to the investment needs of any specific person and therefore does not involve a consideration of any of the investment objectives, financial situation or needs of any viewer that may receive it. Kindly also note that past performance is not a reliable indicator of future results. Actual results may differ materially from those anticipated in forward-looking or past performance statements. We assume no liability as to the accuracy or completeness of any of the information and/or content provided herein and the Company cannot be held responsible for any omission, mistake nor for any loss or damage including without limitation to any loss of profit which may arise from reliance on any information supplied by Everest Fortune Group.

USD/CHF Setup: Trendline Test with Major Upside Potential
USD/CHF is showing signs of bullish pressure as price approaches the key trendline resistance around 0.87000. Currently trading at 0.86075, a breakout above this resistance could open the doors for further upside.
🎯 Upside Targets:
TP1: 0.87700
TP2: 0.89200
🛡️ Key Support Levels:
0.85470
0.84100
A strong break and close above 0.87000 will confirm bullish continuation. Traders should watch closely for momentum and volume confirmation. The bulls are eyeing higher ground

USDCHF - ANALYSIS👀 Observation:
Hello, everyone! I hope you're doing well. I’d like to share my analysis of USD-CHF (Swiss Franc) with you.
Looking at the chart for USD-CHF, we are currently in a weekly price range, and right now, we're at the lower boundary of this range. My expectation for USD-CHF is a small decline towards 0.84760, followed by a potential upward move towards 0.9200.
📉 Expectation:
Bearish Scenario: A small decline towards 0.84760 followed by a bullish move to 0.9200.
💡 Key Levels to Watch:
Support: 0.84760
Resistance: 0.9200
💬 What are your thoughts on USD-CHF this week? Let me know in the comments!
Trade safe

Go LONG USDCHFUSD is rising after Non Farm news.
The market is no longer worried about risks so money is flowing out of safe-haven assets.
I will go Long USDCHF
at 0.86077
Stoploss: 0.84659
TP at 0.88153 (maybe) I never known.

Will USDCHF's price range until USD news day 10th April?Hello traders!
What a week we had last week with the weakening of USD amidst Trump's tariffs news. We saw hours of downslide. Short sellers dream play.
Price has now touched the 1hr upper bollinger band. RSI sitting at 54 and moving upward.
I anticipate price bouncing down and touching the lower band before anything else happening. Will price range all the way to 10th April?
When trading a ranging market, ensure stop loss is placed slightly above the upper band and take profit just above the lower band. In this case, a decent 2.75 RRR can be achieved if my prediction validates.
GL to all. DYOR.

USDCHF, 1H, Long SetupUSDCHF, 1H, Long Setup
Based on RSI and Liberator Divergence on 1 Hr
as well as currency index

Market Review Week Ending 4th April- Part 2Continuing our review of the current market situation, this video goes through our trading plans for our chosen watchlist of shorts (marked red). We review trading plans and validate any shorts potential coming from these pairs chosen.

USDCHF SELLSPrice broke below the weekly resistance to continue its bearish trend. I would like to see price retrace a bit further before continuing to sell towards the weekly support at 0.84000.

USD/CHF Swiss-dollar Forex Bank Heist Plan (Day/Scalping Trade)🌟Hi! Hola! Ola! Bonjour! Hallo! Marhaba!🌟
Dear Money Makers & Robbers, 🤑 💰💸✈️
Based on 🔥Thief Trading style technical and fundamental analysis🔥, here is our master plan to heist the USD/CHF "Swiss-dollar" Forex Bank . Please adhere to the strategy I've outlined in the chart, which emphasizes long entry. Our aim is the high-risk Red Zone. Risky level, overbought market, consolidation, trend reversal, trap at the level where traders and bearish robbers are stronger. 🏆💸"Take profit and treat yourself, traders. You deserve it!💪🏆🎉
Entry 📈 : "The vault is wide open! Swipe the Bullish loot at any price - the heist is on!
however I advise to Place buy limit orders within a 15 or 30 minute timeframe most recent or swing, low or high level.
Stop Loss 🛑:
Thief SL placed at the recent/swing low level Using the 1H timeframe (0.87900) Day / scalping trade basis.
SL is based on your risk of the trade, lot size and how many multiple orders you have to take.
🏴☠️Target 🎯: 0.89150 (or) Escape Before the Target
🧲Scalpers, take note 👀 : only scalp on the Long side. If you have a lot of money, you can go straight away; if not, you can join swing traders and carry out the robbery plan. Use trailing SL to safeguard your money 💰.
USD/CHF "Swiss-dollar" Forex Bank Heist Plan (Day/Scalping Trade) is currently experiencing a bullishness,., driven by several key factors.
📰🗞️Get & Read the Fundamental, Macro, COT Report, Quantitative Analysis, Sentimental Outlook, Intermarket Analysis, Future trend targets.. go ahead to check 👉👉👉🔗
⚠️Trading Alert : News Releases and Position Management 📰 🗞️ 🚫🚏
As a reminder, news releases can have a significant impact on market prices and volatility. To minimize potential losses and protect your running positions,
we recommend the following:
Avoid taking new trades during news releases
Use trailing stop-loss orders to protect your running positions and lock in profits
💖Supporting our robbery plan 💥Hit the Boost Button💥 will enable us to effortlessly make and steal money 💰💵. Boost the strength of our robbery team. Every day in this market make money with ease by using the Thief Trading Style.🏆💪🤝❤️🎉🚀
I'll see you soon with another heist plan, so stay tuned 🤑🐱👤🤗🤩

USD/CHF Weekly AnalysisPresident Trumps recent tariff announcements have shook the market with some huge moves and a USD sell off.
The weekly USD/CHF chart shows the huge bearish sentiment of the Dollar market last week.
We may see some pullback/correction now in the market, with a potential for price to then continue down to 0.8400 which has proved to be a strong demand zone.
This is an idea of what may happen. You should always trade with a well tested and profitable trading strategy using good risk management.

Pending BuyUSDCHF has pushed down to this area before and rejected perfectly so I'm expecting it to do the same once price reach entry

CHFUSD, 1Hr, Short Setup on Breakout (Lowers side)CHFUSD, 1Hr, Short Setup on Breakout (Lowers side)
USD Index CHOH occured
Waiting for confirmation of CHOH on this pair for entry
BEARISH DIVERGENCE PRINTED

POTENTIAL SHORT TRADE SET UP FOR USDCHFAnalysis: Utilizing chart patterns, highs & lows, and impulses & corrections, the focus is on identifying a continuation corrective structure following a breakout.
Entry: The price has reached the upper boundary of a higher time frame (HTF) bearish continuation structure, approaching this zone with an ascending channel on the mid time frame (MTF). On the lower time frame (LTF), a bearish impulse has developed, and we will be watching for a continuation pattern to pinpoint a potential entry point for the trade.
Expectation: A downward move is anticipated, targeting the lower boundary of the HTF bearish continuation structure.
⚠️ Reminder: Always conduct your own analysis and apply proper risk management, as forex trading involves no guarantees. This is a high-risk activity, and past performance is not indicative of future results. Trade responsibly!

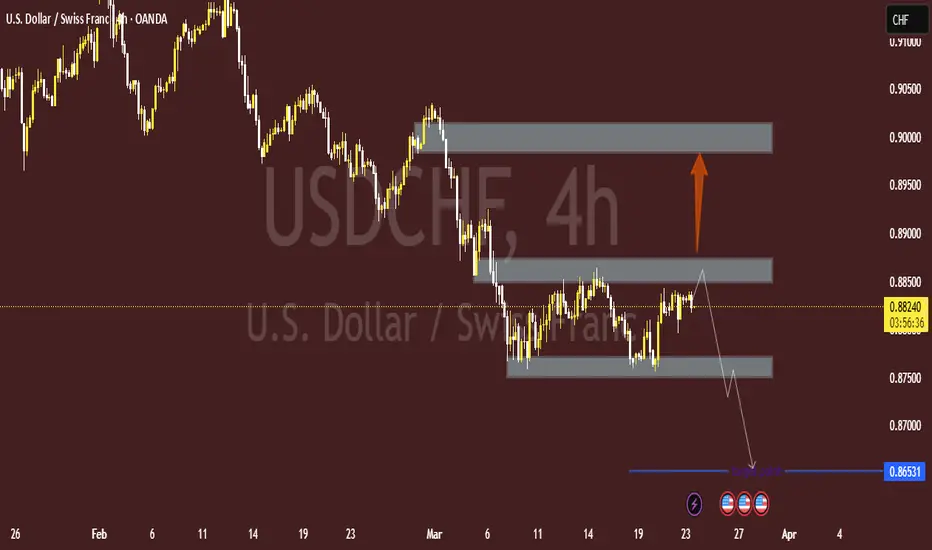
USD/CHF 4H Analysis – Key Levels & Trade Setup🔍 Key Observations:
📌 Supply & Demand Zones:
🔴 Upper Supply Zone (~0.9000): 🔥 Strong resistance where sellers might enter.
🟠 Mid Supply Zone (~0.8850): ⚠️ Key resistance where price is testing.
🟢 Lower Demand Zone (~0.8750): ✅ Possible support where buyers could step in.
📊 Price Action:
🔼 Price is currently at 0.88230 📍 near resistance.
🔽 If rejected, it might drop ⬇️ toward 0.86531 🎯.
🔼 If buyers win, it could rise to 0.9000 🚀.
📉 Bearish Bias Expected:
❌ Rejection at 0.8850 → Drop to 0.86531 ⏳.
✅ If it breaks higher, look for 0.9000 🎯.
🔎 Final Thoughts:
⚡️ Watch for reactions at 0.8850 📍.
🔹 Bearish confirmation? Sell ➡️ 0.86531.
🔹 Bullish breakout? Buy ➡️ 0.9000.
🎯 Trade wisely! 💰📉📈
Could the price bounce from here?The Swissie (USD/CHF) is falling towards the pivot and could bounce to the 1st resistance.
Pivot: 0.8507
1st Support: 0.8390
1st Resistance: 0.8727
Risk Warning:
Trading Forex and CFDs carries a high level of risk to your capital and you should only trade with money you can afford to lose. Trading Forex and CFDs may not be suitable for all investors, so please ensure that you fully understand the risks involved and seek independent advice if necessary.
Disclaimer:
The above opinions given constitute general market commentary, and do not constitute the opinion or advice of IC Markets or any form of personal or investment advice.
Any opinions, news, research, analyses, prices, other information, or links to third-party sites contained on this website are provided on an "as-is" basis, are intended only to be informative, is not an advice nor a recommendation, nor research, or a record of our trading prices, or an offer of, or solicitation for a transaction in any financial instrument and thus should not be treated as such. The information provided does not involve any specific investment objectives, financial situation and needs of any specific person who may receive it. Please be aware, that past performance is not a reliable indicator of future performance and/or results. Past Performance or Forward-looking scenarios based upon the reasonable beliefs of the third-party provider are not a guarantee of future performance. Actual results may differ materially from those anticipated in forward-looking or past performance statements. IC Markets makes no representation or warranty and assumes no liability as to the accuracy or completeness of the information provided, nor any loss arising from any investment based on a recommendation, forecast or any information supplied by any third-party.
