Bulls buyNB: Overall trend is still sells as we have a resistance line for sell area. Currently we ride the buys as its forming a flag. Any break bellow the flag resistance line indicate end of the flag hence we enter sells.
Trade cautiously
USDCHF trade ideas

Sell USDCHFI believe this may be the last downs the USD will face this quarter. I see a bearish flag pattern emerging indicating a possible declination in price to close the week negative

USD/CHF Weakness Alert: Retail Bulls vs. Smart Money FlowHere’s the latest aggregated data on the pair:
📊 4 out of 5 indicators suggest potential for further downside.
Sentiment - Bearish!
A quick note on sentiment in the table:
✅ It’s structured hierarchically — from the broadest view (COT reports) to specific entry points (algorithmic setups).
So, Retail traders are massively long USD/CHF — over 80% still buying , expecting strength.
But here’s the problem: the options flow tells a different story .
Looking at recent data from CME , we’re seeing fresh calls buying and growing open interest at key strikes upper current Swiss futures price — a sign that option traders are preparing for strong CHF
💡 Use this data in your trading OR quick check for market conditions at glance!
🎯 No Valuable Data, No Edge!

Will USDCHF go down?!!Hello traders, this is a trade that I have been scoping for a while but the week is about to close.
as you can see this is a clear downtrend.
You can clearly see a pullback in a form of a triangle.
A clear divergence.
You can either sell now or try to sell below the pivot point.

USDCHF Bearish rising wedge capped at 0.8045The USD/CHF pair is currently trading with a bearish bias, aligned with the broader downward trend. Recent price action shows a retest of the falling resistance, suggesting a temporary relief rally within the downtrend.
Key resistance is located at 0.8045, a prior consolidation zone. This level will be critical in determining the next directional move.
A bearish rejection from 0.8045 could confirm the resumption of the downtrend, targeting the next support levels at 0.7900, followed by 0.7860 and 0.7810 over a longer timeframe.
Conversely, a decisive breakout and daily close above 0.8045 would invalidate the current bearish setup, shifting sentiment to bullish and potentially triggering a move towards 0.8080, then 0.8140.
Conclusion:
The short-term outlook remains bearish unless the pair breaks and holds above 0.8045. Traders should watch for price action signals around this key level to confirm direction. A rejection favours fresh downside continuation, while a breakout signals a potential trend reversal or deeper correction.
This communication is for informational purposes only and should not be viewed as any form of recommendation as to a particular course of action or as investment advice. It is not intended as an offer or solicitation for the purchase or sale of any financial instrument or as an official confirmation of any transaction. Opinions, estimates and assumptions expressed herein are made as of the date of this communication and are subject to change without notice. This communication has been prepared based upon information, including market prices, data and other information, believed to be reliable; however, Trade Nation does not warrant its completeness or accuracy. All market prices and market data contained in or attached to this communication are indicative and subject to change without notice.

USDCHF Will Collapse! SELL!
My dear followers,
This is my opinion on the USDCHF next move:
The asset is approaching an important pivot point 0.7969
Bias - Bearish
Technical Indicators: Supper Trend generates a clear short signal while Pivot Point HL is currently determining the overall Bearish trend of the market.
Goal - 0.7955
About Used Indicators:
For more efficient signals, super-trend is used in combination with other indicators like Pivot Points.
Disclosure: I am part of Trade Nation's Influencer program and receive a monthly fee for using their TradingView charts in my analysis.
———————————
WISH YOU ALL LUCK

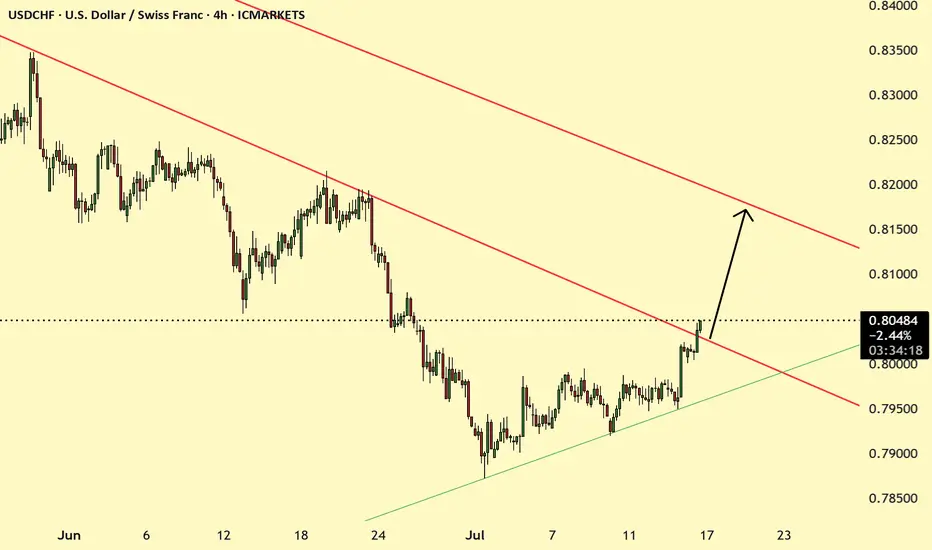
USDCHF: Bullish Outlook ExplainedLast week, the 📈USDCHF price reached a significant ascending trend line on the 4-hour chart.
Despite the market consolidating within a horizontal range for a while, the contact with the trend line propelled the pair upward.
The market subsequently broke and closed above the range's resistance.
I anticipate that the pair will continue to rise, reaching at least 0.7997.

USDCHF shortPlanning to short USD/CHF if a continuation pattern forms following the double top. The trade becomes invalid if the price makes a higher high, breaking above the double top, or if there are any shifts in macroeconomic outlook.
Jul. 9th, 2025 at 12:00 PM GMT+8
The Swiss Franc's appeal as a safe-haven currency has increased due to geopolitical tensions.
U.S. trade tariffs have contributed to uncertainty in global markets, impacting the dollar negatively.
Weak economic indicators from the U.S. have led investors to reassess monetary policy outlooks for both countries.

USDCHF Will Go Up From Support! Buy!
Take a look at our analysis for USDCHF.
Time Frame: 12h
Current Trend: Bullish
Sentiment: Oversold (based on 7-period RSI)
Forecast: Bullish
The market is on a crucial zone of demand 0.794.
The oversold market condition in a combination with key structure gives us a relatively strong bullish signal with goal 0.809 level.
P.S
The term oversold refers to a condition where an asset has traded lower in price and has the potential for a price bounce.
Overbought refers to market scenarios where the instrument is traded considerably higher than its fair value. Overvaluation is caused by market sentiments when there is positive news.
Disclosure: I am part of Trade Nation's Influencer program and receive a monthly fee for using their TradingView charts in my analysis.
Like and subscribe and comment my ideas if you enjoy them!

USDCHF - Potential downside incominglooking at UCHF we have just swept a level of liquidity.
We have had a Change of Character on the 15min to the downside and left a nice inducement / liquidity level alongside a nice FVG that has left a nice bearish orderblock
Once the spreads calm down I will set my pending order on this level and hope to be tagged into this position.
Due to the time it will be a reduced risk entry as I won't be able to manage the trade during the night.

USDCHF BUY IdeaPotential for a bullish pullback on the USDCHF which could lead to a price movement towards the resistance level at 0.85600. BUY levels from 0.79600
ABCHello awesome traders! 👑✨
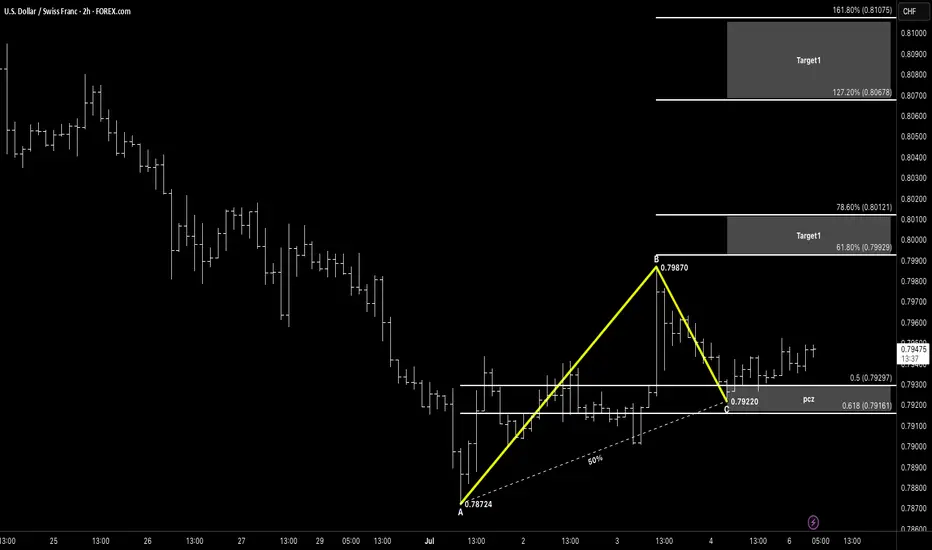
I hope you’ve had an amazing weekend and are ready to kick off the trading week like pros. Let’s dive straight into our USD/CHF 2-Hour chart — it’s shaping up to be a high-probability ABC Bullish reversal to start July strong.
🧠 Setup Breakdown
Pattern Type: ABC Bullish Reversal
A → B: Impulsive move from 0.78724 → 0.79870
B → C: Retracement down to 0.79220
Amplitude Symmetry:
AB ≈ BC in price distance (~120 pips)
BC retraces 50–61.8% of AB into the PCZ at 0.79297–0.79161
✅ Why This Works
Clean ABC structure with clear impulse & corrective legs
AB mirrors BC in amplitude—gives us a precise retracement zone
Horizontal support around 0.7925 converges into PCZ
⚔️ Entry & Risk Management
Entry Zone: Buy within 0.7916–0.7930 (PCZ)
Stop-Loss: Below C swing low at 0.79220, 5–10 pips lower (0.7910)
Risk: ≤ 1–2 % of account per trade
🎯 Profit Targets
TP1: 61.8 % retrace of B→C → 0.79929
TP2: 78.6 % retrace of B→C → 0.80121
TP3: 127.2 % extension of A→B → 0.80678
🔍 Confirmation & Invalid
Candlestick Rejection: Look for pin-bar or bullish engulfing at PCZ
Structure Break: Close back above the B→C trendline adds conviction
Invalidation: A decisive close below 0.7910 negates the setup — watch for further downside.
💡 Keep It Simple:
Pattern → Spot ABC with AB ≈ BC
PCZ → Wait for 50–61.8 % retracement of AB
Trigger → Bullish price action at C
Continuation → Ride the move toward TP zones
🔔 Watch USD drivers and SNB commentary for catalysts.
Wishing everyone a profitable week ahead — stay disciplined, manage risk like a sniper, and let structure lead, not emotions! 🚀
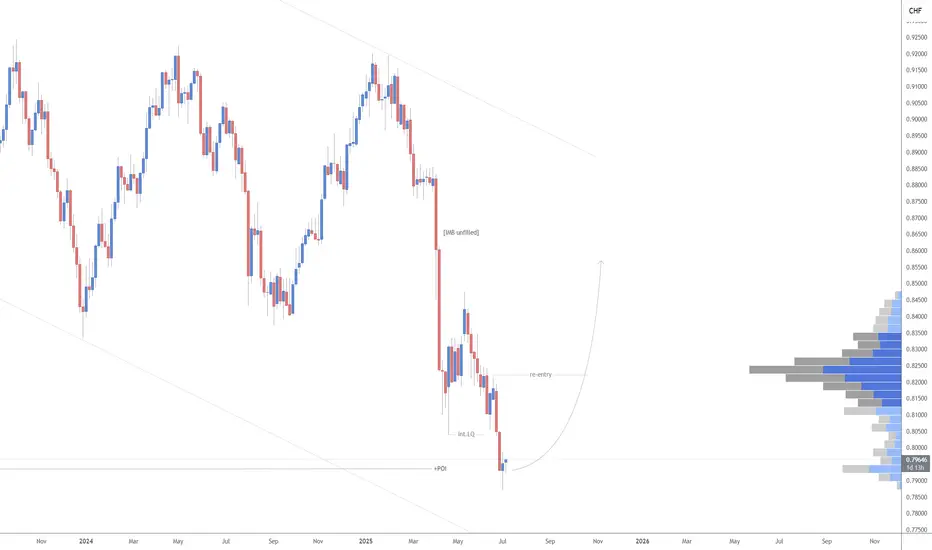
#USDCHF: Will USD Breakthrough The Strong Bearish Downtrend? The USDCHF currency pair has experienced significant volatility due to the ongoing trade dispute between the United States and China, which has led to a substantial decline in the DXY index. Consequently, CHF and JPY have emerged as the most stable currencies in the market.
Despite the USDCHF currency pair reversing its bullish trend, we anticipate a potential reversal back to a bearish position. We believe this reversal may be a temporary trap, and the currency pair is likely to regain its bullish position in the future.
There are two potential areas where the USDCHF currency pair could reverse from its current trend. The first area is relatively early, and if the USDCHF currency pair crosses a specific region, we may have a second safe option that could provide greater stability.
We extend our best wishes and best of luck in your trading endeavours. Your unwavering support is greatly appreciated.
If you wish to contribute, here are several ways you can assist us:
- Like our ideas
- Comment on our ideas
- Share our ideas
Team Setupsfx_🚀❤️

USDCHF: DXY Likely to remain bearish in long term! The USDCHF pair is likely to remain bearish in the coming days as DXY doesn’t show any bullish momentum. However, we expect DXY to be bullish in the short term, which will help the price reach our designated selling zone. Once the price reaches this zone and shows a reversal sign in a smaller timeframe, you can consider entering or taking any decision.
If you’d like to contribute, here are a few ways you can help us:
- Like our ideas
- Comment on our ideas
- Share our ideas
Team Setupsfx_🚀❤️

#USDCHF: 878+ PIPS Swing Buy In Making! Good Luck! Dear Traders,
OANDA:USDCHF
Price has been dropping since we had a change of character, there are many factors that are helping in USDCHF to drop. The mainly the first reason is CHF dominance in the market, CHF has been bullish ever since Gold continued the bullish trend, CHF, AUD and GOLD all of these three are positively correlated. Other fundamental reason is the blooming fear of recession in the US Market, on Friday we saw indices and stocks drop record high similarly to the first announcement of covid lockdown. USD index saw sharp drop due to this and it is likely that price will continue to do that on dxy index.

Buy usdchfStrong buy expected with minimum 700 pips target
Monthly and weekly still oversold pair
Strong bullish correction expected from this strong buying area
Wait to break the inner week down trend then enter into buy trade

Short USDCHFMain trend has been bearish and we currently testing the upper bound. If it holds a sell will be valid and we ride the wave

7.16 WATCH USD/CHF 4H CHARTThis one came onto the radar yesterday, we want to see a pullback into the strong S/R zone, then see ALL of the indicators line up...(engulfing candle, volume, momentum, 50 EMA) to tell us this market is ready to go up. Keep watching for now.

USDCHF break of Resistance USDCHF has recently brokend the resistance trendline is likely to go up. After the yesterday news the bullish movement of USD will continue
USDCHF Local Long!
HI,Traders !
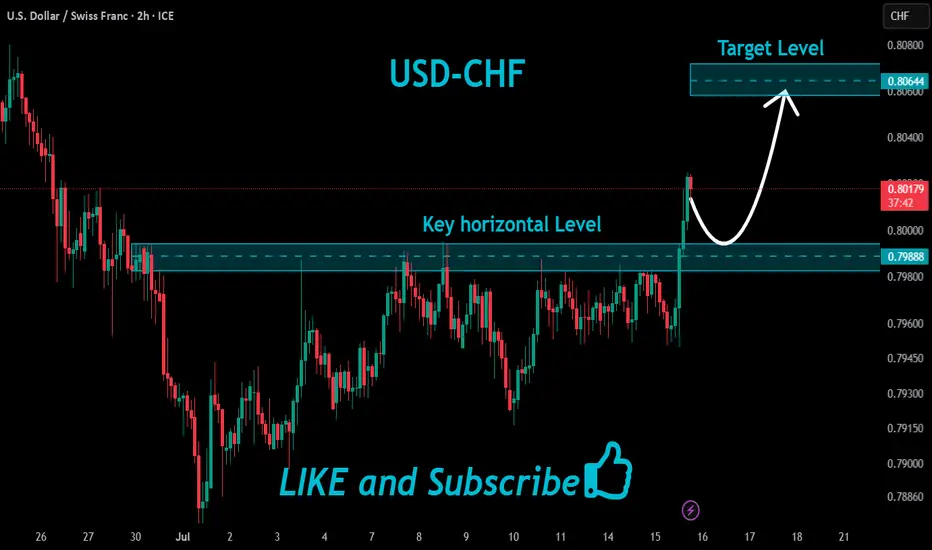
#USDCHF made a bullish
Breakout of the key horizontal
Level of 0.79888 which is now a
Support and the pair is going down
To retest the level from where
We will be expecting a
Further bullish move up !
Comment and subscribe to help us grow !
USDCHF: Impulse Candle: Buy ideaOn USDCHF as you can see on the chart we would have a hight probability to have an uptrend because we have an impulse candle breakout with force the vwap and the resistance line.

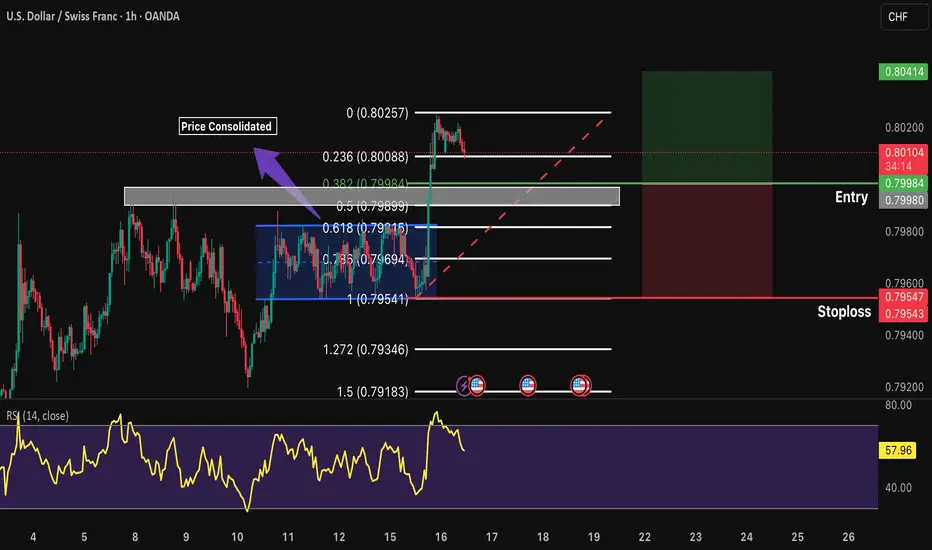
USDCHF 1H Long *Price Broke after consolidation.
*Waiting for price to retrace at point 0.382.
RR: 1:1
USDCHFOne key factor in my trading style is adapting to market structure, primarily guided by the daily time frame. However, when I analyze lower time frames, I often spot potential shifts to the upside—that's the immediate trend I focus on. While I’m fully aware that overall momentum remains bearish, I understand that for the market to move downward, it first needs liquidity. That’s why I target zones where buyers get trapped.
The difference between me and most buyers is that I know exactly where to exit before the overall trend takes control. From now on, I’ve learned that I’m rarely wrong about the market’s direction—just wrong about my stop loss placement. It’s clear they hunt stop losses, so my strategy now is using minimal risk with wider stop losses.
