USDCHF trade ideas
USD_CHF SHORT FROM RESISTANCE|
✅USD_CHF is going up now
But a strong resistance level is ahead at 0.8866
Thus I am expecting a pullback
And a move down towards the target of 0.8810
SHORT🔥
✅Like and subscribe to never miss a new idea!✅
Disclosure: I am part of Trade Nation's Influencer program and receive a monthly fee for using their TradingView charts in my analysis.
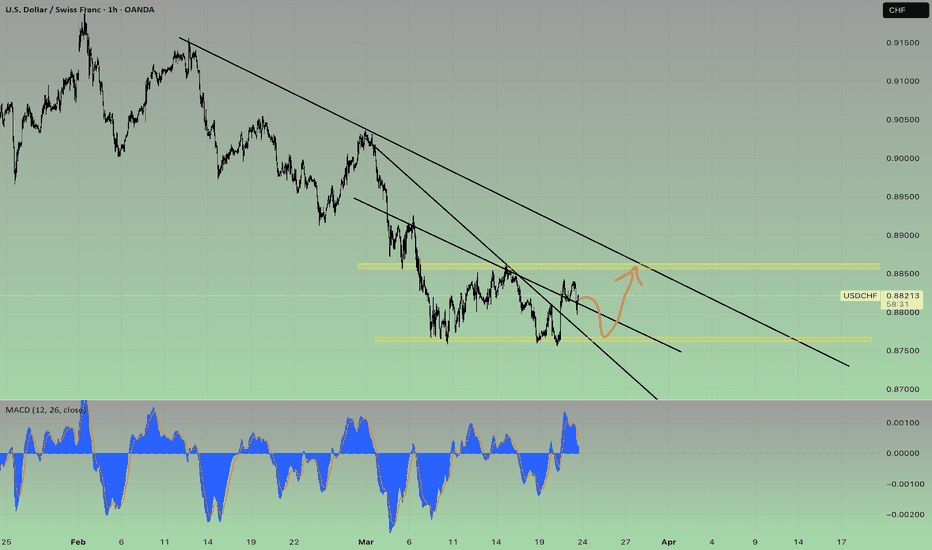
Next weeks ideaUSD/CHF trades sideways around 0.8820 even though the US Dollar trades strongly.
Fed Williams believes that the current moderate restrictive policy stance is appropriate.
The SNB cut its interest rates by 25 bps to 0.25% on Thursday.
The USD/CHF pair flattens around 0.8820 during North American trading hours on Friday. The Swiss Franc pair trades sideways even though the US Dollar (USD) exhibits strength amid expectations that the Federal Reserve (Fed) will not cut its key borrowing rates in the near term.
CHF/USD Trading Setup – Triple Bottom Reversal & Breakout Setup🔍 Overview of the Chart Setup
The CHF/USD (Swiss Franc vs. U.S. Dollar) 1-hour timeframe chart reveals a classic Triple Bottom pattern, which is a well-known bullish reversal signal. This pattern indicates that sellers have attempted to break the support level three times but failed, suggesting a potential shift in momentum from bearish to bullish.
Traders closely watch this structure as it often leads to a strong upward breakout once key resistance levels are breached. The current setup provides an excellent risk-to-reward trading opportunity, especially for those looking to capitalize on the breakout.
📊 Key Levels in the CHF/USD Chart
1️⃣ Support and Resistance Zones
🟢 Support Level (~1.1300 - 1.1280 Zone)
This zone has been tested three times, confirming strong buying interest at this price level.
The formation of long wicks on candlesticks signals strong demand and buyer dominance.
A breakdown below this level would invalidate the bullish setup and may indicate a continuation of the bearish trend.
🔴 Resistance Level (~1.1415 - 1.1430 Zone)
This level acts as a price ceiling, where previous bullish attempts were rejected.
A break and retest above this zone would confirm the Triple Bottom breakout.
🎯 Target Level (~1.1457 Zone)
The projected target is based on the height of the pattern, which is measured and added to the breakout point.
This level aligns with previous price action zones and acts as a natural take-profit area for traders.
🚨 Stop-Loss Level (~1.1243 Zone)
A stop-loss is placed below the support zone to protect against false breakouts or an invalidation of the pattern.
📉 Understanding the Triple Bottom Pattern
The Triple Bottom is a strong bullish reversal formation that occurs at the end of a downtrend. It signals that sellers are exhausted, and buyers are gradually taking control.
🔹 Breakdown of the Triple Bottom Formation
✅ Bottom 1 (First Low)
The first bottom forms when the price hits the support level and bounces back.
Sellers are still active, so price declines again to test the same support zone.
✅ Bottom 2 (Second Low - Confirmation of Support)
The second test of the support zone validates the demand area.
Buyers step in again, pushing the price upward.
The market still lacks enough momentum for a breakout, leading to a third retest.
✅ Bottom 3 (Final Low and Strong Rejection)
The third bottom is crucial because it signals the last test of support before a breakout.
The failure to break lower creates a higher probability of an upside move.
📌 Breakout Confirmation & Price Action Signals
🔵 The breakout is confirmed when:
The price closes above the resistance zone (1.1415 - 1.1430) with strong momentum.
Volume spikes during the breakout, indicating institutional buying interest.
A successful retest of the resistance zone as new support further validates the trend reversal.
If the breakout lacks volume or gets rejected, traders should be cautious of a fakeout or potential retracement.
📈 Trading Strategy & Execution Plan
🔹 Conservative Entry (Safe Approach)
Enter after a confirmed breakout above 1.1415, ensuring a strong candle close above resistance.
Look for a retest of the breakout level before entering the trade.
🔹 Aggressive Entry (Early Positioning)
Enter near the third bottom (~1.1300 - 1.1320) with a tight stop-loss.
Higher risk but better reward if the price moves upward without retesting.
🔹 Stop-Loss Placement
Conservative traders: Place the stop-loss below the support zone (~1.1243).
Aggressive traders: Place a tight stop below the recent swing low for better risk management.
📌 Profit Target Projection
Take Profit Target: 1.1457, based on the height of the pattern.
📌 Risk-to-Reward Ratio
Risk: ~60 pips (from entry to stop-loss).
Reward: ~150 pips (from entry to target).
Risk-to-Reward Ratio: 1:3, making it a high-probability trade.
📡 Additional Confirmation Indicators for Stronger Trade Setup
📊 1. Volume Analysis
A spike in volume at the breakout level suggests strong buyer interest.
Low volume on the breakout may indicate a potential fakeout.
📈 2. RSI (Relative Strength Index) Confirmation
RSI should be above 50 and trending upward to confirm bullish momentum.
If RSI is overbought (>70), watch for a pullback before entering the trade.
📉 3. Moving Averages Support
If the 50-period or 200-period moving average supports the breakout level, it adds extra confirmation.
A moving average crossover may further validate the trend reversal.
🔍 4. Beware of Fake Breakouts
If the price briefly moves above resistance but fails to hold, it may be a bull trap.
Always wait for a candle close above resistance and a potential retest before confirming the entry.
🛠️ Alternative Scenarios & Market Risks
🔺 Bullish Scenario (Breakout & Rally to Target)
Price breaks above 1.1415, confirming a trend reversal.
A retest of resistance as support gives additional buying confidence.
Price reaches 1.1457 target before facing new resistance.
🔻 Bearish Scenario (Fakeout & Breakdown Below Support)
Price fails to hold above resistance and falls back below support.
A breakdown below 1.1243 invalidates the pattern, triggering a bearish continuation.
Traders should cut losses quickly if the setup is invalidated.
⚠️ Fundamental Risks to Watch
U.S. Dollar news events (FOMC, NFP, CPI reports) can increase volatility.
Swiss economic data may impact CHF strength.
Unexpected geopolitical events can influence currency movements.
🔎 Summary of the Trading Plan
📌 Trading Strategy Checklist
✅ Pattern: Triple Bottom (Bullish Reversal).
✅ Entry Strategy: Buy after breakout confirmation above 1.1415.
✅ Take Profit Target: 1.1457.
✅ Stop-Loss Level: Below 1.1243.
✅ Risk-to-Reward Ratio: 1:3 (High-Profit Potential with Proper Risk Management).
💡 Final Thought:
This setup provides a high-probability bullish trade with strong technical confluence. However, always remain cautious of market news, economic reports, and sudden volatility that could influence price action.
🚀 Patience & discipline are key—wait for confirmation before entering! 📊
Swissie long fondamentalSNB rate cut this Thursday “dovish” currency less attractive than the dollar
Which has been the subject of strong speculation about a possible recession
Because forecasts have fallen sharply and the fed is taking a more dovish view
But the US economy remains strong and is probably undervalued.
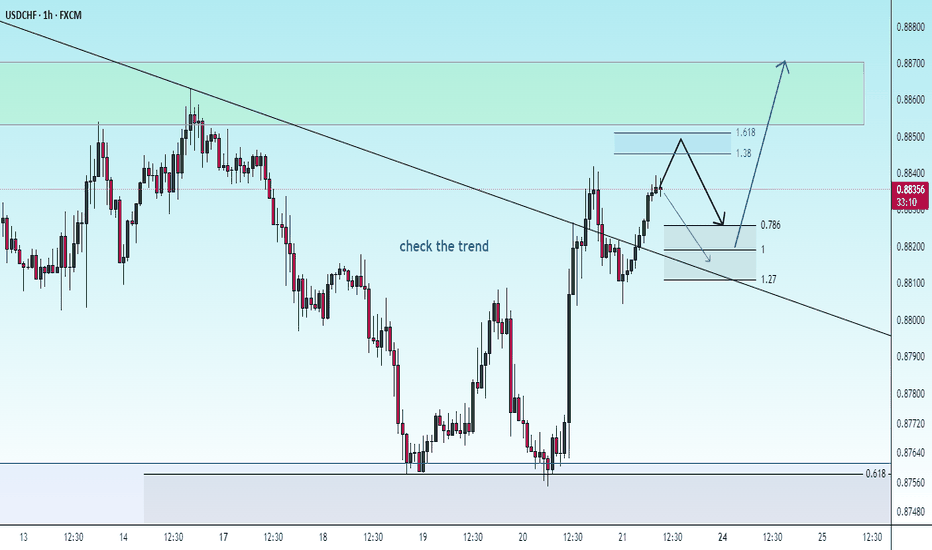
Be careful with USDCHF !!!It can pump after the correction...
Give me some energy !!
✨We spend hours finding potential opportunities and writing useful ideas, we would be happy if you support us.
Best regards CobraVanguard.💚
_ _ _ _ __ _ _ _ _ _ _ _ _ _ _ _ _ _ _ _ _ _ _ _ _ _ _ _ _ _ _ _
✅Thank you, and for more ideas, hit ❤️Like❤️ and 🌟Follow🌟!
⚠️Things can change...
The markets are always changing and even with all these signals, the market changes tend to be strong and fast!!
USDCHF: Bullish Outlook Explained 🇺🇸🇨🇭
USDCHF looks bullish after a test of the underlined blue support.
The price formed a double bottom on that and broke its neckline
on Friday.
We see a positive bullish reaction to that after its retest.
I think that the market will continue rising and reach
at least 0.885 resistance.
❤️Please, support my work with like, thank you!❤️
I am part of Trade Nation's Influencer program and receive a monthly fee for using their TradingView charts in my analysis.
UC update correctionRecent U.S. economic releases—covering robust manufacturing, employment figures, and other key indicators—suggest solid economic momentum. Meanwhile, Swiss data tends to be more cautious, partly due to safe‑haven demand and a more conservative economic outlook. This divergence supports a stronger U.S. dollar relative to the Swiss franc.
The latest COT report indicates that large speculators are either increasing their net-long positions in U.S. dollar futures or reducing their short exposure relative to CHF. Such positioning reinforces the bullish bias on the dollar against the franc.
In combination, these factors suggest that USD/CHF is likely to trend higher in the coming days as the strong U.S. fundamentals and favorable institutional positioning push the pair upward.
Expecting a bullish move from this pair
USDCHF Wave Analysis – 21 March 2025
- USDCHF reversed from support level 0,8750
- Likely to fall to support level 208.00
USDCHF currency pair recently reversed from the pivotal support level 0,8750 (former strong support from December and the start of March) standing close to the 50% Fibonacci correction of the upward impulse from September.
The upward reversal from the support level 0,8750 created the daily Japanese candlesticks reversal pattern Morning Star.
USDCHF can be expected to rise to the next resistance level 0.8850 (top of the previous minor correction ii).
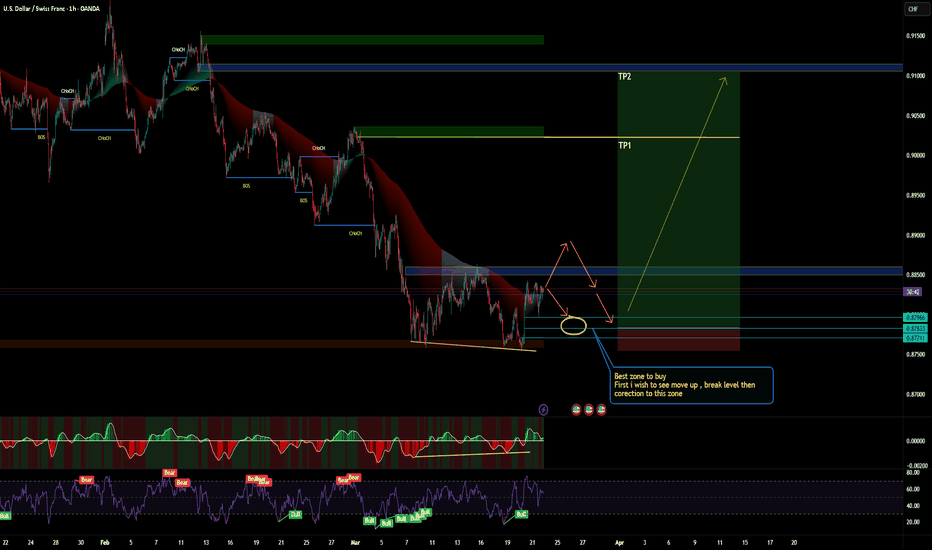
USDCHF BUYGiven the current scenario and the price action analysis of #USDCHF, we anticipate buying opportunities in the marked areas. Using the arrows, we can clearly examine the potential future price movement.
#Forex #Trading #ForexSignals #PriceAction #ForexMarket #FXTrading #ForexStrategy #TechnicalAnalysis #DayTrading #SwingTrading #ForexTrader
CHF/USD Bullish Cup Formation | Support & Breakout Target Pattern Formation: Bullish Cup & Handle Breakout Setup
The price action on this CHF/USD 1-hour chart exhibits a Cup & Handle pattern, which is a well-known bullish continuation setup. This pattern suggests that buyers are gradually gaining control and a breakout could be imminent.
1️⃣ Understanding the Cup Formation
The cup shape (curved blue line) signifies a gradual accumulation phase, where price initially declined, formed a rounded bottom, and then started recovering.
This indicates that buyers are regaining momentum after a consolidation period.
The lowest point of the cup formed around March 16, from where the price began a steady upward move.
2️⃣ Key Support & Resistance Levels
Support Level: The strong demand zone is established around 1.1300 - 1.1320, as shown by multiple price bounces.
Resistance Level & ATH (All-Time High): The price struggled to break 1.1450 - 1.1470, indicating a major resistance zone where sellers previously took control.
3️⃣ Handle Formation & Pullback
After reaching resistance, the price formed a slight retracement (small descending wedge), which created the handle of the pattern.
The pullback was necessary to clear short-term overbought conditions before a potential breakout attempt.
4️⃣ Trading Strategy & Price Projection
🔹 Entry & Breakout Confirmation
If CHF/USD breaks above 1.1450 - 1.1470 with volume confirmation, this will validate the Cup & Handle breakout.
A confirmed breakout suggests further upside momentum toward 1.1570 - 1.1600, aligning with the pattern’s measured move.
🔹 Stop-Loss Placement
A logical stop-loss should be placed below the handle’s low (~1.1300 - 1.1320), in case of a false breakout or sudden market reversal.
🔹 Target Projection Based on Pattern Measurement
The height of the cup (~200 pips from bottom to resistance) is projected upwards from the breakout level.
This results in a take-profit target of 1.1575 - 1.1600.
5️⃣ Additional Technical Confluences
✅ Trendline Support: The price is respecting an ascending trendline, indicating continued higher lows and bullish sentiment.
✅ Bullish Momentum: The series of higher lows confirms a strong uptrend, favoring buyers.
✅ Potential Fakeout Risks: A failed breakout below 1.1300 could invalidate the bullish outlook, leading to a deeper retracement.
6️⃣ Final Thoughts: Is This a Good Setup?
📌 Overall Bias: Bullish ✅
📌 Breakout Confirmation Needed: Above 1.1450 - 1.1470
📌 Target: 1.1570 - 1.1600 🎯
📌 Risk Management: Stop-loss below 1.1300
If CHF/USD sustains momentum above resistance, traders can anticipate a strong bullish rally toward the projected target. However, it’s essential to wait for confirmation before entering long positions. 📈🔥
usdchf opportunity"Dear followers, I’d like to share a free trading tip with you: consider buying the USD/CHF currency pair. I’ve analyzed the market trends and believe this opportunity holds strong potential. To stay updated and gain more valuable technical insights, follow my detailed analyses. Your support means the world to me, and I’m dedicated to providing you with quality guidance for your trading journey. Let’s succeed together!"
Potential double bottom pattern on USDCHFOn the 4-hour chart, USDCHF has formed a potential double bottom pattern in the short term. At present, attention can be paid to the resistance near 0.8864. If it breaks through, it will continue to rise, with the upward target looking at around 0.8960. At present, attention can be paid to the pullback near 0.8820 to go long.
USDCHF H4 | Bearish Reversal Based on the H4 chart, the price is approaching our sell entry level at 0.8856, an overlap resistance.
Our take profit is set at 0.8810, an overlap support.
The stop loss is set at 0.8906, a swing high resistance.
High Risk Investment Warning
Trading Forex/CFDs on margin carries a high level of risk and may not be suitable for all investors. Leverage can work against you.
Stratos Markets Limited (fxcm.com/uk):
CFDs are complex instruments and come with a high risk of losing money rapidly due to leverage. 63% of retail investor accounts lose money when trading CFDs with this provider. You should consider whether you understand how CFDs work and whether you can afford to take the high risk of losing your money.
Stratos Europe Ltd (fxcm.com/eu):
CFDs are complex instruments and come with a high risk of losing money rapidly due to leverage. 63% of retail investor accounts lose money when trading CFDs with this provider. You should consider whether you understand how CFDs work and whether you can afford to take the high risk of losing your money.
Stratos Trading Pty. Limited (fxcm.com/au):
Trading FX/CFDs carries significant risks. FXCM AU (AFSL 309763), please read the Financial Services Guide, Product Disclosure Statement, Target Market Determination and Terms of Business at fxcm.com/au
Stratos Global LLC (fxcm.com/markets):
Losses can exceed deposits.
Please be advised that the information presented on TradingView is provided to FXCM (‘Company’, ‘we’) by a third-party provider (‘TFA Global Pte Ltd’). Please be reminded that you are solely responsible for the trading decisions on your account. There is a very high degree of risk involved in trading. Any information and/or content is intended entirely for research, educational and informational purposes only and does not constitute investment or consultation advice or investment strategy. The information is not tailored to the investment needs of any specific person and therefore does not involve a consideration of any of the investment objectives, financial situation or needs of any viewer that may receive it. Kindly also note that past performance is not a reliable indicator of future results. Actual results may differ materially from those anticipated in forward-looking or past performance statements. We assume no liability as to the accuracy or completeness of any of the information and/or content provided herein and the Company cannot be held responsible for any omission, mistake nor for any loss or damage including without limitation to any loss of profit which may arise from reliance on any information supplied by TFA Global Pte Ltd.
The speaker(s) is neither an employee, agent nor representative of FXCM and is therefore acting independently. The opinions given are their own, constitute general market commentary, and do not constitute the opinion or advice of FXCM or any form of personal or investment advice. FXCM neither endorses nor guarantees offerings of third-party speakers, nor is FXCM responsible for the content, veracity or opinions of third-party speakers, presenters or participants.
UPDATED ANALYSIS FOR USD/CHFUSD/CHF 4H - Wit this pair you can see that price has recently traded down and into a valid area of Demand, I am expecting enough Demand to be introduced to flip the balance.
I have gone ahead and marked out the last protected high within the bearishness that has traded price down and into the area of interest. Once we see a break in that we will have more confirmation.
A break in the last high tells us that the bearishness trading us down has come to an end and a new trend to the upside is ready to be printed into the market.
This is when we can begin to look to enter in on this market with long positions. To further back our analysis we have had some positive news for the USD, meaning it should appreciate next week.


