USD/CHF: Bearish Continuation Towards Key SupportUSD/CHF has maintained a strong bearish trend, forming a series of lower highs and lower lows. The chart highlights a **Deep Crab** harmonic pattern, which previously triggered a corrective move before resuming its overall downtrend.
Currently, price action is trading near **0.8767**, approaching a key support zone at **0.8722** (HOP level). The recent rejection from the **H4 supply zone** around **0.8920** further confirms bearish momentum, suggesting sellers remain in control.
**Key Considerations:**
- A breakdown below **0.8722** could accelerate further downside, extending losses towards lower psychological levels.
- A potential pullback may occur if buyers step in at support, but the overall bearish structure remains intact unless a significant reversal signal appears.
**Conclusion:** USD/CHF remains under bearish pressure, with a high probability of further declines. Traders should monitor price action at support for potential continuation or reversal signals before committing to new positions.
USDCHF trade ideas

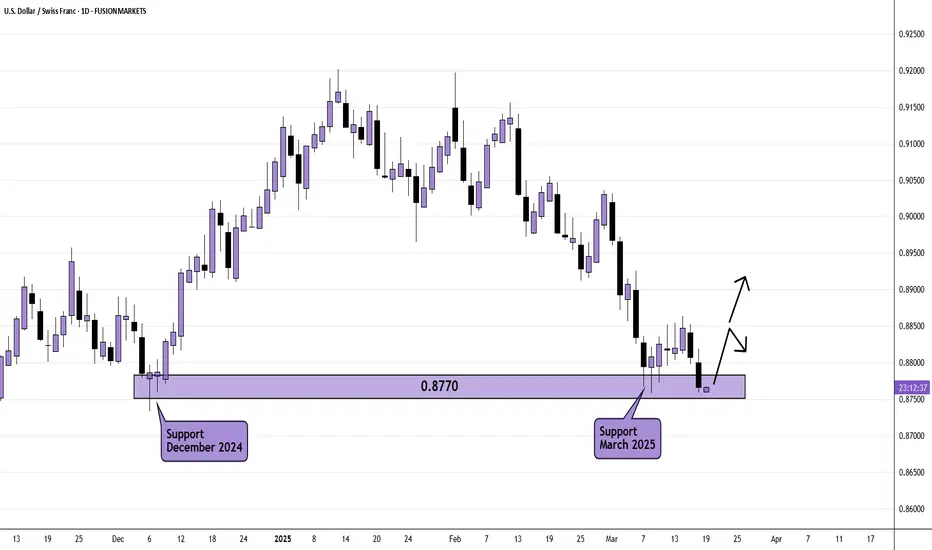
USD/CHF Daily AnalysisPrice is back at daily support (tested and rejected in December 2024 and most recently March 2025).
Tuesdays daily candle saw a bearish close at the level. If price breaks the high on Wednesday, we could see 0.8850 tested again.
From there, price could reject (again) or push higher.
The upcoming FOMC statement could change everything though.
USDCHF Take it or Leave it.USDCHF - The price is testing a demand zone from Dec 2024. The only valid scenario for this pair is to sell. We can wait to see how the price will react the next days.

USD-CHF Free Signal! Buy!
Hello,Traders!
USD-CHF keeps falling down
But the pair will soon hit
A horizontal support
Of 0.8754 from where
We can enter a long trade
With the TP of 0.8795
And the SL of 0.8730
Buy!
Comment and subscribe to help us grow!
Check out other forecasts below too!
Disclosure: I am part of Trade Nation's Influencer program and receive a monthly fee for using their TradingView charts in my analysis.

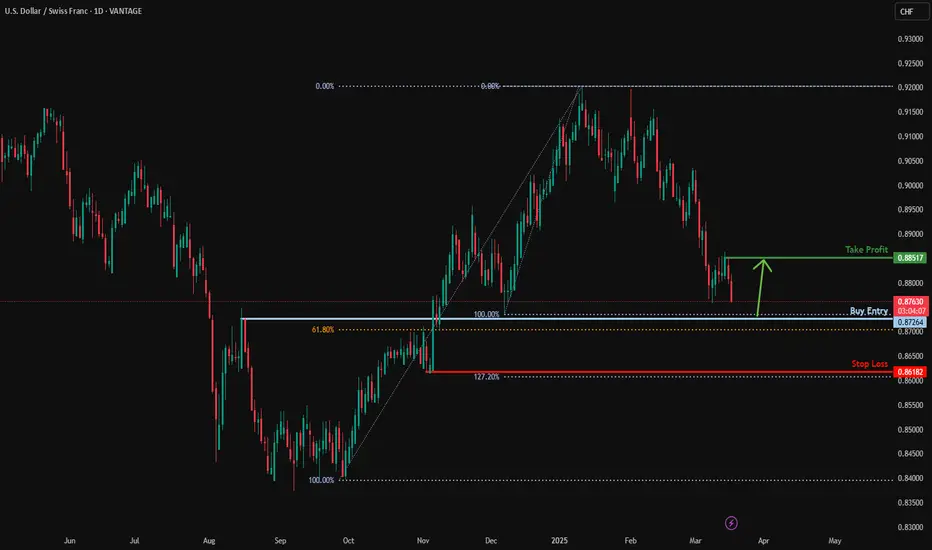
Bullish bounce?USD/CHF is falling towards the support level which is an overlap support that is slightly above the 61.8% Fibonacci retracement and could bounce from this level to our take profit.
Entry: 0.8726
Why we like it:
There is an overlap support level that is slightly above the 61.8% Fibonacci retracement.
Stop loss: 0.8618
Why we like it:
There is a pullback support level that aligns with the 127.2% Fibonacci extension.
Take profit: 0.8851
Why we like it:
There is a pullback resistance level.
Enjoying your TradingView experience? Review us!
Please be advised that the information presented on TradingView is provided to Vantage (‘Vantage Global Limited’, ‘we’) by a third-party provider (‘Everest Fortune Group’). Please be reminded that you are solely responsible for the trading decisions on your account. There is a very high degree of risk involved in trading. Any information and/or content is intended entirely for research, educational and informational purposes only and does not constitute investment or consultation advice or investment strategy. The information is not tailored to the investment needs of any specific person and therefore does not involve a consideration of any of the investment objectives, financial situation or needs of any viewer that may receive it. Kindly also note that past performance is not a reliable indicator of future results. Actual results may differ materially from those anticipated in forward-looking or past performance statements. We assume no liability as to the accuracy or completeness of any of the information and/or content provided herein and the Company cannot be held responsible for any omission, mistake nor for any loss or damage including without limitation to any loss of profit which may arise from reliance on any information supplied by Everest Fortune Group.
#003 Moving Average USDCHF Sell 0153SGT 18032025The title says moving average, and I did use the moving average this time but it won't always be the moving average.
I think the USDJPY trade #002 might have been abit dragged out, and I jumped in slightly too late. But it is ok.
I also took correlated pairs and am selling the USD.
But its ok.
I think Kei sensei must have some magic that works, and I have been trying different things and I think Kei sensei is really right.
Less is more. If we get 2% in 1 trade and also get 2% in 10 trades, then why would we trade 10 times just to get 2% ?
Why would we pay 10 times the commission just to get the same results plus gain 10 times the stress?
I think the USDJPY #002 trade is a test kit. I need to know how deep the water is, and that trade is my test kit. It doesn't matter if I lose that one or not, because now I remembered what I should do and what I shouldn't.
Look out for fresh potential breakouts, retracements that could be traded.
Get good natural dopamine into the system then come see the charts.
Once you made some money outside, then the charts will be a, "if I have it, I have it. If I don't have it, I don't have it, and I don't give a f" kind of vibe.
If you missed it, don't give it any f because there will be other opportunities that will come.
Sometimes, in this watchlist of pairs, sometimes, you make new watchlists because new fresh potential breakouts and retracements came up.
You will be ok. 1 trade, 2, 3 trades a month is alot. as long as you made some money, just run.
Don't hinge your hopes on getting 10% every month because of ftmo's rules of getting 10% in a month in order to pass the 1st phase of the challenge.
0211SGT 18032025

Trendline breakThe price broke a trendline with a strong bearish momentum, then a pullback followed and now the price has made a lower low, its time to go bearish
WE ONLY TRADE PULLBACKS

USD/CHF Struggles at Key Support Amid Bearish MomentumUSD/CHF remains under pressure after breaking below the 200-day SMA (0.8815) and failing to reclaim it. The pair has formed a bearish flag pattern, indicating the potential for further downside. The next key support level sits at 0.8750, which, if breached, could accelerate selling pressure.
Momentum indicators confirm the bearish outlook:
📉 MACD remains in negative territory, signaling weak momentum.
📊 RSI at 34.75 nears oversold conditions but hasn’t triggered a reversal signal yet.
Key Levels to Watch:
📌 Support: 0.8750 (critical level), 0.8650 (next downside target)
📌 Resistance: 0.8850 (recent swing high), 0.9010 (50-day SMA)
A break below 0.8750 could open the door for a deeper decline, while a bounce above 0.8850 would signal a potential recovery.
-MW

¡¡¡SELL!!! USDCHF IN THIS DAILY INTEREST ZONEHELLO TRADERS, I AM VERY INTERESTED IN SELLING THIS USDCHF PAIR FOR THE NEXT NEW YORK SESSION. FOLLOW MY ENTRY SIGNAL. EVERYTHING INDICATES THAT THE PRICE IS GOING TO GO DOWN.
TECHNICAL ANALYSIS
CONFLUENCES AT THIS MOMENT
1. Bearish daily timeframe
2. Rejection of the last daily structure point
3. Rejection of the daily zone of interest
4. Daily engulfing candle
5. Rejection of the last 4 hour structure point
6. 4 hour rejection candle
7. 30 M structure change
8. 15 M engulfing candle, 30 M engulfing candle, 1 hour engulfing candle, 2 hour engulfing candle
Why do I like it?
The daily and 4-hour timeframes are bearish, meaning they are in harmony. The most logical thing to do is to sell now and ride the trend!
Today's daily candle was rejected at the last point of the structure (previous daily low).
The price was rejected at a daily zone of interest that has been respected in the past.
We have a daily engulfing candle.
The price has gone from bullish to bearish on the 4-hour timeframe and has also retested the last point of the 4-hour structure.
There is a rejection candle on the 4-hour timeframe, which indicates a downward price reversal.
Now we have the daily and 4-hour timeframes, as I mentioned earlier, the most logical thing to do is to look for shorts. I will wait for a retest of my zone of interest to enter a short position if my entry pattern is fulfilled in 30 minutes during the New York session.
If you like my idea, don't forget to like and follow me. I'll respond to suggestions and comments! FxAlexisTrader.

USD/CHF 4-Hour Timeframe AnalysisUSD/CHF 4-Hour Timeframe Analysis
The USD/CHF pair remains in a well-defined downtrend, forming a series of lower highs (LH) and lower lows (LL) on the 4-hour timeframe. Recently, the price broke below the 0.88100 minor key level, which has now turned into a resistance zone, reinforcing the bearish momentum. Following the breakdown, the market accumulated a significant volume of sell positions before initiating a liquidity hunt where price temporarily moved higher to trigger stop losses before resuming its downward trajectory. Currently, the pair is showing renewed selling pressure, and we are observing whether price will revisit the 0.88050 region for a minor pullback before continuing lower.
Key Technical Levels
Key Resistance: 0.88100 (Previous Support Turned Resistance)
Observation Zone: 0.88050 (Potential Retest Area)
Next Support Target: 0.87040 (Next Significant Support Level)
Fundamental Insight:
The Swiss franc (CHF) continues to strengthen, supported by the Swiss National Bank’s (SNB) shift in intervention strategy. Unlike 2023, where the SNB sold over 132.9 billion CHF in foreign currency, this year has seen a net purchase of 1.2 billion CHF, indicating confidence in its inflation management. The current inflation rate at 1.1% remains within the SNB’s comfort range, reducing the likelihood of further aggressive monetary policy adjustments.
Traders are closely watching the SNB’s policy rate decision scheduled for release this week. The forecast suggests a potential rate cut from -0.50% to -0.25%, which could signal a slightly more accommodative stance by the SNB. However, the impact on CHF strength will depend on market expectations versus actual policy action. If the rate cut is confirmed, it could temporarily weaken CHF, providing short-term relief for USD/CHF. Conversely, if the SNB maintains a cautious approach, CHF may continue to gain strength, reinforcing the bearish technical outlook for USD/CHF.
Meanwhile, the US dollar faces near-term headwinds amid uncertainty surrounding Federal Reserve policy expectations. The market remains cautious about potential rate cuts later in the year, limiting USD upside potential.
📌 Disclaimer:
This analysis is for informational and educational purposes only and should not be considered financial advice. Trading involves substantial risk, and past performance is not indicative of future results. Always conduct your own research and consult with a financial professional before making any investment decisions.


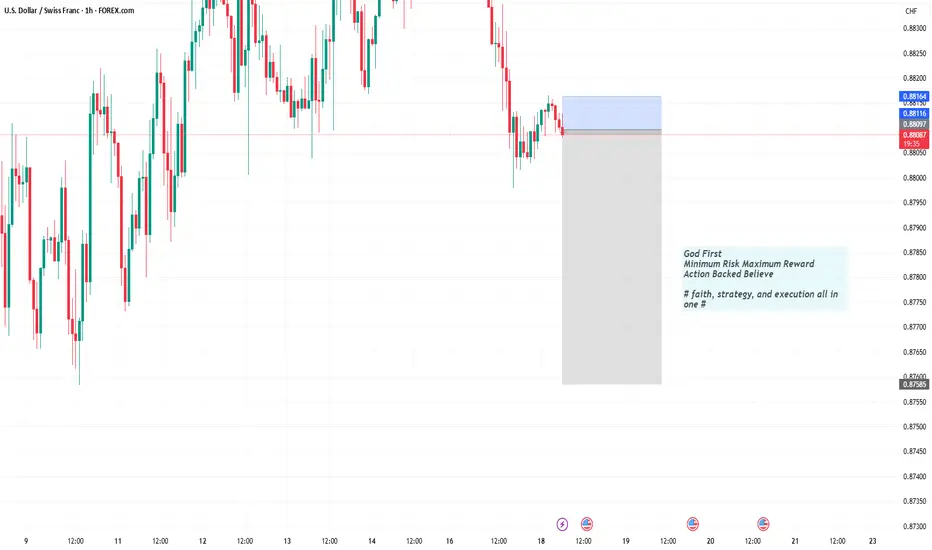
SELLGod First
Minimum Risk Maximum Reward
Action Backed Believe
# faith, strategy, and execution all in one #
usdchf sell tradeThe Relative Strength Index (RSI) is showing a downward trend, indicating weakening momentum. Additionally, the Moving Average Convergence Divergence (MACD) is showing a bearish crossover, further supporting the potential for a downward move

CHF/USD 4H Analysis - Potential Bearish Reversal Setup
🔹 Market Structure & Price Action:
The price has been trending upwards inside a rising channel, forming higher highs and higher lows.
Recently, price tapped into a key resistance zone (black box), indicating a potential reversal.
A possible bearish correction could unfold from this level.
📉 Bearish Scenario:
If the price fails to hold the resistance, a bearish rejection could drive price downward.
The first major support target aligns with the previous demand zone around 1.10700.
A further drop could test the 1.09100 support area, as shown in the green zones.
📈 Bullish Alternative:
A break and hold above resistance could invalidate the bearish setup and signal further upside movement.
🔻 Trading Plan:
Sell bias near resistance with confirmations (e.g., rejection wicks, bearish engulfing, trendline break).
Targeting the marked support levels.
Invalidation if price breaks and closes above the resistance.

USD_CHF BEARISH BREAKOUT|SHORT|
✅USD_CHF is trading in a
Downtrend and we are seeing
A bearish breakout from the
Bearish wedge pattern which
Is why we are bearish biased and
We will be expecting the pair
To go further down
SHORT🔥
✅Like and subscribe to never miss a new idea!✅

USDCHF 4H timeframe forecastWe have an impulse pattern down following all of the Elliott Wave Theory Guidelines. Anticipating a further decline to make a 5th wave on the blue degree potentially breaks the previous lows.
