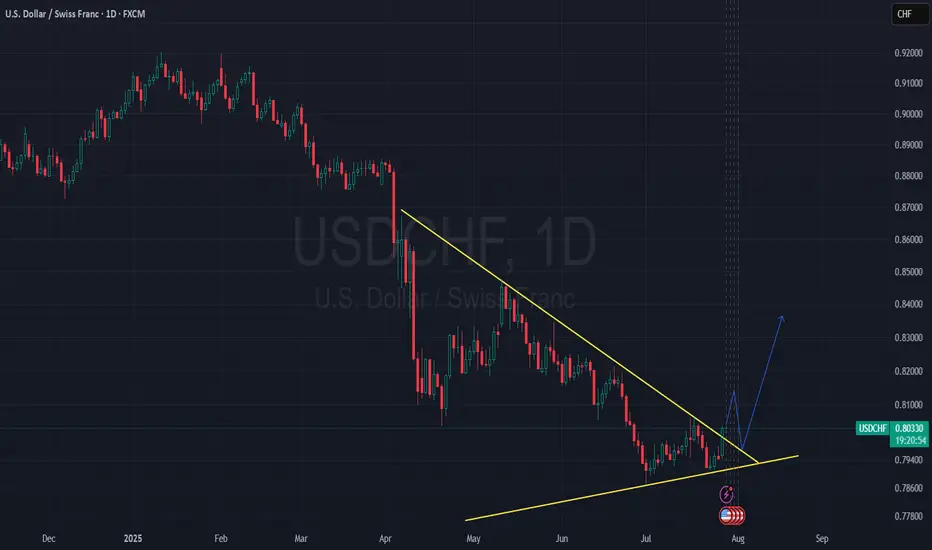
Liquidity Grab Complete? Why USDCHF Could Be Heading South📉 USDCHF remains firmly in a downtrend on both the weekly (1W) and daily (1D) timeframes. The recent bullish retracement is now confronting a critical resistance zone 🔒 — defined by a descending trendline and a daily order block between 0.8150–0.8200.
🧱 Price action at this level shows clear signs of rejection, aligning with a bear flag formation, which could pave the way for continued downside toward the 0.7800–0.7600 region.
📊 Fundamentally, the Swiss Franc (CHF) continues to gain strength, supported by Switzerland’s stable economic outlook and ongoing safe-haven demand. Meanwhile, the US Dollar faces headwinds from dovish Fed expectations and rising political uncertainty in the US 🇺🇸.
🔮 From a Wyckoff/ICT perspective, this upward move appears to be a liquidity grab into a premium zone, with smart money likely distributing positions before initiating a new markdown phase. A sell bias is favored below 0.8200, with downside targets set at 0.8000 and beyond.
📅 Keep a close eye on this week’s US NFP and Swiss CPI releases — both could inject fresh volatility into the pair.
USDCHF trade ideas

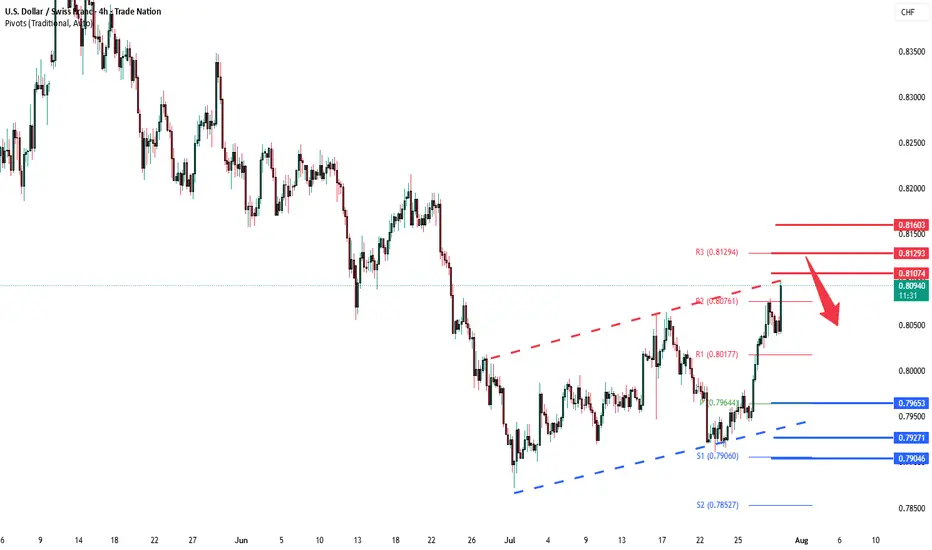
USD_CHF LOCAL SHORT|
✅USD_CHF price went up sharply
But a strong resistance level was hit at 0.8152
Thus, as a pullback is already happening
And a move down towards the
Target of 0.8113 shall follow
SHORT🔥
✅Like and subscribe to never miss a new idea!✅
Disclosure: I am part of Trade Nation's Influencer program and receive a monthly fee for using their TradingView charts in my analysis.

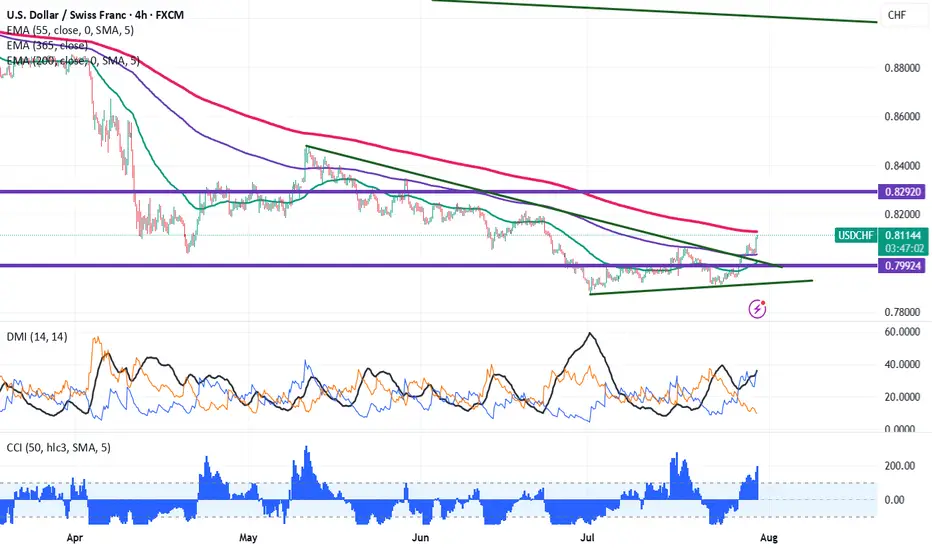
USD/CHF Smashes 0.8090 Resistance, good to buy on dips USDCHF breaks significant resistance 0.8090 on board-based US dollar buying. It hits an intraday high of 0.81058 and is currently trading around 0.081003.
Technical Analysis Points to Further Upside
The pair is trading above the 55-EMA, 200 EMA and below 365 EMA on the 4-hour chart, indicating a mixed trend. The immediate resistance is at 0.8135, any break above targets 0.8170/0.8215/0.8250.
Support Levels and Potential Declines
On the downside, near-term support is around 0.8060; any violation below will drag the pair to 0.8020/0.7980/0.7920/0.7860/0.7800.
Indicators (4-hour chart)
CCI (50) - Bullish
Directional Movement Index - Bullish
Trading Strategy Recommendation
It is good to buy on dips around 0.8090 with a stop-loss at 0.8058 for a TP of 0.8170/0.8215.
USDCHF oversold bounce backs capped at 0.8107The USD/CHF pair is currently trading with a bearish bias, aligned with the broader downward trend. Recent price action shows a retest of the falling resistance, suggesting a temporary relief rally within the downtrend.
Key resistance is located at 0.8107, a prior consolidation zone. This level will be critical in determining the next directional move.
A bearish rejection from 0.8084 could confirm the resumption of the downtrend, targeting the next support levels at 0.7965, followed by 0.7927 and 0.7900 over a longer timeframe.
Conversely, a decisive breakout and daily close above 0.8107 would invalidate the current bearish setup, shifting sentiment to bullish and potentially triggering a move towards 0.8130, then 0.8160.
Conclusion:
The short-term outlook remains bearish unless the pair breaks and holds above 0.8084. Traders should watch for price action signals around this key level to confirm direction. A rejection favours fresh downside continuation, while a breakout signals a potential trend reversal or deeper correction.
This communication is for informational purposes only and should not be viewed as any form of recommendation as to a particular course of action or as investment advice. It is not intended as an offer or solicitation for the purchase or sale of any financial instrument or as an official confirmation of any transaction. Opinions, estimates and assumptions expressed herein are made as of the date of this communication and are subject to change without notice. This communication has been prepared based upon information, including market prices, data and other information, believed to be reliable; however, Trade Nation does not warrant its completeness or accuracy. All market prices and market data contained in or attached to this communication are indicative and subject to change without notice.
USD/CHFUSD/CHF Overview:
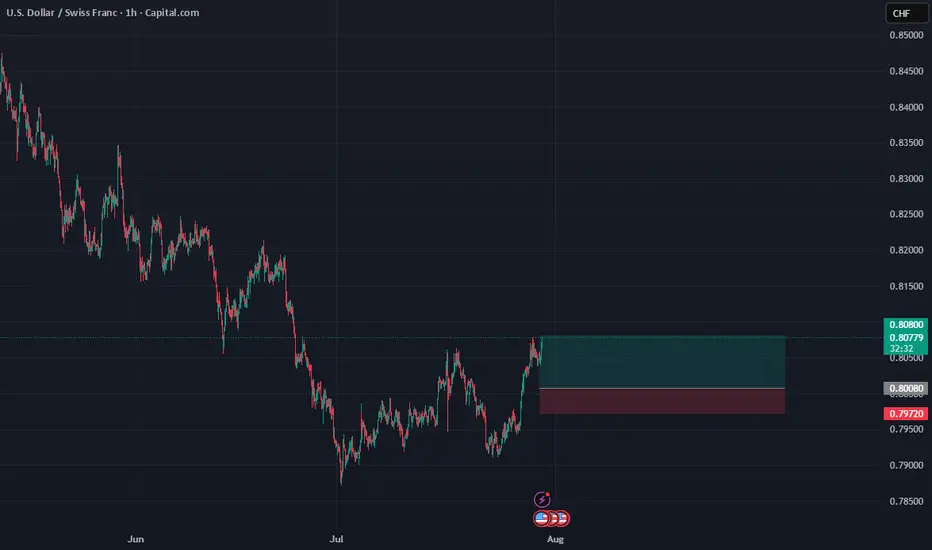
After a downward correction in recent weeks, the USD/CHF pair appears to be finding some support around the 0.80000 - 0.79800 levels. We are observing signs of price consolidation, which could indicate a potential bullish bounce.
Trade Details (Pending Order):
Order Type: Buy Limit
Entry Point: 0.80080
This point was chosen based on a previous support area and the price's attempt to consolidate above it.
Stop Loss (SL): 0.79720
The stop loss is located below a clear local low and below the psychological support level of 0.80000 to provide adequate protection.
Take Profit (TP): 0.80800
This level targets a retest of a previous resistance area, or as a conservative target for the first bullish bounce.
Risk Management:
Distance to Stop Loss: 36 pips (0.80080 - 0.79720)
Distance to Take Profit: 72 pips (0.80800 - 0.80080)
Risk-to-Reward Ratio (R:R): 1:2
This ratio is considered excellent and provides a good opportunity for profit compared to the potential risk.
Additional Considerations:
Traders are monitoring upcoming economic data from the United States and Switzerland.
A decisive break above 0.79720 could invalidate this idea, while a break above 0.80800 could open the door to further upside.
Disclaimer:
This is merely an analytical trading idea and is not intended as investment advice. Please manage your risk consciously and conduct your own research before making any trading decisions.
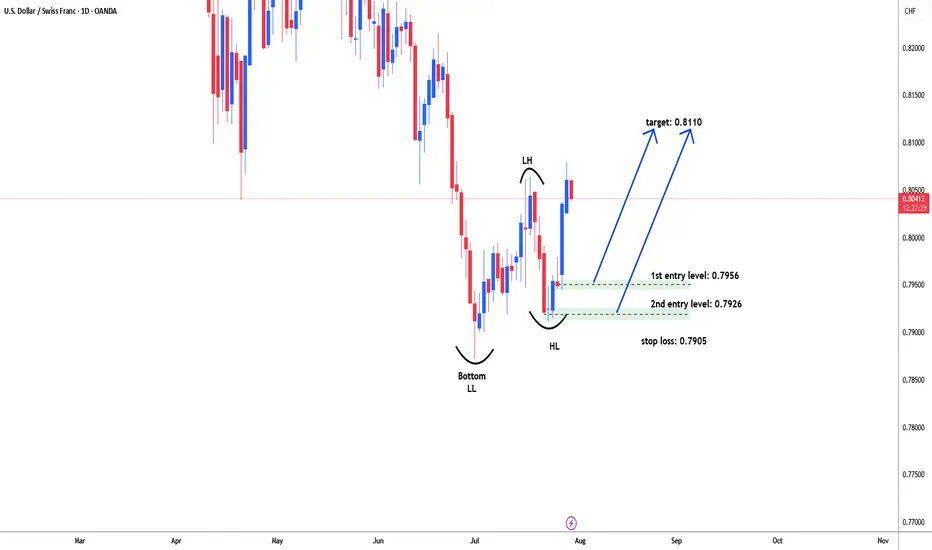
USDCHF possible bullish reversal for 0.8110#USDCHF forming higher high and higher low in daily time frame. broker initial resistance level as 0.8064 but did not hold price above it. need patient for pullback to test demand zone for another leg higher. Price could not breach lower low level 0.7873 and start moving higher. there are two different demand levels for long i.e. 0.7956 & 0.7626. stop loss below 0.7910 i.e 0.7985. target: 0.8110
USDCHF Technical Analysis – Potential Rejection from Resistance USDCHF Technical Analysis – Potential Rejection from Resistance
🔍 Chart Overview:
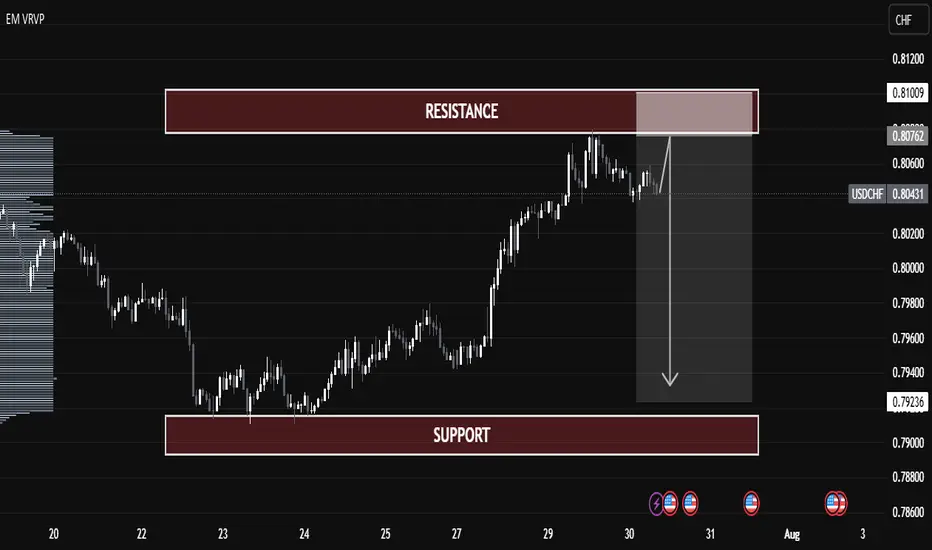
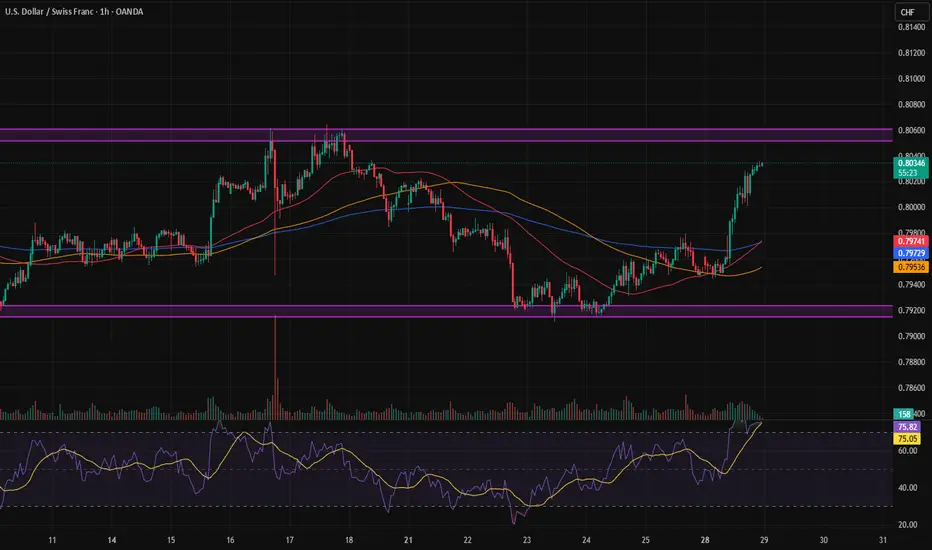
Current Price: 0.80456
Resistance Zone: 0.80760 – 0.81009
Support Zone: 0.79000 – 0.79236
Price Action: The pair has rallied into a strong resistance zone but is showing signs of exhaustion.
📌 Key Observations:
Volume Profile Insight:
Price has entered a low-volume area near resistance, indicating potential weakness in demand above 0.80800.
Resistance Rejection:
Price tested the 0.80760–0.81009 resistance range and failed to break through decisively.
A potential fake breakout or bull trap could be forming.
Bearish Projection:
If price confirms rejection from resistance, we may see a drop toward the support zone (0.79000 – 0.79236).
This would complete a classic resistance-to-support rotation.
Bearish Confirmation:
A bearish candle formation or break below 0.80350 can trigger short entries.
Ideal risk-reward favors a short setup here.
📉 Trade Plan (Educational Purpose Only):
Entry Zone: 0.80750 – 0.80950
Stop Loss: Above 0.81100
Take Profit Target: 0.79250
Risk-Reward: Approx. 1:2.5
🔻 Summary:
USDCHF is trading near a major resistance zone with weak bullish momentum. If confirmed, a sharp reversal toward support is expected, making this a potentially strong short opportunity.
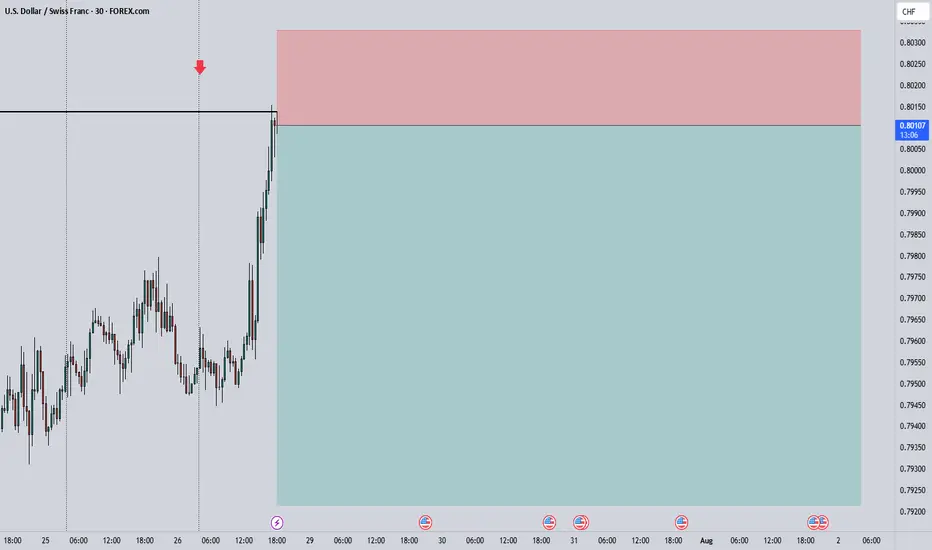
USDCHF 30.07.2025~+ Lack of credibility, general narrative around the USD & Fed, shaky geopolitics
~+ Timing: dollar bulls' profit-taking into the Fed Rate Decision
~+ Swiss KOF Beat
* USD move from the US-EU trade deal looks overdone against multiple assets

USDCHF sell Looks a good place to sell for a pullback down here finding resistance at this zone and forming structural i dictations for a sell off , I will e selling at 0.80.558 and looking for ta,e profits at 0.79157 that's a 1.75% drop down


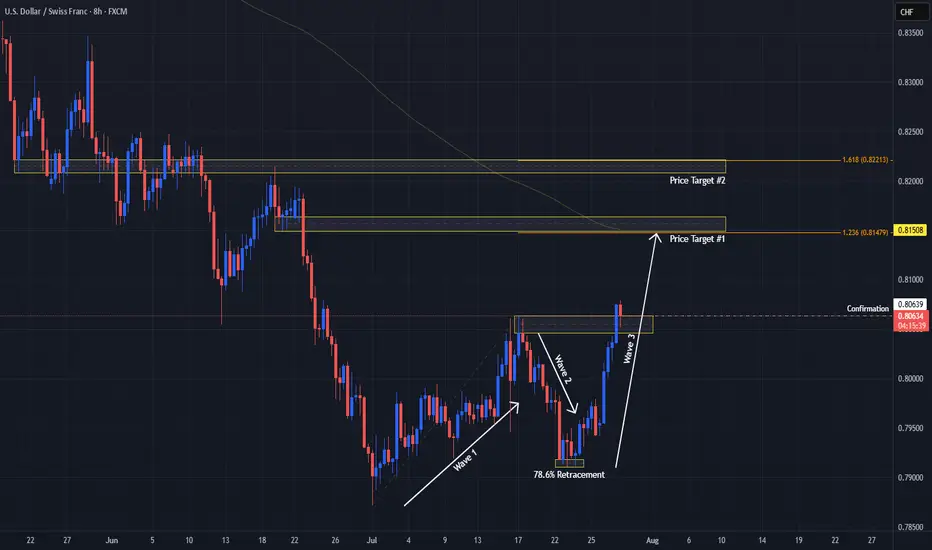
USDCHF Signals Wave 3 With Double Bottom!OANDA:USDCHF has not only formed a Double Bottom Pattern but also may be generating a potential Elliot Impulse Wave!
Bulls are giving the April & June Lows of .8038 - .8088, another go for a second time today after surpassing the first attempted High created July 17th to break above the level.
So far Price today has broken above July 17th Highs and if Bulls are able to hold this level, this would Confirm:
1) A Breakout of the Double Bottom
2) Wave 3 continuing the Impulse Wave in the Elliot Wave Theory!
The Higher Low @ .79106 created on July 25th, broke the downtrend structure as a 78.6% retracement of the Lower Low @ .78719 created July 1st which was a new 14 Year Low, finishing Wave 2 and initiating Wave 3 of the Impulse Wave.
The Extension of Wave 3 typically will end at the 1.236% or 1.618% level which gives us 2 potential Price Targets to start:
Price Target 1) .81479 - 1.236%
Price Target 2) .82213 - 1.618%
Once Wave 3 has ended, we will look for opportunities at the Wave 4 - Wave 5 juncture!
USD/CHF ADDED TO WATCHLISTWe are watching for a possible reversal setup to form because momentum is very high and might help price action make a correction. Using the VMS reversal strategy we will wait for a shooting star with an engulfing candle down confirmation, volume will need to be strong and momentum needs to be hooking down....all of this before we consider it as a trade. It looks promising. We will keep watching.

USDCHF LongLook for long after the Daily FVG is made. A CHOCH on m1 in the daily FVG will be a buy signal.

USD/CHF Just Broke Out of an Ascending Triangle - LONG📈 Price has just broken out of an ascending triangle pattern.
I’m now patiently waiting for a retest of the breakout zone to explore a potential long opportunity.
Let’s see if the market gives us a clean entry! 💹🧠
USD_CHF SHORT FROM RESISTANCE|
✅USD_CHF has been growing recently
And the pair seems locally overbought
So as the pair is approaching
A horizontal resistance of 0.8064
Price decline is to be expected
SHORT🔥
✅Like and subscribe to never miss a new idea!✅
Disclosure: I am part of Trade Nation's Influencer program and receive a monthly fee for using their TradingView charts in my analysis.

Should we place a sell limit or not?We can take a position based on the range strategy.
Note: When you have proper risk management, you can enter positions easily and with peace of mind.
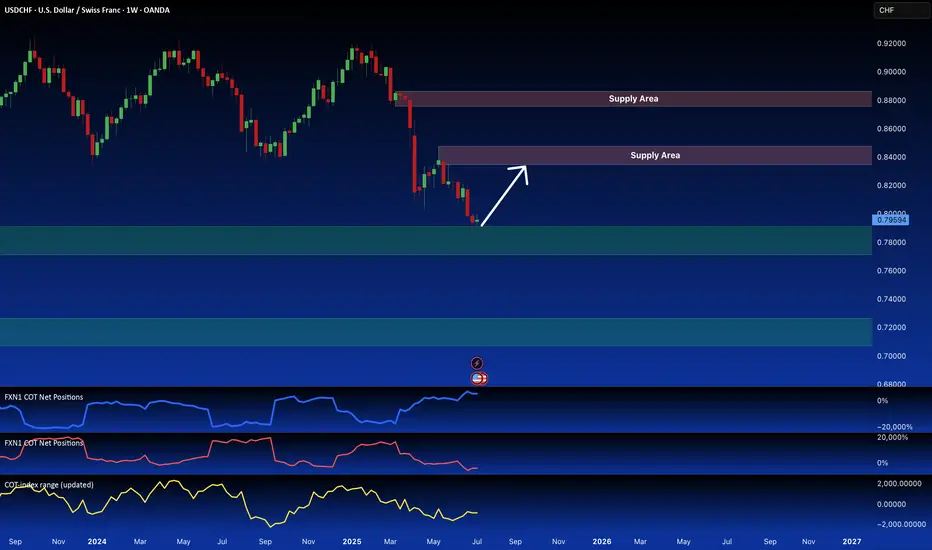
6S1! Futures Divergence Signals USD/CHF Long OpportunityI'm anticipating a bullish USD/CHF move. We're seeing a retest of a key daily demand zone, which is reinforced by a weekly supply area from the futures market (6S1! contract). Futures data suggests significant retail investor bullishness, contrasting with bearish positioning from commercial and hedge funds. This divergence suggests a potential long opportunity. I've also highlighted the next key demand area on the CFD USD/CHF chart.
✅ Please share your thoughts about 6S1! in the comments section below and HIT LIKE if you appreciate my analysis. Don't forget to FOLLOW ME; you will help us a lot with this small contribution.
USDCHF Short ProjectHi guys...😎
My custom indicator says it's time to do a Short Project on USDCHF with 3 key reasons:
1. Price Drivers: institutional shorting
2. Trend: down
3. Momentum: bearish
Action: waiting for entry on the intraday timeframe (entry will be published further)
USDCHF resistance retestThe USD/CHF pair is currently trading with a bearish bias, aligned with the broader downward trend. Recent price action shows a retest of the falling resistance, suggesting a temporary relief rally within the downtrend.
Key resistance is located at 0.8045, a prior consolidation zone. This level will be critical in determining the next directional move.
A bearish rejection from 0.8045 could confirm the resumption of the downtrend, targeting the next support levels at 0.7900, followed by 0.7860 and 0.7810 over a longer timeframe.
Conversely, a decisive breakout and daily close above 0.8045 would invalidate the current bearish setup, shifting sentiment to bullish and potentially triggering a move towards 0.8080, then 0.8140.
Conclusion:
The short-term outlook remains bearish unless the pair breaks and holds above 0.8045. Traders should watch for price action signals around this key level to confirm direction. A rejection favours fresh downside continuation, while a breakout signals a potential trend reversal or deeper correction.
This communication is for informational purposes only and should not be viewed as any form of recommendation as to a particular course of action or as investment advice. It is not intended as an offer or solicitation for the purchase or sale of any financial instrument or as an official confirmation of any transaction. Opinions, estimates and assumptions expressed herein are made as of the date of this communication and are subject to change without notice. This communication has been prepared based upon information, including market prices, data and other information, believed to be reliable; however, Trade Nation does not warrant its completeness or accuracy. All market prices and market data contained in or attached to this communication are indicative and subject to change without notice.

Sell USDCHFA bearish flag has emerged on the 4H chart on USDCHF. We can expect price to short massively this week.

USD REGAINED STRENGTH USD regain strength over CHF at the price of 0.79420
CHF can gain balance the zone 0.79743 to 0.79524 giving an edge to the USD.
📊📉📈🚀🚀
